. 2015 Aug 19;87(4):813-26.
doi: 10.1016/j.neuron.2015.07.023.

A Temporary Gating of Actin Remodeling during Synaptic Plasticity Consists of the Interplay between the Kinase and Structural Functions of CaMKII

Affiliations

A Temporary Gating of Actin Remodeling during Synaptic Plasticity Consists of the Interplay between the Kinase and Structural Functions of CaMKII

Karam Kim et al. Neuron. .

Erratum in

  • Neuron. 2015 Oct 21;88(2):433

Abstract

The structural modification of dendritic spines plays a critical role in synaptic plasticity. CaMKII is a pivotal molecule involved in this process through both kinase-dependent and independent structural functions, but the respective contributions of these two functions to the synaptic plasticity remain unclear. We demonstrate that the transient interplay between the kinase and structural functions of CaMKII during the induction of synaptic plasticity temporally gates the activity-dependent modification of the actin cytoskeleton. Inactive CaMKII binds F-actin, thereby limiting access of actin-regulating proteins to F-actin and stabilizing spine structure. CaMKII-activating stimuli trigger dissociation of CaMKII from F-actin through specific autophosphorylation reactions within the F-actin binding region and permits F-actin remodeling by regulatory proteins followed by reassociation and restabilization. Blocking the autophosphorylation impairs both functional and structural plasticity without affecting kinase activity. These results underpin the importance of the interplay between the kinase and structural functions of CaMKII in defining a time window permissive for synaptic plasticity.


Conflict of interest statement

Conflict of interest statement:

YH is partly supported by Takeda Pharmaceutical Co. Ltd. and Fujitsu Laboratories.

Figures
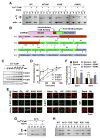
Figure 1
Figure 1. Autophosphorylation of the F-actin binding region dissociates CaMKIIβ from F-actin
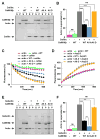
(A) CaMKIIβ activation and subsequent autophosphorylation negatively regulates the interaction of CaMKIIβ with F-actin. Purified CaMKIIβ from Sf9 or HEK293T cells were incubated with purified F-actin from human platelets for 5 min with or without 50 μM autocamtide-2 related inhibitory peptide (AIP). CaMKIIβ was activated by Ca2+, calmodulin and ATP (Ca2+/CaM), followed by incubation for another 5 min. The reaction was then continued with or without EGTA for 20 min. The mixtures were centrifuged at low speed so that only bundled F-actin precipitates while unbundled F-actin remains in the supernatant. The supernatant (S) and pellet (P) fractions were subjected to SDS-PAGE and stained with Coomassie Brilliant Blue. WT: wild type; K43R: kinase-null mutant; A303R: CaM-binding deficient mutant. β* indicates band-shifted population because of phosphorylation. A303R is larger than others because of the purification tag. (B) Results of LC-MS/MS analysis of CaMKIIβ phosphorylation. R1–R4 is based on splice variants. See Fig. S1A, B, and Table S1 for full details. (C) Time course of phosphorylation at T287, S331, and S371. (D) Quantification of band intensities in (C), n=3. (E) Phosphorylation of S331 and S371 of endogenous CaMKIIβ. Dissociated hippocampal neurons were treated with 200 μM glycine for 3 min and stained with phospho-specific and CaMKIIβ antibodies. Before stimulation, neurons were preincubated for 1 hour with 10 μM of each inhibitor. (F) Quantification of fluorescence intensity of spines in (E). The intensity of the phospho-specific antibody channel was normalized to that of the CaMKIIβ antibody channel in each spine to cancel out the accumulation of CaMKIIβ after stimulation. n=18/17 (basal), 15/20 (glycine), 12/9 (AIP), 6/8 (KN-93) and 13/16 (KN-92) neurons for P-S331/P-S371. 10–20 spines were quantified from each neuron. Kruskal-Wallis test followed by Mann-Whitney U test with Bonferroni correction was used. (G) Phosphoblock All A mutant in the F-actin binding region partly detached from F-actin in the presence of Ca2+/CaM but reassociated with F-actin upon chelation of Ca2+. The upward band-shift by Ca2+ stimulation confirms that All A was autophosphorylated at the remaining residues. (H) Phosphomimetic mutations on the F-actin binding region (All D) abolished F-actin binding activity. Experiments using narrower region-specific phospho-mimetic mutants (R1D-R4D, see (B)) showed that a region between amino acids 317–340 was mainly responsible for regulation of F-actin binding. Purified CaMKIIβ mutants proteins from Sf9 were used in (G) and (H). See also Figure S1. All error bars represent SEM.
Figure 2
Figure 2. CaMKIIβ inhibits the interaction of actin binding proteins with actin
(A–B) CaMKIIβ inhibits the F-actin severing activity of cofilin. F-actin was incubated with or without CaMKIIβ for 30 min before cofilin was added. After 5 min, the mixture was ultracentrifuged at high speed, supernatant (S) and pellet (P) fractions were separated on SDS-PAGE. n=9. (C) CaMKIIβ slows down F-actin depolymerization by cofilin. F-actin (5% pyrene-labeled) was pre-incubated with or without CaMKIIβ for 20 min and dilution-induced depolymerization was monitored in the presence or absence of cofilin, n=9 (actin, actin+cofilin), 4 (actin+All A+cofilin), 3 (others). (D) CaMKIIβ inhibits the actin nucleating activity of the Arp2/3 complex. Polymerization of G-actin was recorded with the Arp2/3 complex and VCA domain of WASP protein, with or without CaMKIIβ, n=3. (E–F) Similar experiments to (A–B) except that gelsolin was used instead of cofilin, n=8. Kruskal-Wallis test followed by Mann-Whitney U test with Bonferroni correction was used. All error bars represent SEM.
Figure 3
Figure 3. Autophosphorylation of the F-actin binding region of CaMKIIβ regulates F-actin accumulation and dynamics in spines
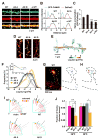
(A) Distribution of GFP-CaMKIIβ WT, mutants, or CaMKIIα (green) in the apical primary dendrite of a CA1 pyramidal neuron from a hippocampal slice culture co-transfected with DsRed2 (red). (B) The GFP and DsRed2 fluorescence intensity profiles across the line in (A). The peaks on the left of the plot correspond to the spine heads, and those on the right correspond to the dendritic shaft. The peak intensity of the dendritic shaft in the DsRed2 channel was adjusted to 1. (C) CaMKII accumulation in spines was normalized to spine volume. The spine accumulation was determined by the fluorescence intensity of (GFP/DsRed2) spine / (GFP/DsRed2) dendrite. CaMKIIβ WT, n=87/14 (number of spines/cells); All A, n=60/15; All D, n=76/15; CaMKIIα, n=49/13. (D) Single-molecule localization of mEos3.1-CaMKIIβ WT, All A, and All D binned at 40 nm in hippocampal dissociated culture. (E) An example of a spatial map of molecular mobility of CaMKIIβ WT where Deff was calculated and color-coded. (F) Histogram of Deff of mEos3.1-CaMKIIβ WT (n=8), All A (n=9) and All D mutants (n=11). The distribution was fitted with a double Gaussian curve. The individual Gaussian components are also shown. The inset shows the proportion of the area of fast and slow components. Statistical significance of WT vs All D, p=0.00762; All A vs All D, p=0.00068. (G) Sample molecule trajectories of mEos3.1-CaMKIIβ (right) and a density map of all localized molecules (left). Green and red points indicate the first and last localized position, respectively. (H) Diagram showing how track angle θ was calculated with respect to the center of the spine head to distinguish inwardly from outwardly directed molecules. (I) Sample plots of all tracked molecules from single spines of cells transfected with the indicated constructs. The vectors show θ and velocity of each molecule. Red indicates inward tracks and black indicates outward. 0 and 180 degrees represent directly toward and away from the center, respectively. Note that the number of the All D molecules is less than the others due to poor spine accumulation. (J) Summary of (I), showing the fraction of tracks with inward directionality for actin (n = 31/7 spines/neurons), CaMKIIβ WT (n=29/7), All D (n=35/9) at 25 °C. At 35 °C, actin (n=22/7), CaMKIIβ WT (n=47/10), All A (n=82/18) and CaMKIIβ All D (n=25/6). The All D mutant was statistically different from other groups (p=0.00085, df=3, F=5.705). Kruskal-Wallis test followed by Mann-Whitney U test with Bonferroni correction (C and F) or two-way unbalanced Analysis of Variance followed by t-test with Bonferroni correction (J) was used. See also Figure S2. All error bars represent SEM.
Figure 4
Figure 4. Inhibition of dissociation of CaMKIIβ from F-actin impairs structural LTP of hippocampal CA1 neurons
(A) CaMKIIβ-actin interaction monitored by FRET-FLIM. Hippocampal slice cultures were transfected with GFP or GFP-CaMKIIβ WT or mutants (all with silent mutations to make them resistant to shRNA) plus mRFP-actin along with CaMKIIβ shRNA. Fluorescence lifetime of GFP in spines was measured. CaMKIIβ WT, K43R, A303R, and All A showed basal interaction with F-actin while All D did not. GFP, n=122/13 (number of spines/cells); CaMKIIβ WT, n=350/29; K43R, n=111/11; A303R, n=96/10; All A, n=97/5; All D, n=134/10. (B, C) Induction of sLTP by glutamate uncaging causes a transient dissociation of CaMKIIβ from F-actin in a manner requiring autophosphorylation within the F-actin binding region. FLIM images of dendritic spines expressing either CaMKIIβ WT, K43R, A303R, or All A mutants before and after glutamate uncaging. Timestamp in sec (B). Time course of lifetime change (C). CaMKIIβ WT, n=20/6 (spines/cells); K43R, n=19/6; A303R, n=21/7; All A, n=15/5. (D–G) Inhibition of dissociation of CaMKIIβ from F-actin impairs sLTP. (D) Images of spines before and after glutamate uncaging expressing DsRed2 (Cont.), DsRed2 plus CaMKIIβ shRNA and CaMKIIβ WT, or DsRed2 plus CaMKIIβ shRNA and All A. WT and All A cDNA contained silent mutations at the shRNA target sequence. Timestamp in minutes. (E) Summary of multiple spines. Control, n=22/12 (spines/neuron); CaMKIIβ WT, n=21/10; All A, n=20/10. (F) Dose-dependence of All A mutant. WT and All A mutants were transfected with different ratios while keeping the total amount of plasmid DNA constant. All A 0% (WT), n=21/10 (spines/neurons); All A 50%, n=28/14; All A 75%, n=16/8; All A 100%, n=20/10. (G) Summary of spine size change, 1 min after sLTP induction. Control, n=22/12 (spines/neurons); WT, n=21/10; All A, n=20/10; K43R, n=18/4; A303R, n=18/5. Kruskal-Wallis test followed by Mann-Whitney U test with Bonferroni correction was used in (A), (C) between WT and mutants, and (G). For comparison between prestimulation level and 1st point after stimulation in (C), Mann-Whitney U test was used. See also Figure S3. All error bars represent SEM.
Figure 5
Figure 5. Impairment of sLTP by a dissociation-deficient CaMKIIβ mutant is coupled with a reduction in functional LTP
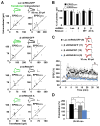
(A) Pairwise analysis of the effect of transfection on AMPA- and NMDA-R-mediated synaptic transmission. Hippocampal CA1 neurons in organotypic slice culture were transfected with plasmids expressing GFP, shRNA for luciferase (control) or CaMKIIβ, and CaMKIIβ WT or All A cDNA (with silent mutations to make them resistant to shRNA). Amplitude of synaptic response from pairs of transfected and neighboring untransfected cells are plotted. (B) Quantification of (A). There was a significant decrease in AMPA-R-mediated transmission in neurons expressing β shRNA/GFP (p= 0.0387, Mann-Whitney U-test). Luc shRNA/GFP, n=13 (pairs); β shRNA/GFP, n=12; β shRNA/WT, n=11; β shRNA/All A, n=11. (C) Down-regulation of CaMKIIβ with shRNA reduced LTP. CaMKIIβ WT rescued this but All A did not. The number of cells is in parenthesis. Sample traces show an average of baseline recordings (a, black) and recordings during 25–30 min (b, red). (D) Quantification of potentiation at 25–30 min after induction of LTP (Kruskal-Wallis test followed by Mann-Whitney U test with Bonferroni correction). All error bars represent SEM.
Figure 6
Figure 6. CALI induced dissociation of CaMKIIβ from F-actin in COS cells
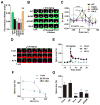
(A) Domain structure of the constructs. ABR: F-actin binding region; Assoc., association domain. (B) Two-photon excitation spectra of SuperNova (SN) and other fluorescent proteins used in CALI experiments. Emission fluorescence intensity of each protein in neuronal cell bodies was measured with two-photon excitation (10 mW, 700–1000 nm). (C) Dissociation of CaMKIIβ from F-actin by a Ca2+ ionophore. COS cells were transfected with GFP-βWT and Lifeact-mRuby. CaMKIIβ was activated by 10 μM ionomycin and the fluorescence intensity of both CaMKIIβ (green) and Lifeact (red) at the peripheral lamellipodial region was measured (n=9). (D) Dissociation of SN-βΔ-CFP from F-actin by CALI. Lamellipodial region (white rectangle) was illuminated with a two-photon laser at 720 nm, 4 sec. The fluorescence intensity in lamellipodium (closed circles) and the entire stimulated region (open circles) was monitored, n=11 cells. (E–G) Similar experiments to (D) except that cells were transfected with the indicated plasmids. In (G), visualization of SN-actin was facilitated by cotransfection of Lifeact-mRuby. GFP-βΔ, n=9; SN-βWT-CFP, n=8; SN-actin, n=11. (H) Summary of (D–G) at 2 min after CALI induction. Statistical significance compared with SN-βΔ-CFP by Kruskal-Wallis test followed by Mann-Whitney U test. See also Figure S4. All error bars represent SEM.
Figure 7
Figure 7. CaMKIIβ/F-actin dissociation has a permissive role in the sLTP
(A) Left: The localization of SN-βΔ-CFP before and immediately after CALI in spines. DsRed2 was coexpressed as a volume filler. Color code indicates the ratio between CFP and DsRed2 channels. A dendritic spine (circle) was illuminated with a two-photon laser at 1000 nm, 2 sec for CALI. Right: Time course of SN-βΔ-CFP localization change in the spine after CALI. CaMKIIβ enrichment was normalized to pre-stimulation levels in spines. Arrow indicates the time point for CALI. The data were fitted to a single exponential curve, calculated with the first post-stimulation imaging time point as zero. SN-βΔ-CFP CALI stimulated spines/neurons (CALI), n=12/5; SN-βΔ-CFP unstimulated spines (Neighbors), n=14/5. (B) Quantification of CALI effect on CaMKIIβ localization to dendritic spines. The average localization (%) compared to the dendrite was measured during 1–5 min after CALI. The level of SN-βΔ (or βWT)-CFP in dendritic spines and shaft before CALI was taken as 100% and 0%, respectively. CALI in SN-βΔ-CFP expressing spines/neurons, n=12/5; neighboring spines, n=14/5; SN-βWT-CFP, n=13/6. Statistical significance compared with SN-βWT-CFP by Dunnett test. (C) Effect of CALI-induced detachment of SN-βΔ on sLTP. Top: Images of spines coexpressing SN-βΔ, GFP, and CaMKIIβ shRNA that received CALI and uncaging (top), uncaging only (middle), and CALI only (bottom). The arrow indicates the time point of glutamate uncaging and/or CALI. Timestamps in min. Bottom: Time course assessment of spine size following both uncaging and CALI, n=19/13 (spines/neurons); CALI only, n=10/9; or uncaging only, n=13/7. The unstimulated neighboring spines (n=27/13) were also monitored. Spines were stimulated with glutamate uncaging immediately (< 30 sec) after CALI. The arrow indicates the time point of glutamate uncaging and/or CALI. (D) Summary of data in (C). The spine size was measured 1 min after uncaging with or without CALI and normalized to pre-stimulation levels using GFP signal. Uncaging and CALI of SN-βΔ All A, n=15/9 (spines/neurons); A303R, n=9/3; CALI only of SN-actin, n=12/3; and uncaging and CALI of RFP-βΔ, n=14/6. Others were same as in (C). Statistical significance compared with SN-βΔ (uncaging only) by Dunnett test. (E) Dependency of enlargement of dendritic spine on interval between CALI and glutamate uncaging. The spine size change was measured after 1 min of glutamate uncaging (in CALI→uncaging group) or CALI (in uncaging→CALI group). The fitting curves were obtained by a single exponential fit. Number of spines/neurons for each time point: t = −10 min, n=11/4; −5 min, n=10/5; −3 min, n=11/6; −1.5 min, n=9/4; 0.5 min, n=15/5; 1.5 min, n=11/4; 5 min, n=11/5; 10 min, n=11/4. (F) Effect of CaMKIIβ CALI on cofilin-1 localization in spines. Left: subcellular localization of cofilin-1-CFP before and immediately after CaMKIIβ CALI in spines. DsRed2 was coexpressed with cofilin-1-CFP and SN-βΔ (or βWT) as a volume filler. Color coding same as (A). Right: Time course of change in spine cofilin-1-CFP localization. The cofilin-1 WT-CFP with SN-βΔ was fitted with single exponential. Cofilin-1 WT-CFP with SN-βΔ (cof-1 WT/SN-βΔ), n=15/5 (spines/neurons); Cofilin-1 S3D-CFP with SN-βΔ (cof1 S3D/SN-βΔ), n=15/6; coflin-1 WT with SN-βWT (cof-1 WT/SNβWT), n=15/7. See also Figure S5. All error bars represent SEM.
Figure 8
Figure 8. Role of CaMKIIβ/F-actin as a gate that regulates the structural plasticity of dendritic spines
A model for the ‘gating’ mechanism that regulates synaptic structures. Basal: At resting synapses, CaMKII bound to F-actin prevents the interaction between F-actin and actin modulating proteins (orange arrow and red line). Also, it enables structural reinforcement of F-actin by bundling and tethering it to the plasma membrane, stabilizing spine structure. LTP induction: Active CaMKII autophosphorylates the F-actin binding region and dissociates from F-actin. The freed F-actin is accessible by actin modulating proteins, which are activated by a signaling cascade triggered by glutamate receptor activation. This works as a coincidence detection mechanism that results in changes in spine cytoskeletal structure. LTP maintenance: Upon returning to the unphosphorylated state, CaMKII binds and bundles reorganized F-actin, and maintains this remodeled spine structure.

References

    1. Baucum AJ, 2nd, Shonesy BC, Rose KL, Colbran RJ. Quantitative proteomics analysis of CaMKII phosphorylation and the CaMKII interactome in the mouse forebrain. ACS chemical neuroscience. 2015;6:615–631. - PMC - PubMed
    1. Borgesius NZ, van Woerden GM, Buitendijk GH, Keijzer N, Jaarsma D, Hoogenraad CC, Elgersma Y. βCaMKII plays a nonenzymatic role in hippocampal synaptic plasticity and learning by targeting αCaMKII to synapses. J Neurosci. 2011;31:10141–10148. - PMC - PubMed
    1. Bosch M, Castro J, Saneyoshi T, Matsuno H, Sur M, Hayashi Y. Structural and molecular remodeling of dendritic spine substructures during long-term potentiation. Neuron. 2014;82:444–459. - PMC - PubMed
    1. Bosch M, Hayashi Y. Structural plasticity of dendritic spines. Curr Opin Neurobiol. 2012;22:383–388. - PMC - PubMed
    1. Brocke L, Chiang LW, Wagner PD, Schulman H. Functional implications of the subunit composition of neuronal CaM kinase II. J Biol Chem. 1999;274:22713–22722. - PubMed

Publication types

Substances