

Interplay between promoter methylation and chromosomal loss in gene silencing at 3p11-p14 in cervical cancer
- PMID: 26291246
- PMCID: PMC4844207
- DOI: 10.1080/15592294.2015.1085140
Interplay between promoter methylation and chromosomal loss in gene silencing at 3p11-p14 in cervical cancer
Abstract
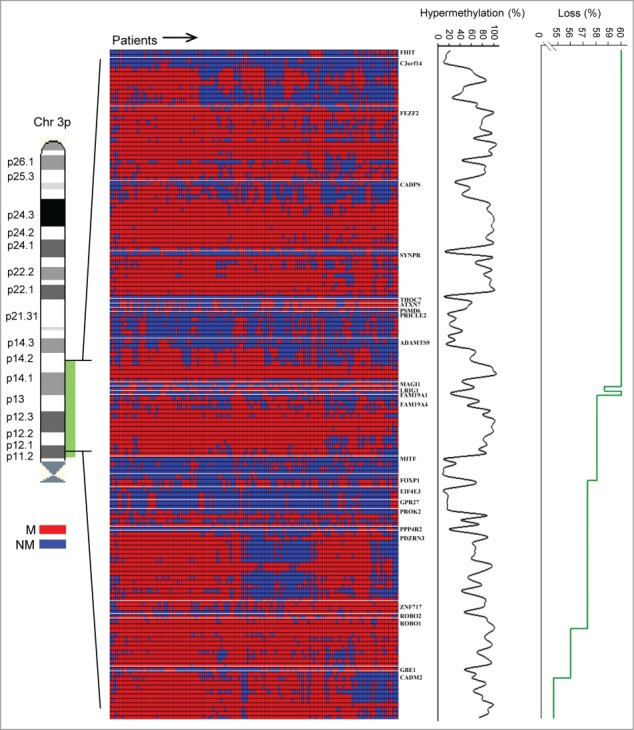
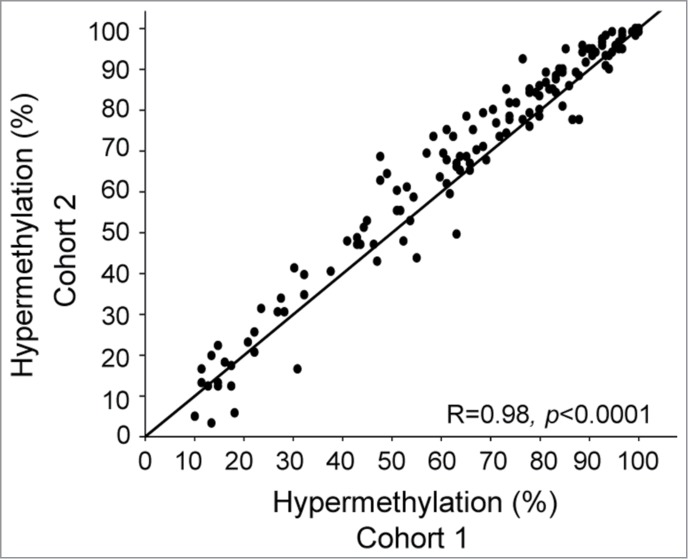
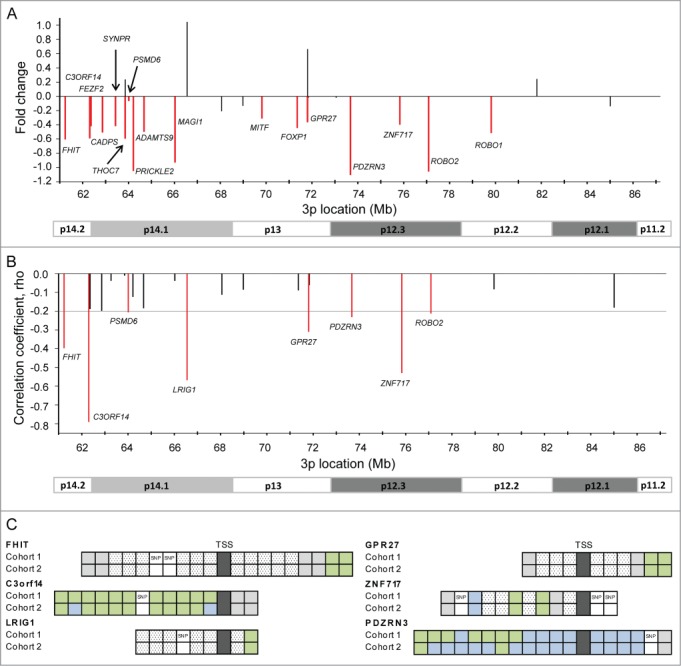
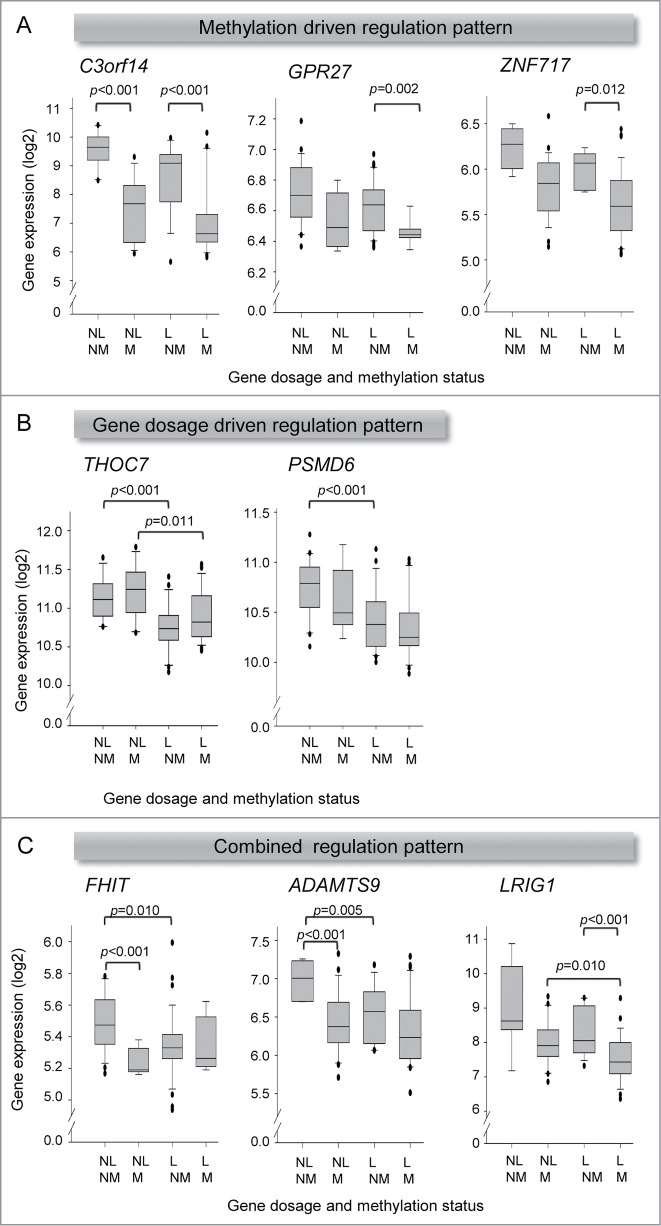
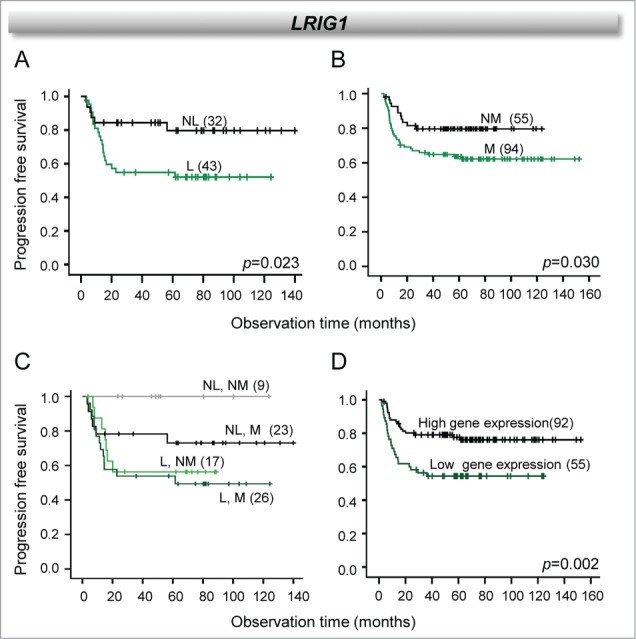
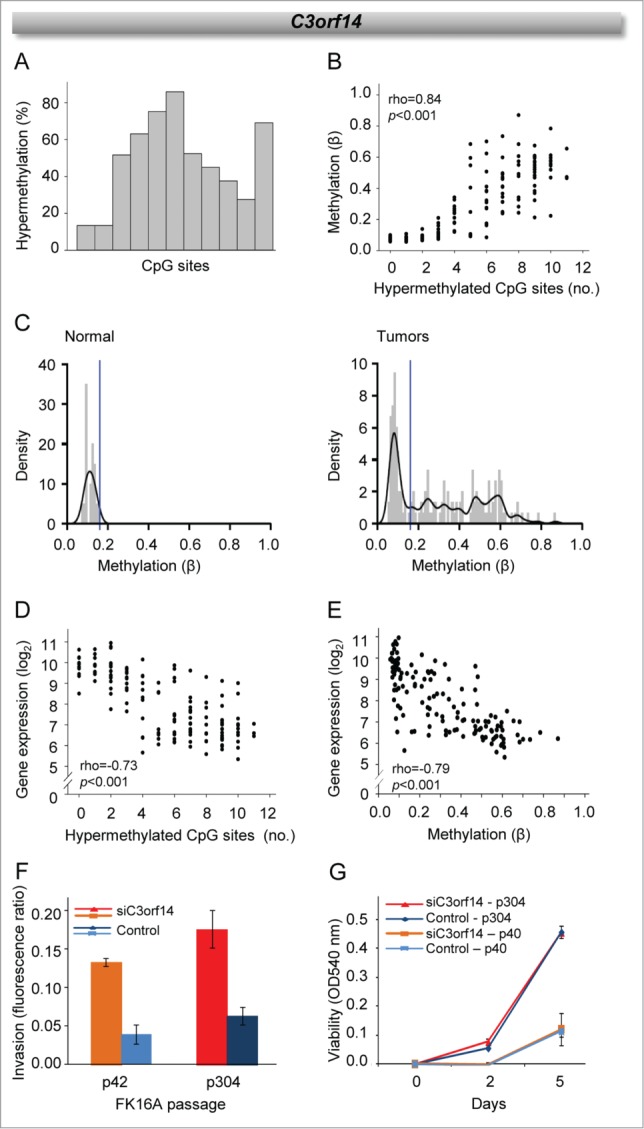
Loss of 3p11-p14 is a frequent event in epithelial cancer and a candidate prognostic biomarker in cervical cancer. In addition to loss, promoter methylation can participate in gene silencing and promote tumor aggressiveness. We have performed a complete mapping of promoter methylation at 3p11-p14 in two independent cohorts of cervical cancer patients (n = 149, n = 121), using Illumina 450K methylation arrays. The aim was to investigate whether hyperm-ethylation was frequent and could contribute to gene silencing and disease aggressiveness either alone or combined with loss. By comparing the methylation level of individual CpG sites with corresponding data of normal cervical tissue, 26 out of 41 genes were found to be hypermethylated in both cohorts. The frequency of patients with hypermethylation of these genes was found to be higher at tumor stages of 3 and 4 than in stage 1 tumors. Seventeen of the 26 genes were transcriptionally downregulated in cancer compared to normal tissue, whereof 6 genes showed a significant correlation between methylation and expression. Integrated analysis of methylation, gene dosage, and expression of the 26 hypermethylated genes identified 3 regulation patterns encompassing 8 hypermethylated genes; a methylation driven pattern (C3orf14, GPR27, ZNF717), a gene dosage driven pattern (THOC7, PSMD6), and a combined methylation and gene dosage driven pattern (FHIT, ADAMTS9, LRIG1). In survival analysis, patients with both hypermethylation and loss of LRIG1 had a worse outcome compared to those harboring only hypermethylation or none of the events. C3orf14 emerged as a novel methylation regulated suppressor gene, for which knockdown was found to promote invasive growth in human papilloma virus (HPV)-transformed keratinocytes. In conclusion, hypermethylation at 3p11-p14 is common in cervical cancer and may exert a selection pressure during carcinogenesis alone or combined with loss. Information on both events could lead to improved prognostic markers.
Keywords: 3p; cervical cancer; chromosomal loss; gene expression; integrative genomic profiling; promoter methylation; tumor suppressor genes.
Figures
Similar articles
-
Hypermethylation of the tumor suppressor gene RASSFIA and frequent concomitant loss of heterozygosity at 3p21 in cervical cancers.Int J Cancer. 2003 Jun 10;105(2):204-9. doi: 10.1002/ijc.11051. Int J Cancer. 2003. PMID: 12673680
-
[Correlation between methylation of 5'-CpG islands and inactivation of FHIT gene in cervical cancer].Ai Zheng. 2005 Jan;24(1):7-11. Ai Zheng. 2005. PMID: 15642192 Chinese.
-
Exploring breast carcinogenesis through integrative genomics and epigenomics analyses.Int J Oncol. 2014 Nov;45(5):1959-68. doi: 10.3892/ijo.2014.2625. Epub 2014 Aug 27. Int J Oncol. 2014. PMID: 25175708
-
CpG island hypermethylation and tumor suppressor genes: a booming present, a brighter future.Oncogene. 2002 Aug 12;21(35):5427-40. doi: 10.1038/sj.onc.1205600. Oncogene. 2002. PMID: 12154405 Review.
-
Comparison of genome-wide analysis techniques to DNA methylation analysis in human cancer.J Cell Physiol. 2018 May;233(5):3968-3981. doi: 10.1002/jcp.26176. Epub 2017 Oct 4. J Cell Physiol. 2018. PMID: 28888056 Review.
Cited by
-
Functional impact of multi-omic interactions in lung cancer.Front Genet. 2024 Feb 8;15:1282241. doi: 10.3389/fgene.2024.1282241. eCollection 2024. Front Genet. 2024. PMID: 38389572 Free PMC article.
-
DNA methylation and copy number alterations in the progression of HPV-associated high-grade vulvar intraepithelial lesion.Int J Cancer. 2025 May 15;156(10):1926-1935. doi: 10.1002/ijc.35366. Epub 2025 Feb 12. Int J Cancer. 2025. PMID: 39936378 Free PMC article.
-
The use of host cell DNA methylation analysis in the detection and management of women with advanced cervical intraepithelial neoplasia: a review.BJOG. 2021 Feb;128(3):504-514. doi: 10.1111/1471-0528.16395. Epub 2020 Aug 9. BJOG. 2021. PMID: 32619334 Free PMC article. Review.
-
The 3p14.2 tumour suppressor ADAMTS9 is inactivated by promoter CpG methylation and inhibits tumour cell growth in breast cancer.J Cell Mol Med. 2018 Feb;22(2):1257-1271. doi: 10.1111/jcmm.13404. Epub 2017 Nov 29. J Cell Mol Med. 2018. PMID: 29193730 Free PMC article.
-
Considerations for feature selection using gene pairs and applications in large-scale dataset integration, novel oncogene discovery, and interpretable cancer screening.BMC Med Genomics. 2020 Oct 22;13(Suppl 10):148. doi: 10.1186/s12920-020-00778-x. BMC Med Genomics. 2020. PMID: 33087122 Free PMC article.
References
-
- Feinberg AP, Tycko B. The history of cancer epigenetics. Nat Rev Cancer 2004; 4:143-53; PMID:14732866; http://dx.doi.org/10.1038/nrc1279 - DOI - PubMed
-
- Herman JG. Hypermethylation of tumor suppressor genes in cancer. Semin.Cancer Biol 1999; 9:359-67; http://dx.doi.org/10.1006/scbi.1999.0138 - DOI - PubMed
-
- Knuutila S, Aalto Y, Autio K, Bjorkqvist AM, El-Rifai W, Hemmer S, Huhta T, Kettunen E, Kiuru-Kuhlefelt S, Larramendy ML. et al.. DNA copy number losses in human neoplasms. Am.J.Pathol 1999; 155:683-94; PMID:10487825; http://dx.doi.org/10.1016/S0002-9440(10)65166-8 - DOI - PMC - PubMed
-
- De Strooper LM, van, Zummeren M, Steenbergen RD, Bleeker MC, Hesselink AT, Wisman GB, Snijders PJ, Heideman DA, Meijer CJ. CADM1, MAL and miR124-2 methylation analysis in cervical scrapes to detect cervical and endometrial cancer. J Clin Pathol 2014; 67:1067-71; PMID:25281766; http://dx.doi.org/10.1136/jclinpath-2014-202616 - DOI - PubMed
-
- Lando M, Holden M, Bergersen LC, Svendsrud DH, Stokke T, Sundfor K, Glad IK, Kristensen GB, Lyng H. Gene dosage, expression, and ontology analysis identifies driver genes in the carcinogenesis and chemoradioresistance of cervical cancer. PLoS Genet 2009; 5:e1000719; PMID:19911042; http://dx.doi.org/10.1371/journal.pgen.1000719 - DOI - PMC - PubMed
Publication types
MeSH terms
Substances
LinkOut - more resources
Full Text Sources
Other Literature Sources
Medical
Molecular Biology Databases
Research Materials
Miscellaneous