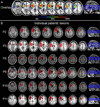
Specifying the role of the left prefrontal cortex in word selection
- PMID: 26291289
- PMCID: PMC4712683
- DOI: 10.1016/j.bandl.2015.07.007
Specifying the role of the left prefrontal cortex in word selection
Abstract
Word selection allows us to choose words during language production. This is often viewed as a competitive process wherein a lexical representation is retrieved among semantically-related alternatives. The left prefrontal cortex (LPFC) is thought to help overcome competition for word selection through top-down control. However, whether the LPFC is always necessary for word selection remains unclear. We tested 6 LPFC-injured patients and controls in two picture naming paradigms varying in terms of item repetition. Both paradigms elicited the expected semantic interference effects (SIE), reflecting interference caused by semantically-related representations in word selection. However, LPFC patients as a group showed a larger SIE than controls only in the paradigm involving item repetition. We argue that item repetition increases interference caused by semantically-related alternatives, resulting in increased LPFC-dependent cognitive control demands. The remaining network of brain regions associated with word selection appears to be sufficient when items are not repeated.
Keywords: Chronic stroke patients; Language production; Left prefrontal cortex; Proactive control; Semantic interference; Word selection.
Copyright © 2015 Elsevier Inc. All rights reserved.
Conflict of interest statement
We declare that the research reported here was conducted in the absence of any commercial or financial relationships that could be construed as a potential conflict of interest.
Figures


Similar articles
-
The involvement of left inferior frontal and middle temporal cortices in word production unveiled by greater facilitation effects following brain damage.Neuropsychologia. 2018 Dec;121:122-134. doi: 10.1016/j.neuropsychologia.2018.10.026. Epub 2018 Nov 1. Neuropsychologia. 2018. PMID: 30391568
-
Distinct loci of lexical and semantic access deficits in aphasia: Evidence from voxel-based lesion-symptom mapping and diffusion tensor imaging.Cortex. 2015 Jun;67:37-58. doi: 10.1016/j.cortex.2015.03.004. Epub 2015 Mar 19. Cortex. 2015. PMID: 25880795
-
Lexical selection with competing distractors: Evidence from left temporal lobe lesions.Psychon Bull Rev. 2018 Apr;25(2):710-717. doi: 10.3758/s13423-017-1301-0. Psychon Bull Rev. 2018. PMID: 28484950 Free PMC article.
-
The role of left prefrontal cortex in language and memory.Proc Natl Acad Sci U S A. 1998 Feb 3;95(3):906-13. doi: 10.1073/pnas.95.3.906. Proc Natl Acad Sci U S A. 1998. PMID: 9448258 Free PMC article. Review.
-
Organization of cognitive control within the lateral prefrontal cortex in schizophrenia.Arch Gen Psychiatry. 2009 Apr;66(4):377-86. doi: 10.1001/archgenpsychiatry.2009.10. Arch Gen Psychiatry. 2009. PMID: 19349307 Review.
Cited by
-
Reduced competition between tool action neighbors in left hemisphere stroke.Cortex. 2019 Nov;120:269-283. doi: 10.1016/j.cortex.2019.05.021. Epub 2019 Jun 19. Cortex. 2019. PMID: 31352237 Free PMC article.
-
Facilitation and interference in naming: A consequence of the same learning process?Cognition. 2017 Aug;165:61-72. doi: 10.1016/j.cognition.2017.04.012. Epub 2017 May 11. Cognition. 2017. PMID: 28501548 Free PMC article.
-
Distinct Effects of Lexical and Semantic Competition during Picture Naming in Younger Adults, Older Adults, and People with Aphasia.Front Psychol. 2016 Jun 2;7:813. doi: 10.3389/fpsyg.2016.00813. eCollection 2016. Front Psychol. 2016. PMID: 27458393 Free PMC article.
-
Convergence of distinct functional networks supporting naming and semantic recognition in the left inferior frontal gyrus.Hum Brain Mapp. 2020 Jun 15;41(9):2389-2405. doi: 10.1002/hbm.24953. Epub 2020 Feb 17. Hum Brain Mapp. 2020. PMID: 32065445 Free PMC article.
-
tDCS Facilitation of Picture Naming: Item-Specific, Task General, or Neither?Front Neurosci. 2018 Aug 10;12:549. doi: 10.3389/fnins.2018.00549. eCollection 2018. Front Neurosci. 2018. PMID: 30147643 Free PMC article.
References
-
- Alario F-X, Chainay H, Lehericy S, Cohen L. The role of the supplementary motor area (SMA) in word production. Brain Research. 2006;1076(1):129–143. - PubMed
-
- Alario FX, del Prado Martín FM. On the origin of the “cumulative semantic inhibition” effect. Memory & cognition. 2010;38(1):57–66. - PubMed
-
- Aristei S, Melinger A, Abdel Rahman R. Electrophysiological chronometry of semantic context effects in language production. Journal of Cognitive Neuroscience. 2011;23(7):1567–1586. - PubMed
-
- Baayen RH, Davidson DJ, Bates DM. Mixed-effects modeling with crossed random effects for subjects and items. Journal of Memory and Language. 2008;59(4):390–412.
Publication types
MeSH terms
Grants and funding
LinkOut - more resources
Full Text Sources
Other Literature Sources

