. 2015 Aug 20;11(8):e1004337.
doi: 10.1371/journal.pcbi.1004337. eCollection 2015 Aug.

Impact of School Cycles and Environmental Forcing on the Timing of Pandemic Influenza Activity in Mexican States, May-December 2009

Affiliations

Impact of School Cycles and Environmental Forcing on the Timing of Pandemic Influenza Activity in Mexican States, May-December 2009

James Tamerius et al. PLoS Comput Biol. .

Abstract

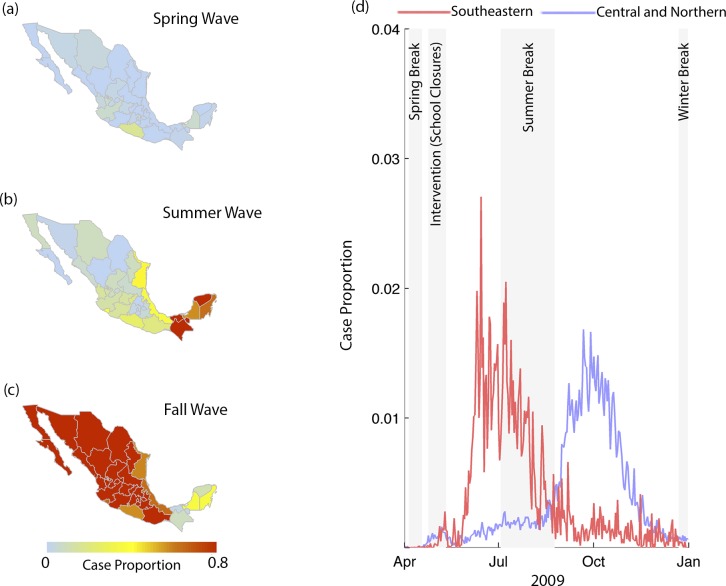
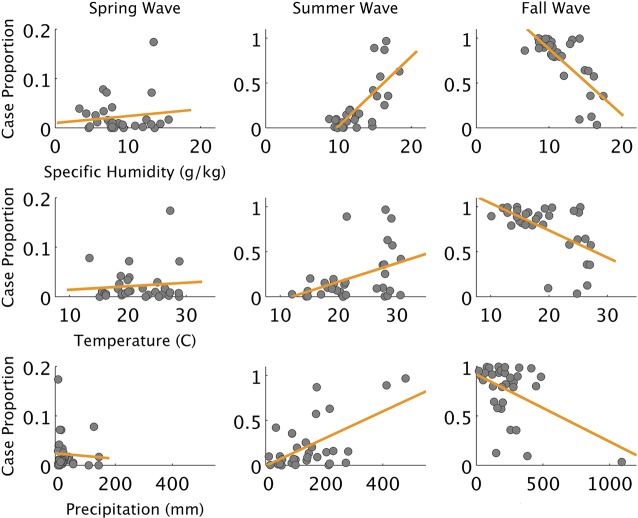
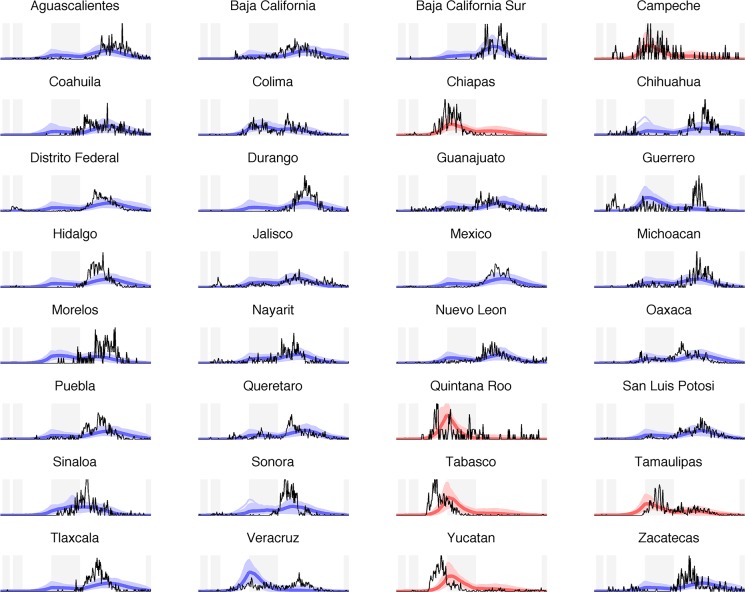
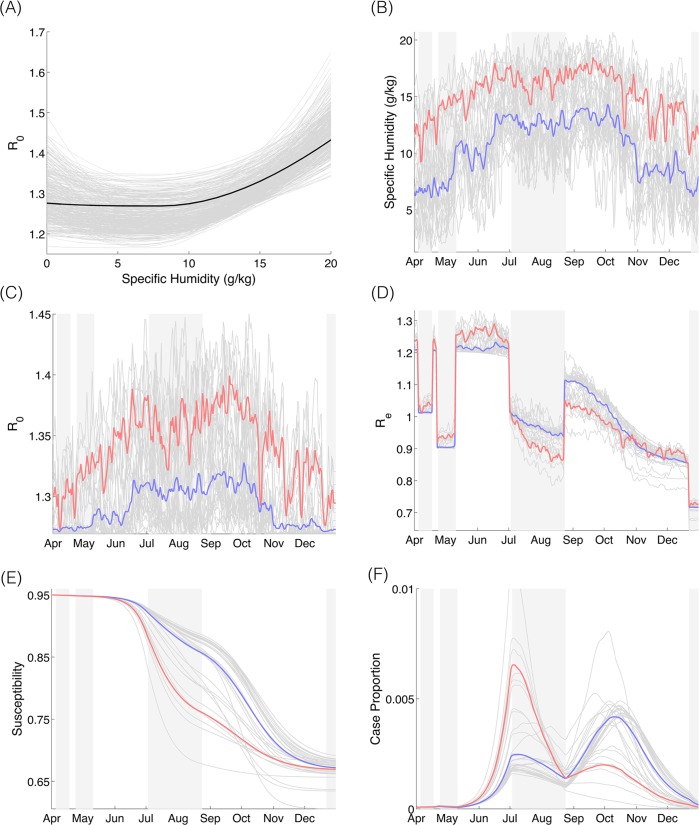
While a relationship between environmental forcing and influenza transmission has been established in inter-pandemic seasons, the drivers of pandemic influenza remain debated. In particular, school effects may predominate in pandemic seasons marked by an atypical concentration of cases among children. For the 2009 A/H1N1 pandemic, Mexico is a particularly interesting case study due to its broad geographic extent encompassing temperate and tropical regions, well-documented regional variation in the occurrence of pandemic outbreaks, and coincidence of several school breaks during the pandemic period. Here we fit a series of transmission models to daily laboratory-confirmed influenza data in 32 Mexican states using MCMC approaches, considering a meta-population framework or the absence of spatial coupling between states. We use these models to explore the effect of environmental, school-related and travel factors on the generation of spatially-heterogeneous pandemic waves. We find that the spatial structure of the pandemic is best understood by the interplay between regional differences in specific humidity (explaining the occurrence of pandemic activity towards the end of the school term in late May-June 2009 in more humid southeastern states), school vacations (preventing influenza transmission during July-August in all states), and regional differences in residual susceptibility (resulting in large outbreaks in early fall 2009 in central and northern Mexico that had yet to experience fully-developed outbreaks). Our results are in line with the concept that very high levels of specific humidity, as present during summer in southeastern Mexico, favor influenza transmission, and that school cycles are a strong determinant of pandemic wave timing.


Conflict of interest statement

JS discloses consulting for JT and Axon Advisors and partial ownership of SK Analytics.

Figures

Fig 1
Fig 1. Spatial and temporal structure of pandemic waves.
Cumulative case proportions (i.e., the number of infections during a time period divided by the total number of infections during the study period) for the (a) spring, (b) summer and (c) fall waves by state. (d) Time series of daily case proportion for each state, and case proportions averaged across southeastern (red), and central and northern states (blue). Altogether, the plots indicate that the spring wave was relatively minor relative to the summer and fall waves; and that the summer and the fall waves were geographically distinct. Cumulative case proportions for the (a) spring, (b) summer and (c) fall waves by state. (d) Time series of daily case proportion for each state, and case proportions averaged across southeastern, and central and northern states. The plots indicate that the spring wave was relatively minor relative to the summer and fall waves; and that the summer and the fall waves were geographically distinct.
Fig 2
Fig 2. Specification of R 0.
A diagram showing the three critical points (p 1, p 2, p 3) used to define the relationship between specific humidity and R 0. The points were allowed to vary across indicated ranges (dashed lines). The central point, p 1, was allowed to vary along the x- and y-axes; whereas p 2 and p 3 only varied along the y-axis as 0 and 23 g/kg were the bounds of specific humidity.
Fig 3
Fig 3. Influenza cases and environmental variables by wave.
Relationships between cumulative case proportion for spring, summer and fall waves and environmental variables. Strong relationships are observed between cumulative case proportions and environmental variables during the summer and fall waves; however, the relationship with precipitation is strongly influenced by outliers. Specific humidity has the strongest and most robust relationship for summer and fall waves. The relationships between the environment and the summer wave are opposite of those observed during the fall wave, likely due to spatial heterogeneity of population level susceptibility caused by the summer wave.
Fig 4
Fig 4. Model results.
Time series of case proportion from April 1—December 31 for each state in Mexico during 2009 pandemic. The light blue/red lines correspond to 5000 simulations from random draws from the posterior distributions of each parameter. The dark blue/red lines corresponds to the best-fit simulation based on AIC. The black lines correspond to observed case proportions, and the shaded areas in background correspond to spring vacation, period of school closures and intervention measures, summer vacation, and winter vacation, respectively.
Fig 5
Fig 5. Variability of R 0 and R e during May-December 2009 as a function of changes in specific humidity, interventions, school cycles, and susceptibility, and the resulting impact on pandemic influenza activity, as predicted by the model.
(A) The relationship between specific humidity and R 0. The gray lines are 500 samples generated from the posterior distributions, and the black line corresponds to the mean value of the posterior means. (B) The time series of average specific humidity for central and northern states (solid line) and southeastern states (dashed line). (C) Time series of R 0 for best-fit parameter combination. The step features are related to spring break, the intervention period, summer break and winter break, respectively. (D) Time series of simulated R e. (E) Time series of simulated population level susceptibility. (F) Time series of simulated case proportions. For B-F, shaded areas in background correspond to spring vacation, period of school closures and intervention measures, summer vacation, and winter vacation, respectively. The solid lines correspond to the central and northern states, and the dashed lines correspond to the southeastern states. The simulated values were generated using the mean value of the posterior means for each parameter.

References

    1. Tamerius JD, Shaman J, Alonso WJ, Bloom-Feshbach K, Uejio CK, Comrie A, et al. Environmental Predictors of Seasonal Influenza Epidemics across Temperate and Tropical Climates. Riley S, editor. PLoS Pathog. Public Library of Science; 2013;9: e1003194 10.1371/journal.ppat.1003194 - DOI - PMC - PubMed
    1. Finkelman BS, Viboud C, Koelle K, Ferrari MJ, Bharti N, Grenfell BT. Global Patterns in Seasonal Activity of Influenza A/H3N2, A/H1N1, and B from 1997 to 2005: Viral Coexistence and Latitudinal Gradients. Myer L, editor. PLoS ONE. Public Library of Science; 2007;2 10.1371/journal.pone.0001296 - DOI - PMC - PubMed
    1. Viboud C, Boëlle PY, Pakdaman K, Carrat F, Valleron AJ, Flahault A. Influenza epidemics in the United States, France, and Australia, 1972–1997. Emerging Infect Dis. 2004;10: 32–39. 10.3201/eid1001.020705 - DOI - PMC - PubMed
    1. Lowen AC, Mubareka S, Steel J, Palese P. Influenza Virus Transmission Is Dependent on Relative Humidity and Temperature. PLoS Pathog. Public Library of Science; 2007;3: e151–1476. 10.1371/journal.ppat.0030151 - DOI - PMC - PubMed
    1. Shaman J, Kohn M. Absolute humidity modulates influenza survival, transmission, and seasonality. Proc Natl Acad Sci USA. 2009;106: 3243–3248. 10.1073/pnas.0806852106 - DOI - PMC - PubMed

Publication types