

Validation of Cut-Points for Evaluating the Intensity of Physical Activity with Accelerometry-Based Mean Amplitude Deviation (MAD)
- PMID: 26292225
- PMCID: PMC4546343
- DOI: 10.1371/journal.pone.0134813
Validation of Cut-Points for Evaluating the Intensity of Physical Activity with Accelerometry-Based Mean Amplitude Deviation (MAD)
Abstract
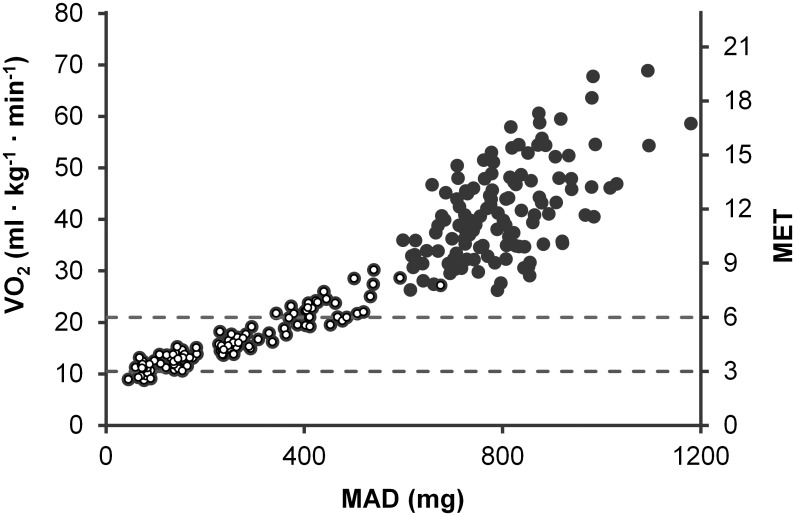
Purpose: Our recent study of three accelerometer brands in various ambulatory activities showed that the mean amplitude deviation (MAD) of the resultant acceleration signal performed best in separating different intensity levels and provided excellent agreement between the three devices. The objective of this study was to derive a regression model that estimates oxygen consumption (VO2) from MAD values and validate the MAD-based cut-points for light, moderate and vigorous locomotion against VO2 within a wide range of speeds.
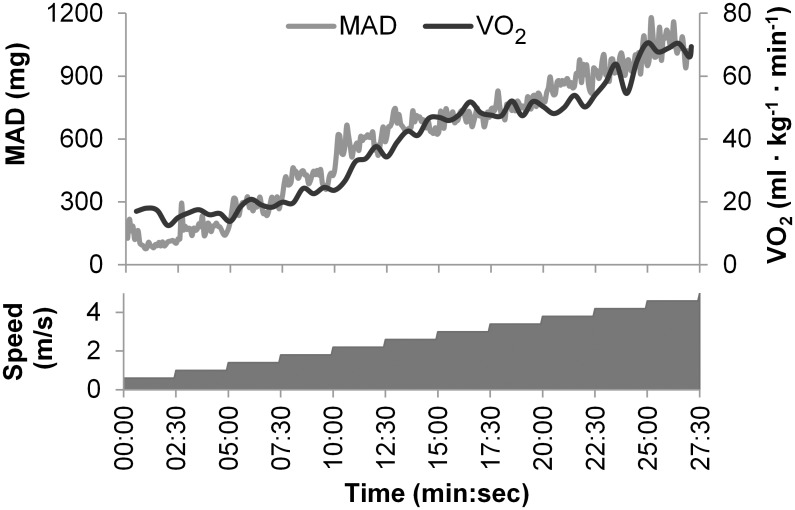
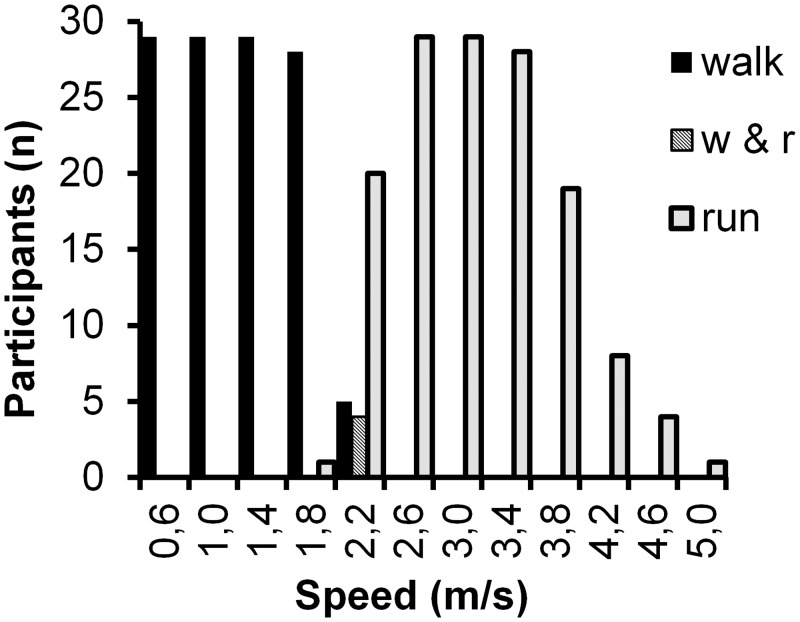
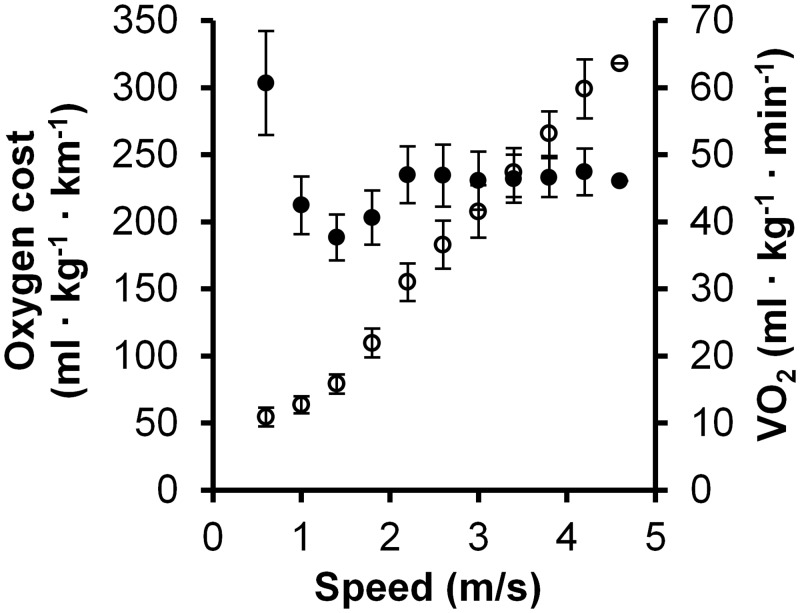
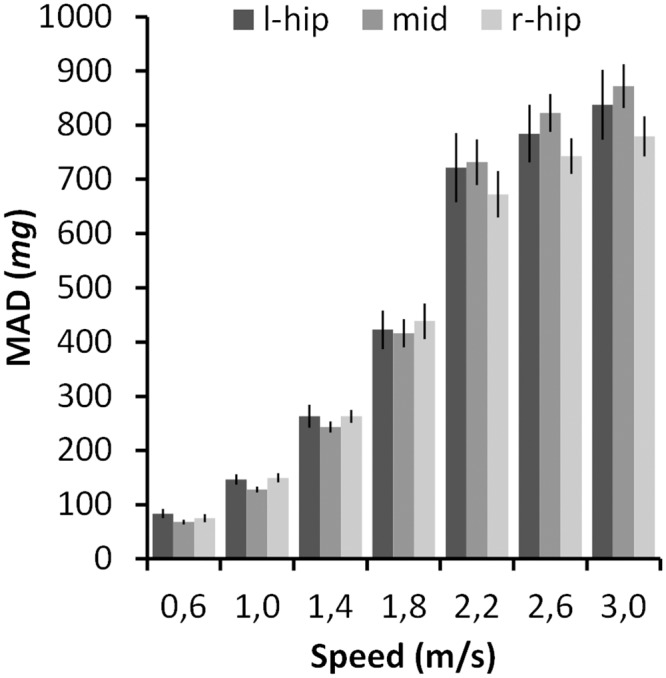
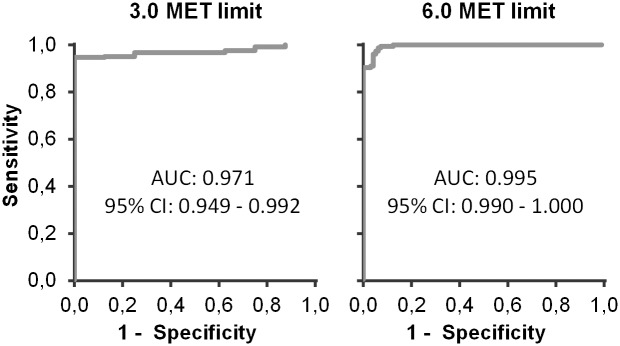
Methods: 29 participants performed a pace-conducted non-stop test on a 200 m long indoor track. The initial speed was 0.6 m/s and it was increased by 0.4 m/s every 2.5 minutes until volitional exhaustion. The participants could freely decide whether they preferred to walk or run. During the test they carried a hip-mounted tri-axial accelerometer and mobile metabolic analyzer. The MAD was calculated from the raw acceleration data and compared to directly measured incident VO2. Cut-point between light and moderate activity was set to 3.0 metabolic equivalent (MET, 1 MET = 3.5 ml · kg-1 · min-1) and between moderate and vigorous activity to 6.0 MET as per standard use.
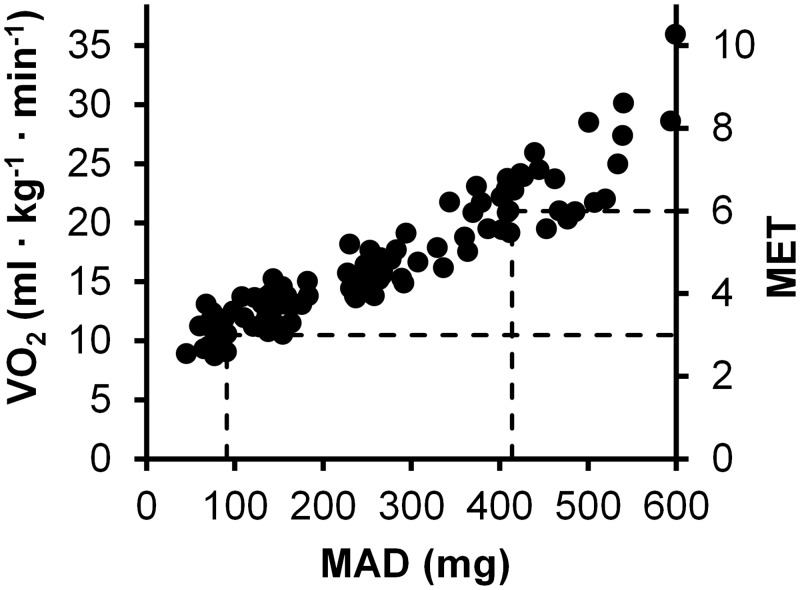
Results: The MAD and VO2 showed a very strong association. Within individuals, the range of r values was from 0.927 to 0.991 providing the mean r = 0.969. The optimal MAD cut-point for 3.0 MET was 91 mg (milligravity) and 414 mg for 6.0 MET.
Conclusion: The present study showed that the MAD is a valid method in terms of the VO2 within a wide range of ambulatory activities from slow walking to fast running. Being a device-independent trait, the MAD facilitates directly comparable, accurate results on the intensity of physical activity with all accelerometers providing tri-axial raw data.
Conflict of interest statement
Figures
Similar articles
-
A universal, accurate intensity-based classification of different physical activities using raw data of accelerometer.Clin Physiol Funct Imaging. 2015 Jan;35(1):64-70. doi: 10.1111/cpf.12127. Epub 2014 Jan 7. Clin Physiol Funct Imaging. 2015. PMID: 24393233
-
Performance of Different Accelerometry-Based Metrics to Estimate Oxygen Consumption during Track and Treadmill Locomotion over a Wide Intensity Range.Sensors (Basel). 2023 May 25;23(11):5073. doi: 10.3390/s23115073. Sensors (Basel). 2023. PMID: 37299803 Free PMC article.
-
Mean amplitude deviation calculated from raw acceleration data: a novel method for classifying the intensity of adolescents' physical activity irrespective of accelerometer brand.BMC Sports Sci Med Rehabil. 2015 Aug 7;7:18. doi: 10.1186/s13102-015-0010-0. eCollection 2015. BMC Sports Sci Med Rehabil. 2015. PMID: 26251724 Free PMC article.
-
Re-examination of accelerometer data processing and calibration for the assessment of physical activity intensity.Scand J Med Sci Sports. 2019 Oct;29(10):1442-1452. doi: 10.1111/sms.13470. Epub 2019 Jun 2. Scand J Med Sci Sports. 2019. PMID: 31102474 Review.
-
Physical activity and human energy expenditure.Curr Opin Clin Nutr Metab Care. 2004 Nov;7(6):607-13. doi: 10.1097/00075197-200411000-00004. Curr Opin Clin Nutr Metab Care. 2004. PMID: 15534427 Review.
Cited by
-
Relationship between liver fat content and lifestyle factors in adults with metabolic syndrome.Sci Rep. 2022 Oct 19;12(1):17428. doi: 10.1038/s41598-022-22361-3. Sci Rep. 2022. PMID: 36261605 Free PMC article.
-
Sedentary Thresholds for Accelerometry-Based Mean Amplitude Deviation and Electromyography Amplitude in 7-11 Years Old Children.Front Physiol. 2019 Aug 7;10:997. doi: 10.3389/fphys.2019.00997. eCollection 2019. Front Physiol. 2019. PMID: 31440167 Free PMC article.
-
Differences in sedentary time and physical activity among mothers and children using a movement-to-music video program in the home environment: a pilot study.Springerplus. 2016 Jan 28;5:93. doi: 10.1186/s40064-016-1701-z. eCollection 2016. Springerplus. 2016. PMID: 26848433 Free PMC article.
-
Physical activity has decreased in Finnish children and adolescents from 2016 to 2022.BMC Public Health. 2024 May 18;24(1):1343. doi: 10.1186/s12889-024-18854-7. BMC Public Health. 2024. PMID: 38762462 Free PMC article.
-
'Let's Move It' - a school-based multilevel intervention to increase physical activity and reduce sedentary behaviour among older adolescents in vocational secondary schools: a study protocol for a cluster-randomised trial.BMC Public Health. 2016 May 27;16:451. doi: 10.1186/s12889-016-3094-x. BMC Public Health. 2016. PMID: 27229682 Free PMC article. Clinical Trial.
References
-
- United States Department of Health and Human Services. Physical Activity Guidelines for Americans Be Active, Healthy, and Happy! Washington: United States Department of Health and Human Services; 2008.
-
- Jetté M, Sidney K, Blümchen G. Metabolic equivalents (METS) in exercise testing, exercise prescription, and evaluation of functional capacity. Clin Cardiol. 1990. August;13(8):555–65. - PubMed
-
- Troiano RP, Berrigan D, Dodd KW, Mâsse LC, Tilert T, McDowell M. Physical activity in the United States measured by accelerometer Med Sci Sports Exerc. 2008. January;40(1):181–8. - PubMed
-
- Esliger DW, Tremblay MS. Physical activity and inactivity profiling: the next generation. Can J Public Health. 2007;98(Suppl 2):195–207. - PubMed
Publication types
MeSH terms
LinkOut - more resources
Full Text Sources
Other Literature Sources
Medical
Miscellaneous
