

Dictionary-Driven Ischemia Detection From Cardiac Phase-Resolved Myocardial BOLD MRI at Rest
- PMID: 26292338
- PMCID: PMC4883113
- DOI: 10.1109/TMI.2015.2470075
Dictionary-Driven Ischemia Detection From Cardiac Phase-Resolved Myocardial BOLD MRI at Rest
Abstract
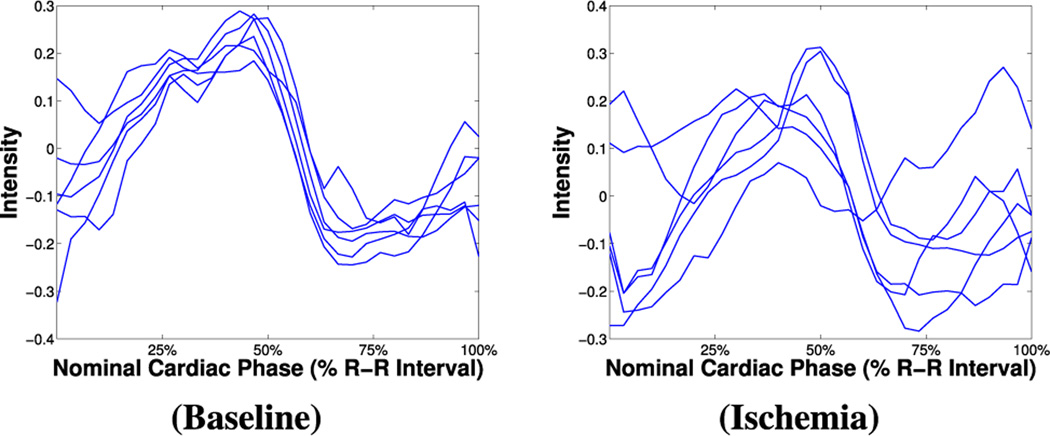
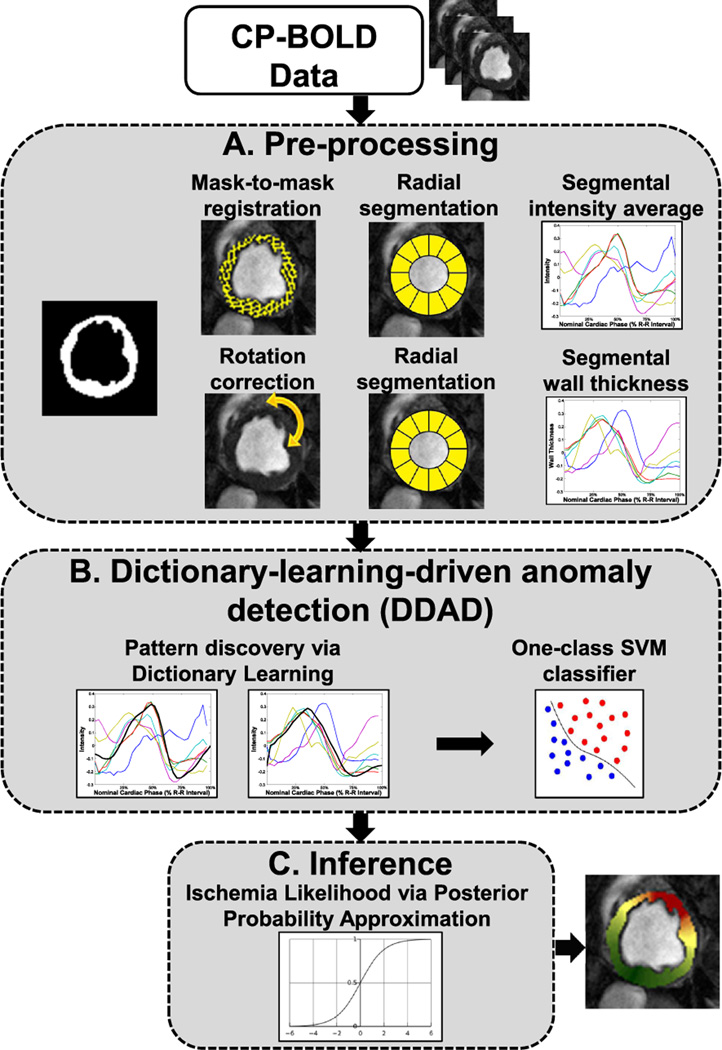
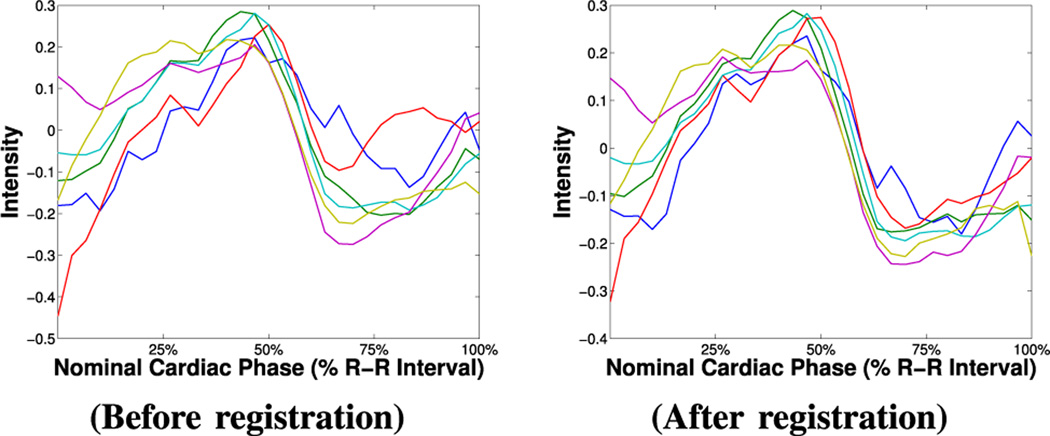
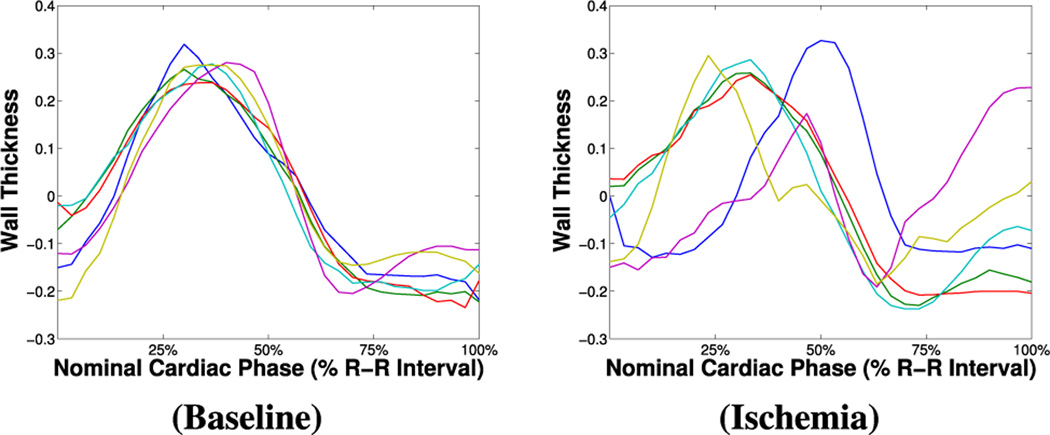
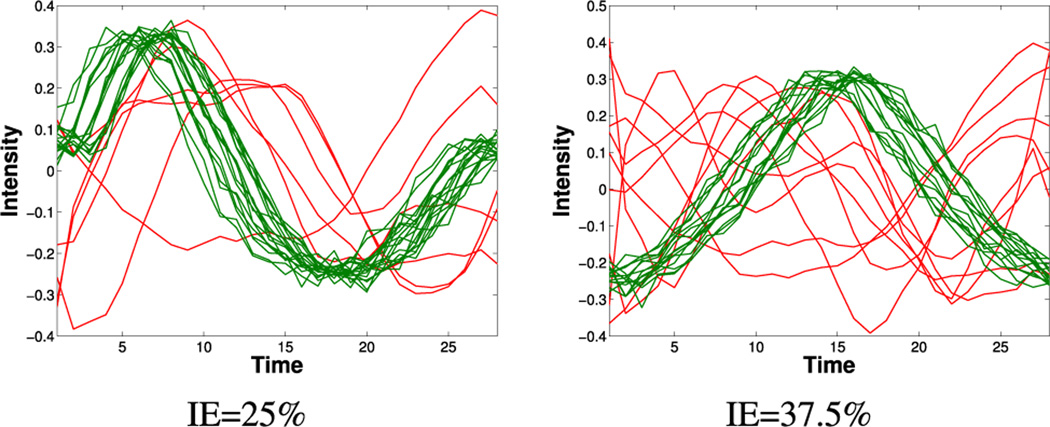
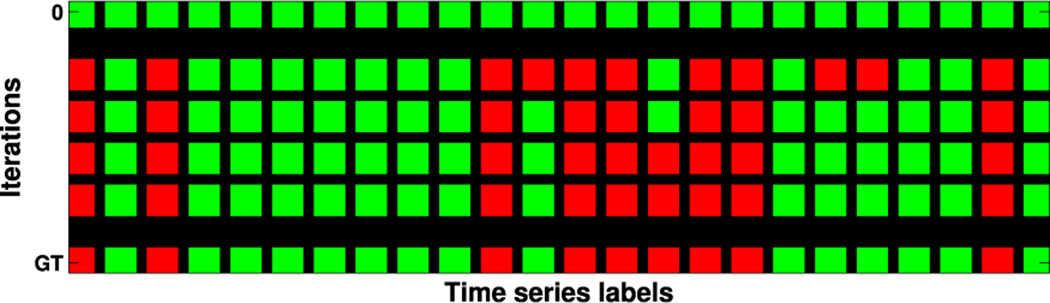
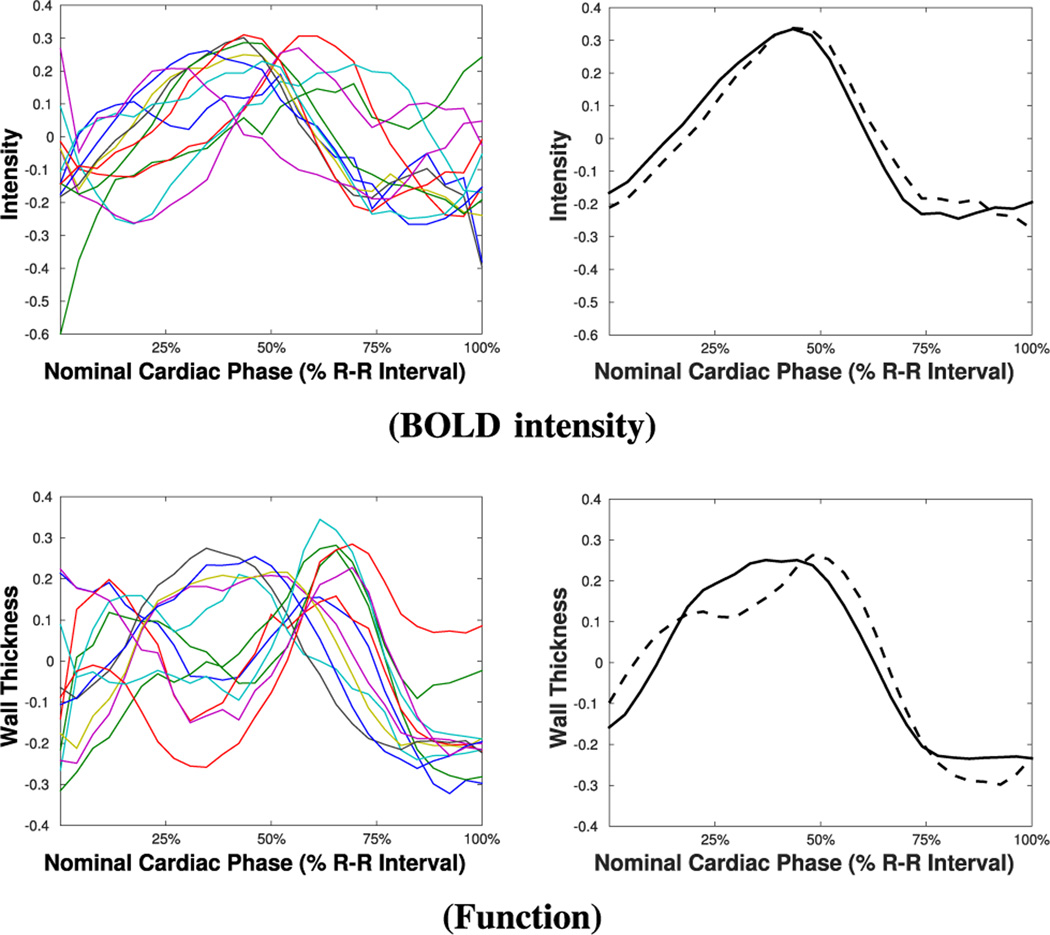
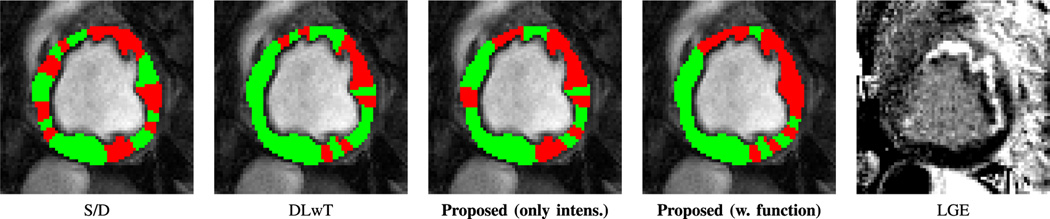
Cardiac Phase-resolved Blood-Oxygen-Level Dependent (CP-BOLD) MRI provides a unique opportunity to image an ongoing ischemia at rest. However, it requires post-processing to evaluate the extent of ischemia. To address this, here we propose an unsupervised ischemia detection (UID) method which relies on the inherent spatio-temporal correlation between oxygenation and wall motion to formalize a joint learning and detection problem based on dictionary decomposition. Considering input data of a single subject, it treats ischemia as an anomaly and iteratively learns dictionaries to represent only normal observations (corresponding to myocardial territories remote to ischemia). Anomaly detection is based on a modified version of One-class Support Vector Machines (OCSVM) to regulate directly the margins by incorporating the dictionary-based representation errors. A measure of ischemic extent (IE) is estimated, reflecting the relative portion of the myocardium affected by ischemia. For visualization purposes an ischemia likelihood map is created by estimating posterior probabilities from the OCSVM outputs, thus obtaining how likely the classification is correct. UID is evaluated on synthetic data and in a 2D CP-BOLD data set from a canine experimental model emulating acute coronary syndromes. Comparing early ischemic territories identified with UID against infarct territories (after several hours of ischemia), we find that IE, as measured by UID, is highly correlated (Pearson's r=0.84) with respect to infarct size. When advances in automated registration and segmentation of CP-BOLD images and full coverage 3D acquisitions become available, we hope that this method can enable pixel-level assessment of ischemia with this truly non-invasive imaging technique.
Figures
References
-
- Dharmakumar R, Arumana J, Tang R, Harris K, Zhang Z, Li D. Assessment of regional myocardial oxygenation changes in the presence of coronary artery stenosis with balanced SSFP imaging at 3.0T: Theory and experimental evaluation in canines. J. Magn. Reson. Imaging. 2008;27(5):1037–1045. - PubMed
-
- U. S. Food and Drug Administration. FDA warns of rare but serious risk of heart attack and death with cardiac nuclear stress test drugs Lexiscan (regadenoson) and Adenoscan (adenosine) Drug Safety Communications. 2013 [Online]. Available: http://www.fda.gov/Drugs/DrugSafety/ucm375654.htm.
-
- Aletras AH, Tilak GS, Natanzon A, Hsu L-Y, Gonzalez FM, Hoyt RF, Arai AE. Retrospective Determination of the Area at Risk for Reperfused Acute Myocardial Infarction With T2-Weighted Cardiac Magnetic Resonance Imaging. Circulation. 2006;113(15):1865–1870. - PubMed
MeSH terms
Substances
Grants and funding
LinkOut - more resources
Full Text Sources
Other Literature Sources
Medical
Miscellaneous
