. 2015 Sep 15;142(18):3151-65.
doi: 10.1242/dev.123547. Epub 2015 Aug 20.

Defining the three cell lineages of the human blastocyst by single-cell RNA-seq

Affiliations

Defining the three cell lineages of the human blastocyst by single-cell RNA-seq

Paul Blakeley et al. Development. .

Erratum in

Abstract

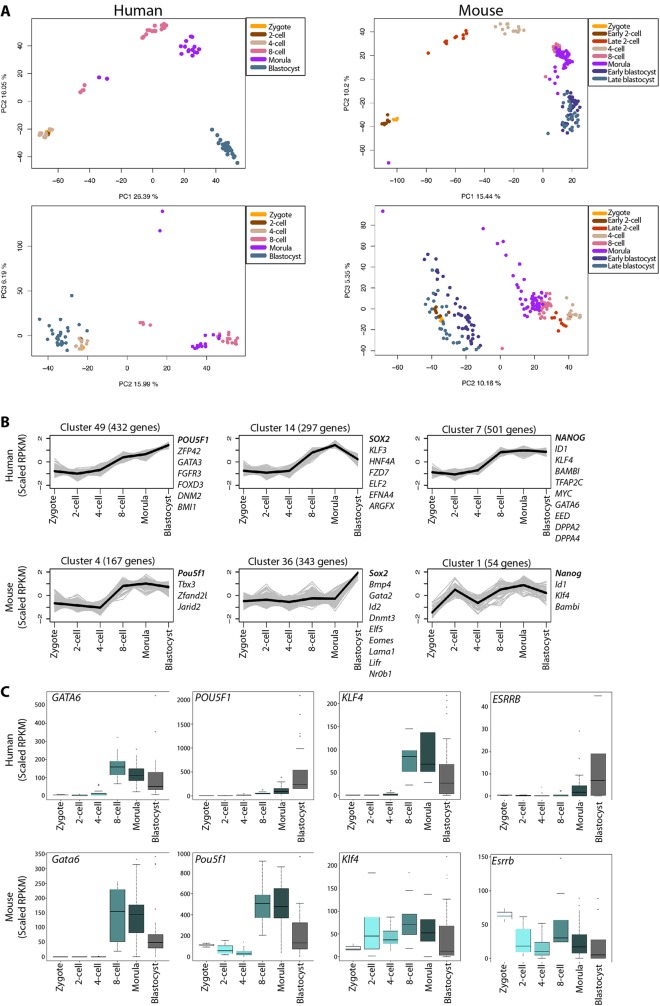
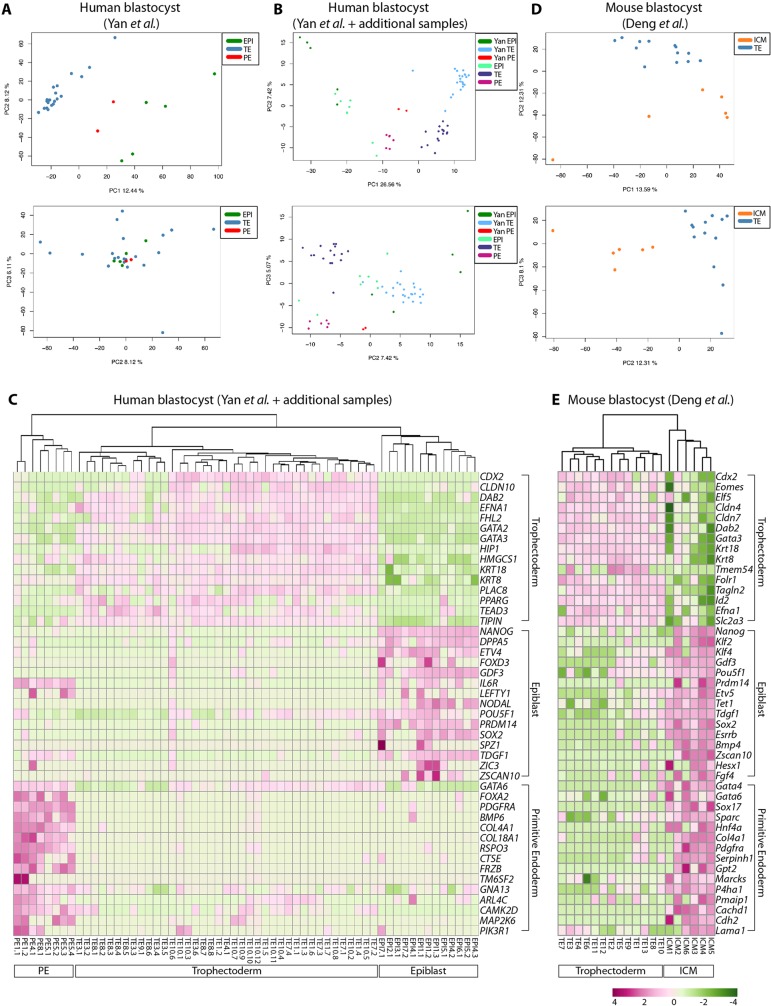
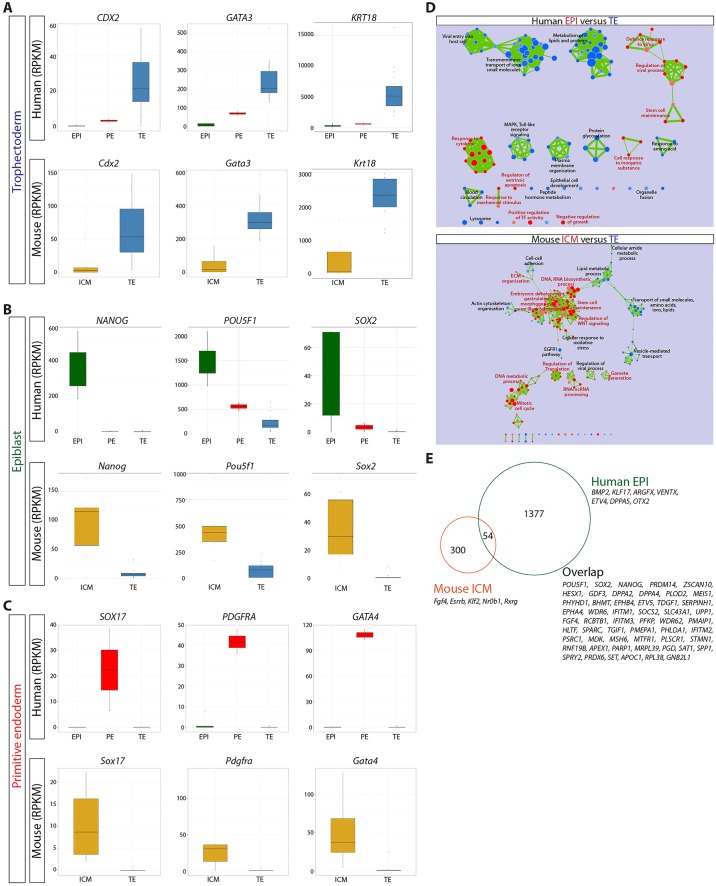
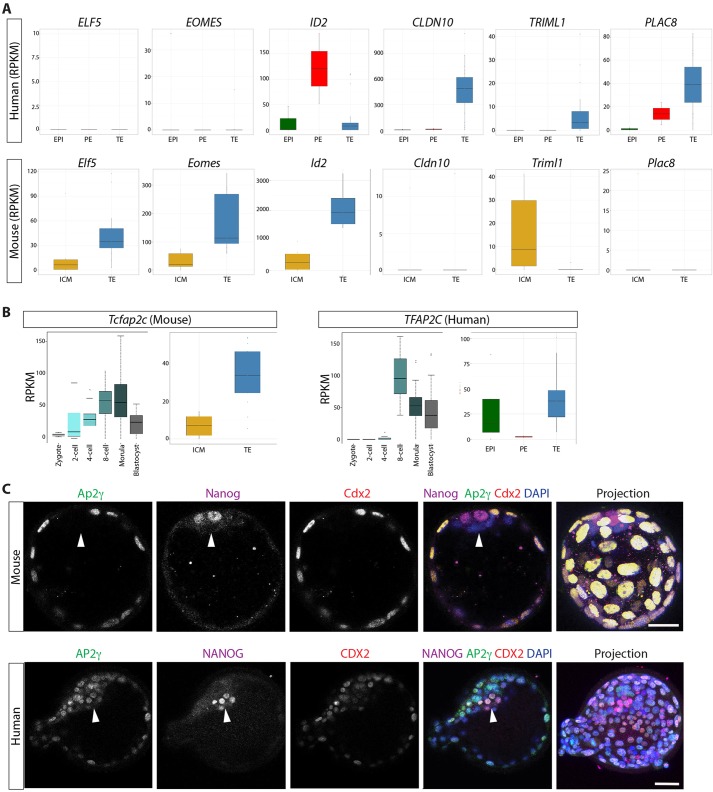
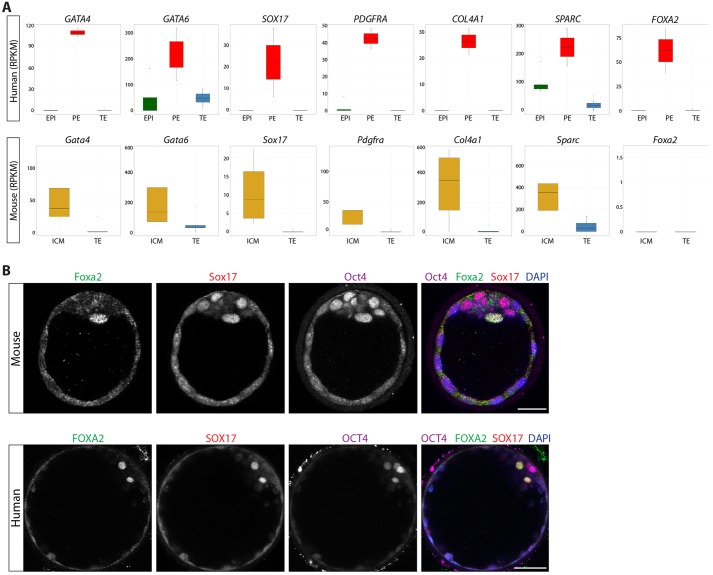
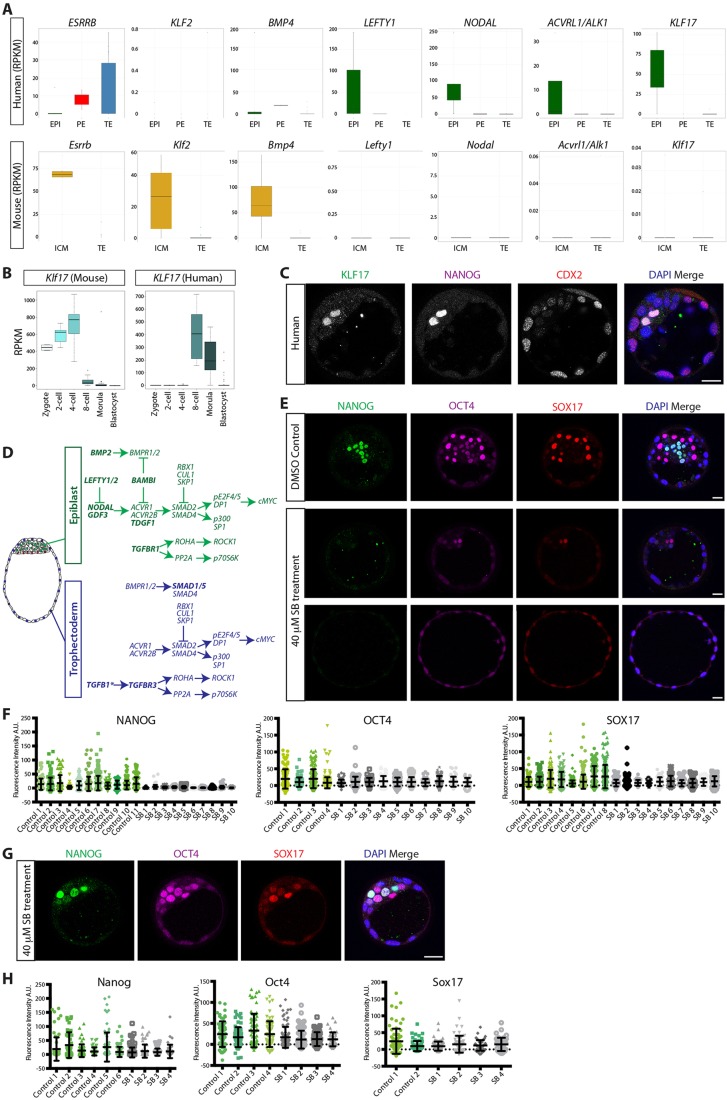
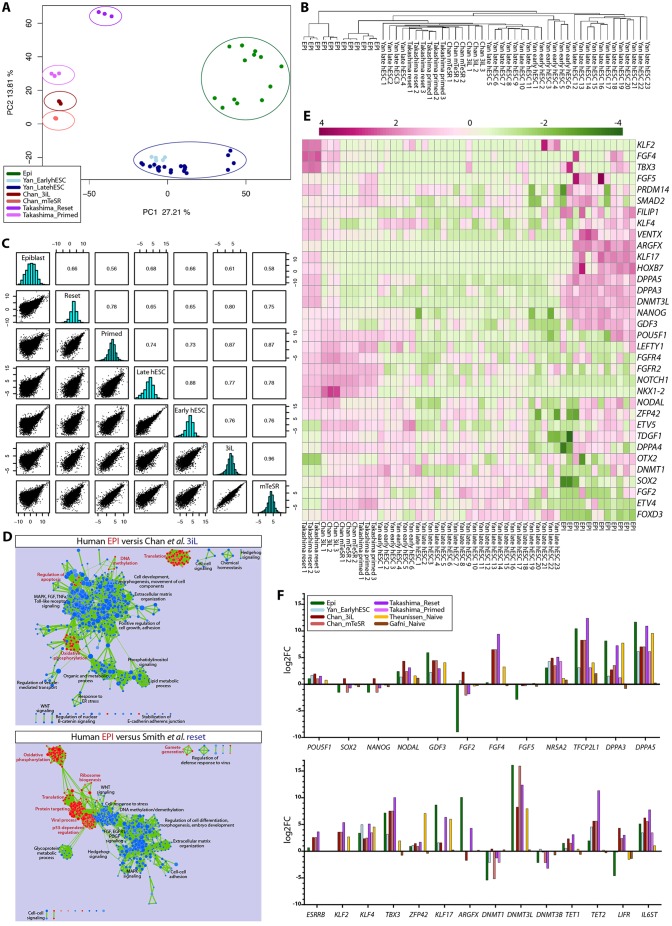
Here, we provide fundamental insights into early human development by single-cell RNA-sequencing of human and mouse preimplantation embryos. We elucidate conserved transcriptional programs along with those that are human specific. Importantly, we validate our RNA-sequencing findings at the protein level, which further reveals differences in human and mouse embryo gene expression. For example, we identify several genes exclusively expressed in the human pluripotent epiblast, including the transcription factor KLF17. Key components of the TGF-β signalling pathway, including NODAL, GDF3, TGFBR1/ALK5, LEFTY1, SMAD2, SMAD4 and TDGF1, are also enriched in the human epiblast. Intriguingly, inhibition of TGF-β signalling abrogates NANOG expression in human epiblast cells, consistent with a requirement for this pathway in pluripotency. Although the key trophectoderm factors Id2, Elf5 and Eomes are exclusively localized to this lineage in the mouse, the human orthologues are either absent or expressed in alternative lineages. Importantly, we also identify genes with conserved expression dynamics, including Foxa2/FOXA2, which we show is restricted to the primitive endoderm in both human and mouse embryos. Comparison of the human epiblast to existing embryonic stem cells (hESCs) reveals conservation of pluripotency but also additional pathways more enriched in hESCs. Our analysis highlights significant differences in human preimplantation development compared with mouse and provides a molecular blueprint to understand human embryogenesis and its relationship to stem cells.

Keywords: Embryonic stem cells; Epiblast; Human; Mouse; RNA-sequencing; Trophectoderm.


Figures

Fig. 1.
Fig. 1.
Global gene expression dynamics in human and mouse preimplantation development. (A) Principal component analysis of human (Yan et al., 2013) or mouse (Deng et al., 2014) single-cell RNA-seq transcriptomes. Each point represents a single cell and labelled according to developmental stage. Data were plotted along the first and second principal components and the second and third principal components. (B) K-means clusters showing selected genes co-expressed with Pou5f1/POU5F1, Sox2/SOX2 or Nanog/NANOG in mouse or human pre-implantation embryos. Grey line corresponds to scaled RPKM values for genes and black line corresponds to median expression within the cluster. (C) Boxplots of RPKM values for selected genes showing the range of single-cell gene expression at each of the selected development stages. Boxes correspond to the first and third quartiles, horizontal line to the median, whiskers extend to 1.5 times the interquartile range and dots denote outliers.
Fig. 2.
Fig. 2.
Lineage-specific gene expression in human and mouse blastocysts. (A,B,D) PCA at the late-blastocyst stage. Each point represents the gene expression profile of a single cell from blastocysts and labelled according to both lineage identity and experiment. Data were plotted along the first and second principal components and the second and third principal components. Data are from (A) Yan et al. (2013); (B) a combined dataset including our additional dataset together with data from Yan et al. (2013); (D) Deng et al. (2014). (C,E) Unsupervised hierarchical clustering of samples and heatmaps of differentially expressed genes. Normalized expression was plotted on a high-to-low scale (purple-white-green) and genes grouped according to lineage-associated expression. (C) A combined human late-blastocyst dataset including samples generated in our lab together with data from Yan et al. (2013). (E) Mouse late-blastocyst dataset from Deng et al. (2014).
Fig. 3.
Fig. 3.
Genes showing similar lineage-associated expression in human and mouse blastocysts. (A) NOISeq was used to calculate the probability of differential expression between (A) human TE versus EPI, or mouse TE versus ICM. The log2-fold change (FC) difference in expression is noted. (A) Cytoscape enrichment map of GSEA results comparing human TE (blue) versus EPI (red), and mouse TE (blue) versus ICM (red) (P-value <0.01). (B-D) Boxplots of RPKM values for selected genes in human (Yan et al., 2013) or mouse (Deng et al., 2014) (B) TE; (C) EPI or (D) PE. The range of expression in human EPI (green), PE (red) or TE (blue) and in mouse ICM (orange) or TE (blue). Boxes correspond to the first and third quartiles, horizontal line to the median, whiskers extend to 1.5 times the interquartile range and dots were outliers. (E) Venn diagram of overlapping orthologous gene expression in human EPI and mouse ICM.
Fig. 4.
Fig. 4.
Differences in TE-associated gene expression in human versus mouse blastocysts. (A) Boxplots of RPKM values for selected genes. The range of expression in human EPI (green), PE (red) or TE (blue) and in mouse ICM (orange) or TE (blue). Boxes correspond to the first and third quartiles, horizontal line to the median, whiskers extend to 1.5 times the interquartile range and dots were outliers. (B) Boxplots of RPKM values for Tcfap2c/TFAP2C in human or mouse late-blastocysts and at each of the selected development stages. (C) Immunofluorescence analysis of human or mouse blastocysts for Ap2γ/AP2γ (green), Nanog/NANOG (purple), Cdx2/CDX2 (red) or DAPI (blue) with merged and projection images. Arrowheads indicate the location of the inner cell mass. Scale bars: 25 µm.
Fig. 5.
Fig. 5.
Similarities in the expression of PE-associated genes in human and mouse blastocysts. (A) Boxplots of RPKM values for selected genes. The range of expression in human EPI (green), PE (red) or TE (blue) and in mouse ICM (orange) or TE (blue). Boxes correspond to the first and third quartiles, horizontal line to the median, whiskers extend to 1.5 times the interquartile range and dots were outliers. (B) Immunofluorescence analysis of human or mouse blastocysts for Foxa2/FOXA2 (green), Sox17/SOX17 (red), Oct4/OCT4 (purple) or DAPI (blue) with merged images. Scale bars: 25 µm.
Fig. 6.
Fig. 6.
Differences in the expression of EPI-associated genes in human versus mouse blastocysts. (A) Boxplots of RPKM values for selected genes. The range of expression in human EPI (green), PE (red) or TE (blue) and in mouse ICM (orange) or TE (blue). Boxes correspond to the first and third quartiles, horizontal line to the median, whiskers extend to 1.5 times the interquartile range and dots were outliers. (B) Boxplots of RPKM values for Klf17/KLF17 in human or mouse at each of the selected development stages. (C) Immunofluorescence analysis of human blastocysts for KLF17 (green), NANOG (purple), CDX2 (red) or DAPI (blue) with merged image. Scale bars: 25 µm. (D) Summary of TGF-β signalling components expressed at an RPKM value >5 in human EPI or TE. Bold denotes differentially expressed genes. *Indicates genes the expression of which falls just below the RPKM threshold. (E) Immunofluorescence analysis of SB-431542-treated or DMSO control human embryos for NANOG (green), OCT4 (purple), SOX17 (red) or DAPI (blue) with merged images. Scale bars: 25 µm. (F) Fluorescence intensity of NANOG, OCT4 or SOX17 in individual cells in each control or SB-431542 (SB)-treated embryo. (G) Immunofluorescence analysis of SB-431542-treated mouse embryos for Nanog (green), Oct4 (purple), Sox17 (red) or DAPI (blue) with merged image. Scale bar: 25 µm. (H) Fluorescence intensity of Nanog, Oct4 or Sox17 in individual cells in each control or SB-431542 (SB)-treated embryo.
Fig. 7.
Fig. 7.
Defining human ground state pluripotency. (A) PCA of human EPI and hESCs grown in distinct culture conditions. Each point represents the gene expression profile of a single cell from the human EPI, single cell from Yan et al. late or early hESCs, clumps of hESCs from either Chan et al. (3iL or mTeSR) or Takashima et al. (reset or primed). (B) Unsupervised hierarchical clustering of global gene expression of human EPI or hESCs. (C) Pearson correlation coefficient between each pair of conditions indicated. (D) Cytoscape enrichment map of GSEA results comparing human EPI (red) versus 3iL or reset hESCs (blue) (P-value <0.01). (E) Heatmaps of selected differentially expressed genes in human EPI and hESCs. Expression levels were plotted on a high-to-low scale (purple-white-green). (F) The log2 fold change for selected genes in each condition relative to the expression of hESCs maintained on MEFs.

References

    1. Aanes H., Winata C. L., Lin C. H., Chen J. P., Srinivasan K. G., Lee S. G. P., Lim A. Y. M., Hajan H. S., Collas P., Bourque G. et al. (2011). Zebrafish mRNA sequencing deciphers novelties in transcriptome dynamics during maternal to zygotic transition. Genome Res. 21, 1328-1338. 10.1101/gr.116012.110 - DOI - PMC - PubMed
    1. Albano R. M., Groome N. and Smith J. C. (1993). Activins are expressed in preimplantation mouse embryos and in ES and EC cells and are regulated on their differentiation. Development 117, 711-723. - PubMed
    1. Anders S. and Huber W. (2010). Differential expression analysis for sequence count data. Genome Biol. 11, R106 10.1186/gb-2010-11-10-r106 - DOI - PMC - PubMed
    1. Ang S.-L. and Rossant J. (1994). HNF-3 beta is essential for node and notochord formation in mouse development. Cell 78, 561-574. 10.1016/0092-8674(94)90522-3 - DOI - PubMed
    1. Ang S. L., Wierda A., Wong D., Stevens K. A., Cascio S., Rossant J. and Zaret K. S. (1993). The formation and maintenance of the definitive endoderm lineage in the mouse: involvement of HNF3/forkhead proteins. Development 119, 1301-1315. - PubMed

Publication types

MeSH terms