. 2015 Oct 1;142(19):3429-39.
doi: 10.1242/dev.121384. Epub 2015 Aug 20.

Control of vertebrate core planar cell polarity protein localization and dynamics by Prickle 2

Affiliations

Control of vertebrate core planar cell polarity protein localization and dynamics by Prickle 2

Mitchell T Butler et al. Development. .

Abstract

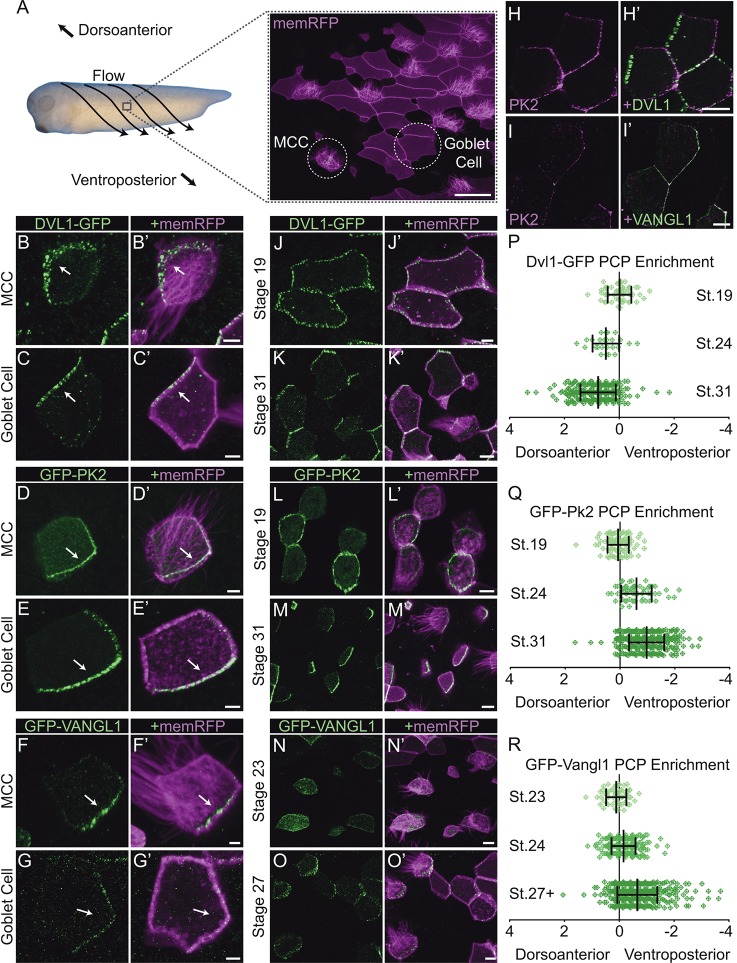
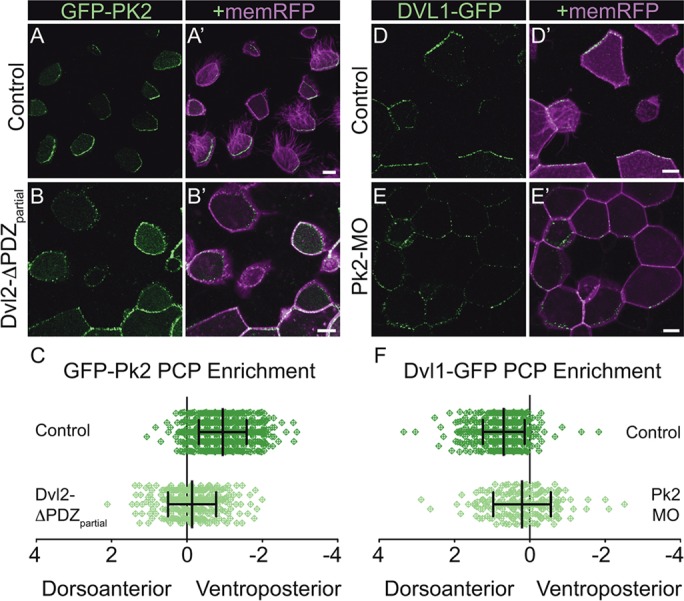
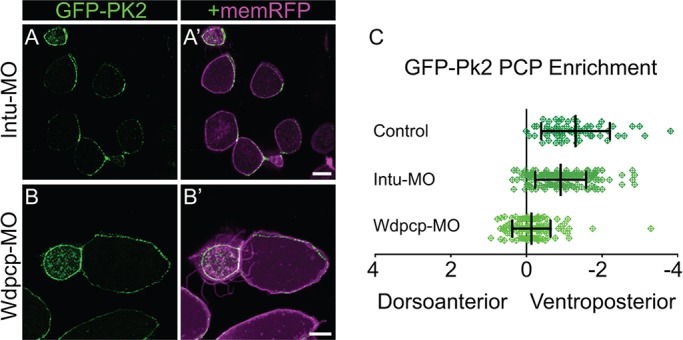
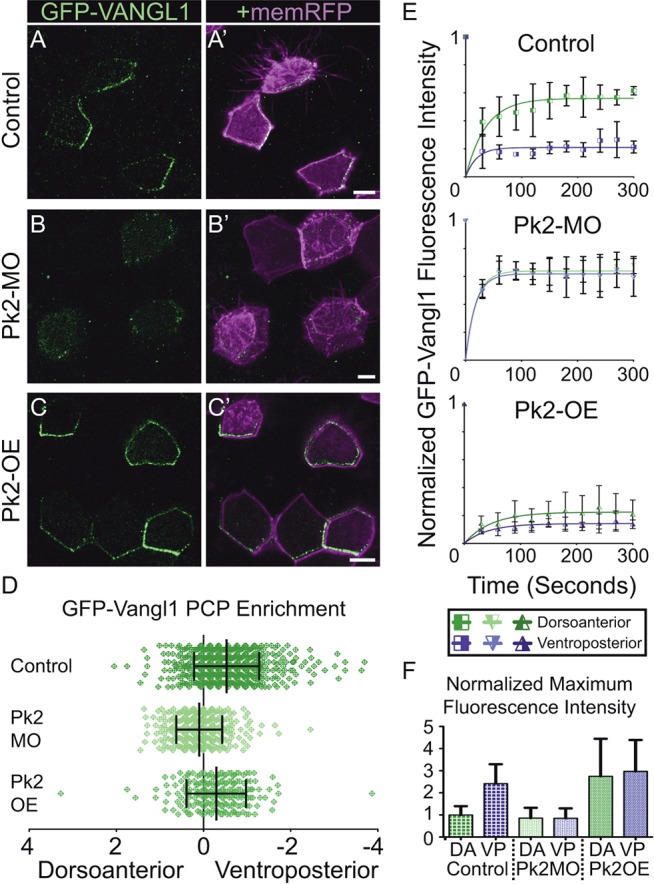
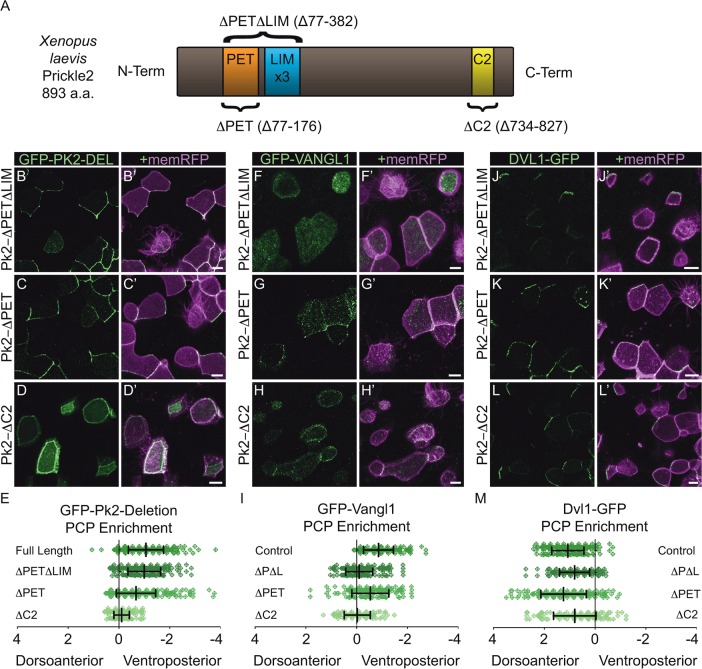
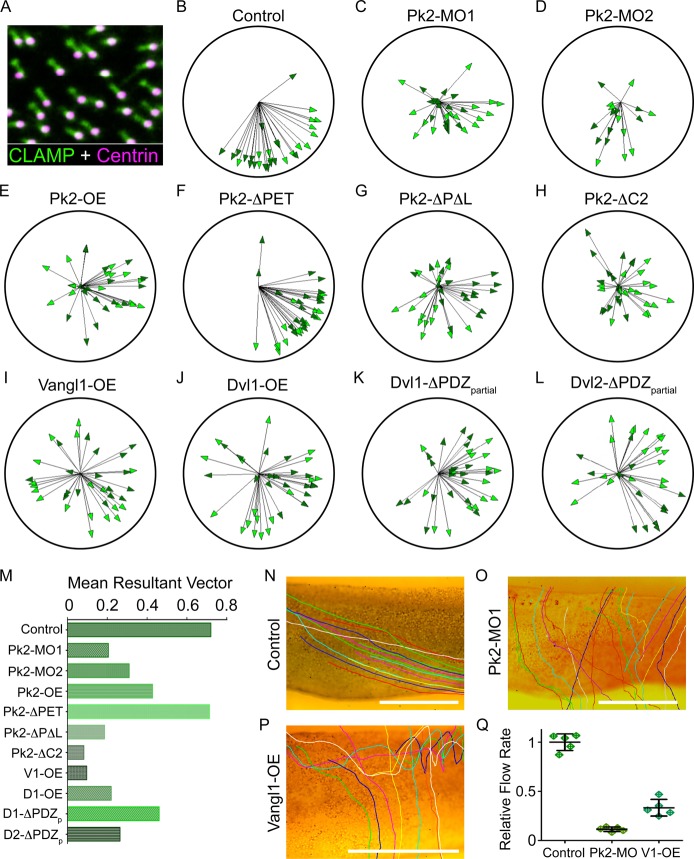
Planar cell polarity (PCP) is a ubiquitous property of animal tissues and is essential for morphogenesis and homeostasis. In most cases, this fundamental property is governed by a deeply conserved set of 'core PCP' proteins, which includes the transmembrane proteins Van Gogh-like (Vangl) and Frizzled (Fzd), as well as the cytoplasmic effectors Prickle (Pk) and Dishevelled (Dvl). Asymmetric localization of these proteins is thought to be central to their function, and understanding the dynamics of these proteins is an important challenge in developmental biology. Among the processes that are organized by the core PCP proteins is the directional beating of cilia, such as those in the vertebrate node, airway and brain. Here, we exploit the live imaging capabilities of Xenopus to chart the progressive asymmetric localization of fluorescent reporters of Dvl1, Pk2 and Vangl1 in a planar polarized ciliated epithelium. Using this system, we also characterize the influence of Pk2 on the asymmetric dynamics of Vangl1 at the cell cortex, and we define regions of Pk2 that control its own localization and those impacting Vangl1. Finally, our data reveal a striking uncoupling of Vangl1 and Dvl1 asymmetry. This study advances our understanding of conserved PCP protein functions and also establishes a rapid, tractable platform to facilitate future in vivo studies of vertebrate PCP protein dynamics.

Keywords: Cilia; Core PCP; Dishevelled; Dvl1; Multiciliated cell; Pk2; Planar cell polarity; Prickle; Van Gogh-like; Vangl1; Xenopus.


Figures

Fig. 1.
Fig. 1.
Core PCP proteins pattern the Xenopus epidermis during the refinement of basal body orientation. (A) Xenopus laevis embryo with flow and anatomical directionality indicated along with a confocal slice showing the different cell types visualized via memRFP in a mosaically labeled epidermis. MCC, multiciliated cell. (B-G′) MCCs (B,D,F) and goblet cells (C,E,G) in a St.31 embryo surrounded by unlabeled neighbors display asymmetric core PCP protein localization in the direction indicated by the arrows. (H-I′) Groups of cells labeled with RFP-Pk2 and either mutually exclusive Dvl1-GFP (H) or colocalizing GFP-Vangl1 (I). (J-M′) Patches of cells mosaically labeled with either Dvl1-GFP (J,K) or GFP-Pk2 (L,M) at stages prior to ciliogenesis (St.19) and after basal body refinements (St.31). (N-O′) Patches of cells mosaically labeled with GFP-Vangl1 at stages during ciliogenesis (St.23) and during basal body refinement (St.27). (P-R) Quantifications of PCP enrichment at different developmental stages show that increasing asymmetry develops during basal body refinement stages. Each mark represents the enrichment value for a single cell. All comparisons within graphs are highly significant (P<0.0001) except for a modest increase between Dvl1 St.24 and St.31 (P=0.0366). In P: St.19, n=58 cells; St.24, n=25 cells; St.31, n=321 cells. In Q: St.19, n=106 cells; St.24, n=61 cells; St.31, n=344 cells. In R: St.23, n=61 cells; St.24, n=268 cells; St.27+, n=465 cells. Error bars indicate s.e.m. Scale bars: 50 μm in A; 5 μm in B-G′; 10 μm in H-O′.
Fig. 2.
Fig. 2.
Intact PCP signaling is required for the formation of asymmetric core PCP complexes. (A-B′) Mosaically labeled epidermal cells in St.31 X. laevis embryos have GFP-Pk2 localized asymmetrically in the control situation (A) and symmetrically upon overexpression of Dvl2-ΔPDZpartial (B). (C) Quantification of PCP enrichment shows a significant shift upon Dvl2-ΔPDZpartial expression (P<0.0001; Control, n=584 cells; Dvl2-ΔPDZpartial, n=326 cells). (D-E′) Mosaically labeled epidermal cells in St.31 X. laevis embryos have GFP-Pk2 localized asymmetrically in the control situation (D) and symmetrically upon Pk2-MO knockdown (E). (F) Quantification of PCP enrichment shows a significant shift upon Pk2-MO knockdown (P<0.0001; Control, n=508 cells; Pk2-MO, n=210 cells). Error bars indicate s.e.m. Scale bars: 10 μm.
Fig. 3.
Fig. 3.
Wdpcp knockdown disrupts core PCP patterning. (A,B) Mosaically labeled epidermal cells in St.31 X. laevis embryos have GFP-Pk2 localized asymmetrically upon Intu-MO knockdown (A) and symmetrically upon Wdpcp-MO knockdown (B). (C) Quantification of PCP enrichment shows a significant shift upon Intu-MO knockdown (P=0.0031, n=187 cells) and a more significant shift upon Wdpcp-MO knockdown (P<0.0001, n=137 cells) in comparison to controls (n=64 cells). Error bars indicate s.e.m. Scale bars: 10 μm.
Fig. 4.
Fig. 4.
Pk2 expression levels influence the dynamic localization of apicolateral Vangl1 accumulations. (A-C′) Mosaically labeled epidermal cells in St.31 X. laevis embryos have GFP-Vangl1 localized asymmetrically in the control situation (A), whereas it is absent from apicolateral enrichments upon Pk2-MO knockdown (B) and localized more symmetrically with Pk2 overexpression (C). (D) Quantification of PCP enrichment shows a significant shift upon Pk2-MO knockdown (P<0.0001, n=355 cells) and Pk2 overexpression (P=0.0002, n=217 cells) in comparison to controls (n=519 cells). (E) FRAP recovery trends of GFP-Vangl1 fluorescence intensity following simultaneous bleaching at discrete dorsoanterior (green lines) and ventroposterior (purple lines) cortical regions in St.25 embryos. Error bars represent s.e.m. from three separately bleached cells in two or three different embryos. (F) Comparison of the maximum fluorescence intensities at regions measured in E prior to bleaching, which are normalized to dorsoanterior intensity in the control situation. DA, dorsoanterior; VP, ventroposterior. Error bars in D and F indicate s.e.m. Scale bars: 10 μm.
Fig. 5.
Fig. 5.
The Pk2 C2 domain is required for Pk2 asymmetry, while both the LIM and C2 domains promote the asymmetric enrichment of Vangl1. (A) Schematic of X. laevis Pk2 showing the location of conserved domains removed from Pk2 deletion constructs. (B-D′) Cellular localizations of GFP-Pk2 with sequence deletions that correspond to the PET and LIM domains (B), PET domain alone (C), and C-terminal region C2 (D). (E) Graph depicting changes in the localization of Pk2 caused by conserved domain deletions, with the normal localization of GFP-Pk2-ΔPETΔLIM (P=0.4037, n=312 cells), still asymmetric yet significantly misaligned GFP-Pk2-ΔPET (P<0.0001, n=379 cells), and symmetric GFP-Pk2-ΔC2 (P<0.0001, n=302 cells), compared to full-length (n=374 cells). (F-H′) Cellular localizations of GFP-Vangl1 upon overexpression of Pk2-ΔPETΔLIM (F), Pk2-ΔPET (G) and Pk2-ΔC2 (H). (I) Graph depicting changes in localization of Vangl1 caused by overexpression of Pk2 deletions, with a loss of asymmetry upon Pk2-ΔPETΔLIM and Pk2-ΔC2 overexpression (P<0.0001, ΔPETΔLIM, n=310 cells; ΔC2, n=125 cells) and significant reduction upon Pk2-ΔPET overexpression (P=0.0001, n=203 cells), compared to full-length (n=215 cells). (J-L′) Cellular localizations of Dvl1-GFP upon overexpression of Pk2-ΔPETΔLIM (J), Pk2-ΔPET (K) and Pk2-ΔC2 (L). (M) Graph depicting changes in localization of Dvl1 caused by overexpression of Pk2 deletions, with a significant shift in, but not loss of, asymmetric enrichment upon Pk2-ΔPETΔLIM (P<0.0001, n=206 cells), Pk2-ΔPET (P=0.0181, n=212 cells) and Pk2-ΔC2 (P=0.0002, n=163 cells) overexpression, compared to full-length (n=243 cells). Error bars indicate s.e.m. Scale bars: 10 μm.
Fig. 6.
Fig. 6.
Disrupting PCP patterning leads to structural defects in basal body polarity. (A) Apical intercellular region of a single MCC labeled with CLAMP-GFP and Centrin-RFP, which when combined display the orientation of cilia with respect to the direction of ciliary beating (CLAMP points in the opposite direction). (B-L) Plots displaying the mean basal body orientation and associated mean vector length of MCCs under various experimental conditions. Each arrow represents a measure of the orientations of a single MCC, with increased length correlated with less variation between basal bodies within each MCC. Dark and light arrowheads represent data from separate experimental repeats, with each experiment involving measures from at least five cells from at least three embryos each. The combined data are displayed for control (B, n=2113 orientations, 31 cells), Pk2-MO#1 knockdown (C, n=1556 orientations, 32 cells), Pk2-MO#2 knockdown (D, n=1057 orientations, 18 cells), Pk2 overexpression (E, n=2426 orientations, 34 cells), Pk2-ΔPET overexpression (F, n=3122 orientations, 35 cells), Pk2-ΔPETΔLIM overexpression (G, n=1941 orientations, 34 cells), Pk2-ΔC2 overexpression (H, n=2275 orientations, 33 cells), Vangl1 overexpression (I, n=2843 orientations, 35 cells), Dvl1 overexpression (J, n=2086 orientations, 37 cells), Dvl1-ΔPDZpartial overexpression (K, n=2797 orientations, 36 cells) and Dvl2-ΔPDZpartial overexpression (L, n=2177 orientations, 32 cells) conditions. (M) The mean resultant vector length from the combined measurements for all MCCs across all embryos from both experimental treatments, serving as an overall metric for PCP disruption. (N-P) Stills from the end of movies showing the traces of beads carried by flow across the epidermis of St.31 X. laevis embryos that were uninjected (N) or were injected with either Pk2-MO (O) or a high dose of vangl1 mRNA (P). (Q) Quantification of the flow rate from five beads traced in the movies of which the final frame is shown in N-P. Error bars indicate s.e.m. Scale bars: 1 mm.

References

    1. Adler P. N. (1992). The genetic control of tissue polarity in Drosophila. Bioessays 14, 735-741. 10.1002/bies.950141103 - DOI - PubMed
    1. Adler P. N., Krasnow R. E. and Liu J. (1997). Tissue polarity points from cells that have higher Frizzled levels towards cells that have lower Frizzled levels. Curr. Biol. 7, 940-949. 10.1016/S0960-9822(06)00413-1 - DOI - PubMed
    1. Adler P. N., Taylor J. and Charlton J. (2000). The domineering non-autonomy of frizzled and van Gogh clones in the Drosophila wing is a consequence of a disruption in local signaling. Mech. Dev. 96, 197-207. 10.1016/S0925-4773(00)00392-0 - DOI - PubMed
    1. Aigouy B., Farhadifar R., Staple D. B., Sagner A., Röper J.-C., Jülicher F. and Eaton S. (2010). Cell flow reorients the axis of planar polarity in the wing epithelium of Drosophila. Cell 142, 773-786. 10.1016/j.cell.2010.07.042 - DOI - PubMed
    1. Amonlirdviman K., Khare N. A., Tree D. R. P., Chen W.-S., Axelrod J. D. and Tomlin C. J. (2005). Mathematical modeling of planar cell polarity to understand domineering nonautonomy. Science 307, 423-426. 10.1126/science.1105471 - DOI - PubMed

Publication types

MeSH terms

LinkOut - more resources