. 2015 Dec;26(12):2989-3000.
doi: 10.1681/ASN.2014100978. Epub 2015 Aug 20.

T Lymphocyte-Specific Activation of Nrf2 Protects from AKI

Affiliations

T Lymphocyte-Specific Activation of Nrf2 Protects from AKI

Sanjeev Noel et al. J Am Soc Nephrol. 2015 Dec.

Abstract

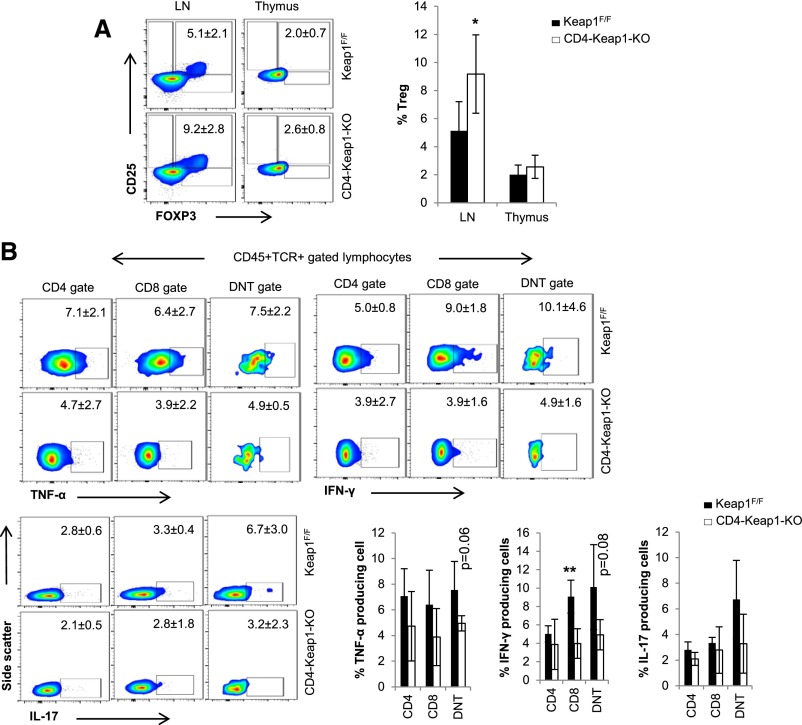
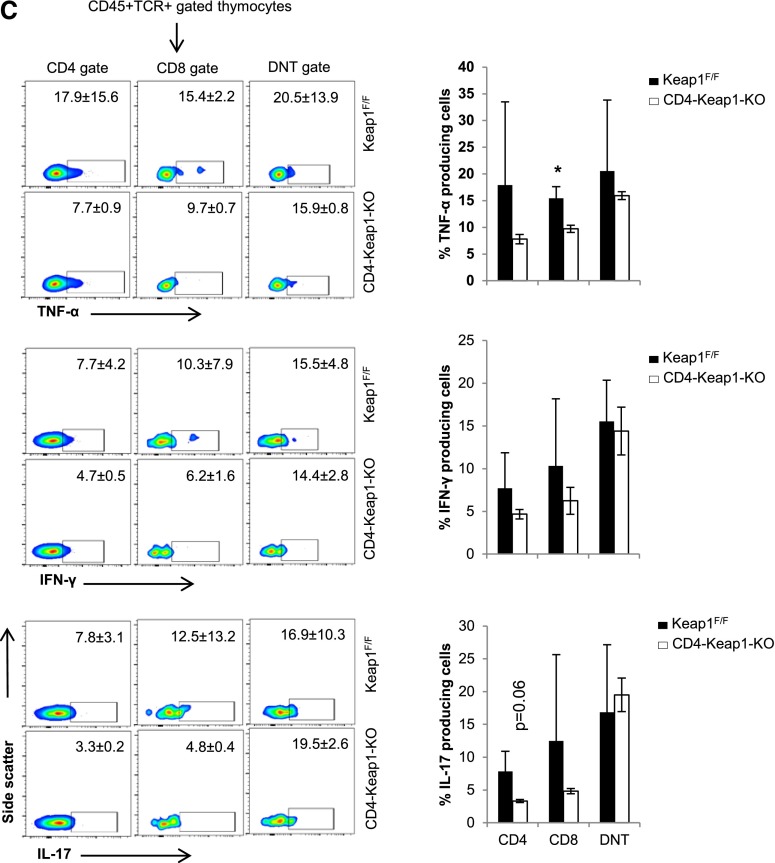
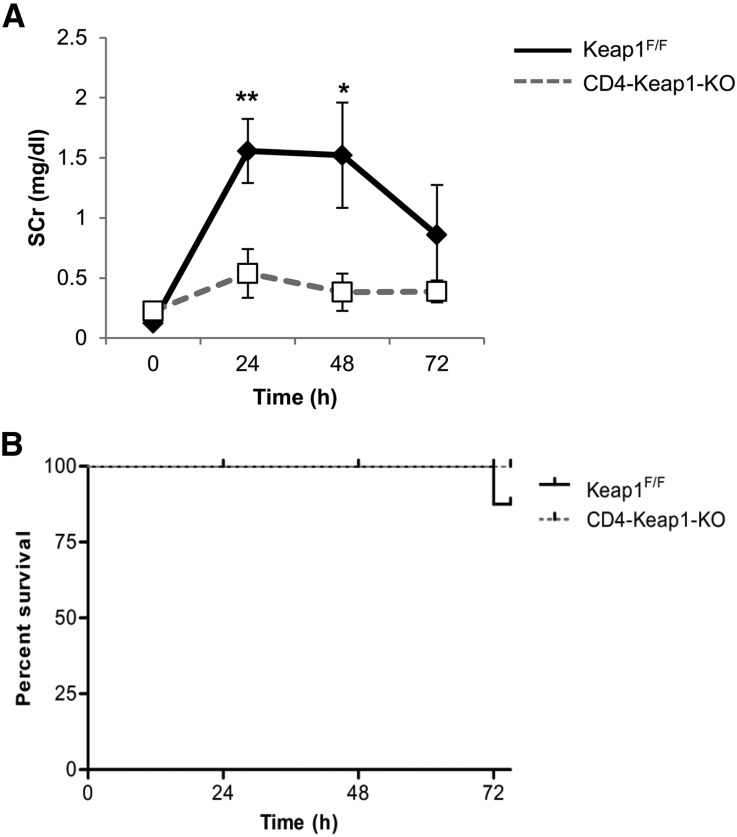
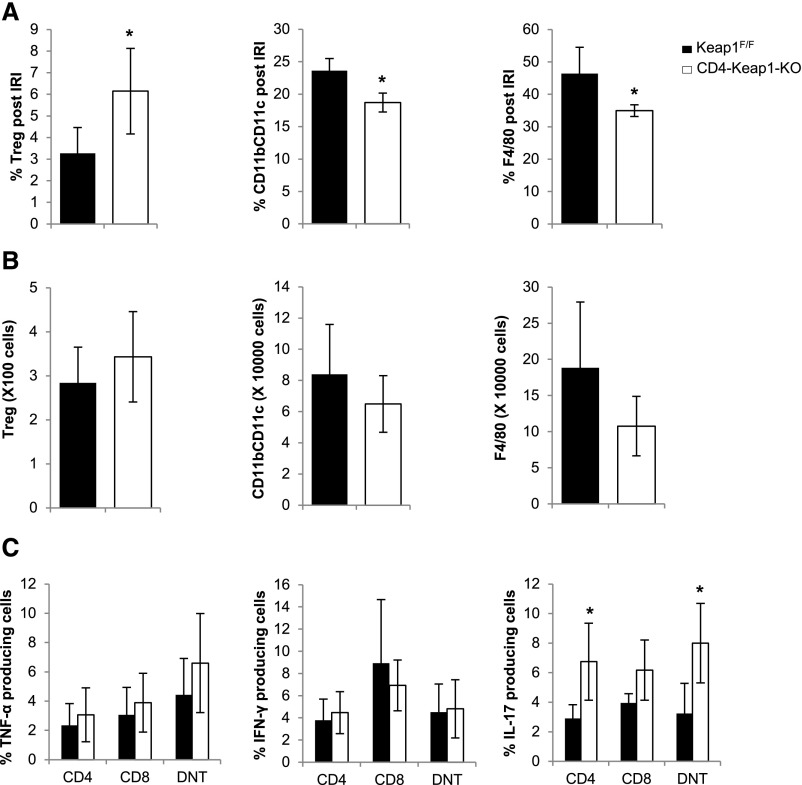
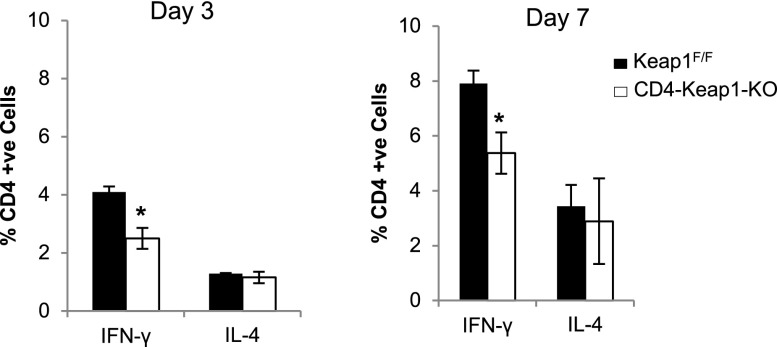
T lymphocytes are established mediators of ischemia reperfusion (IR)-induced AKI, but traditional immune principles do not explain their mechanism of early action in the absence of alloantigen. Nrf2 is a transcription factor that is crucial for cytoprotective gene expression and is generally thought to have a key role in dampening IR-induced AKI through protective effects on epithelial cells. We proposed an alternative hypothesis that augmentation of Nrf2 in T cells is essential to mitigate oxidative stress during IR-induced AKI. We therefore generated mice with genetically amplified levels of Nrf2 specifically in T cells and examined the effect on antioxidant gene expression, T cell activation, cytokine production, and IR-induced AKI. T cell-specific augmentation of Nrf2 significantly increased baseline antioxidant gene expression. These mice had a high frequency of intrarenal CD25(+)Foxp3(+) regulatory T cells and decreased frequencies of CD11b(+)CD11c(+) and F4/80(+) cells. Intracellular levels of TNF-α, IFN-γ, and IL-17 were significantly lower in CD4(+) T cells with high Nrf2 expression. Mice with increased T cell expression of Nrf2 were significantly protected from functional and histologic consequences of AKI. Furthermore, adoptive transfer of high-Nrf2 T cells protected wild-type mice from IR injury and significantly improved their survival. These data demonstrate that T cell-specific activation of Nrf2 protects from IR-induced AKI, revealing a novel mechanism of tissue protection during acute injury responses.

Keywords: AKI; Nrf2-Keap1; T cell; inflammation; oxidative stress.


Figures

Figure 1.
Figure 1.
Generation and characterization of CD4-Keap1-KO mice. (A) CD4-Cre mice are crossed with Keap1F/F mice to generate CD4-Keap1-KO mice. (B) Mice are genotyped to confirm the presence of the Cre and Keap1 floxed allele using CRE and floxed primers. Lanes in B represent the following: lane 1, 100-bp DNA ladder; lane 2, 324-bp internal positive control showing CD4-Cre–negative mice; lane 3, 324-bp internal positive control and 100-bp Cre showing CD4-Cre–positive mice; lane 4, 383-bp Keap1 floxed allele in Keap1F/F mice; and lane 5, 383-bp Keap1 floxed allele in CD4-Keap1-KO mice. (C) CD4-Cre–mediated deletion of exons 2 and 3 of Keap1 is further confirmed by using deletion-specific primers. Lanes in C represent the following: lane 1, 1-Kb DNA ladder; lane 2, 2954-bp WT Keap1 allele; and lane 3, 288-bp truncated Keap1 allele after deletion of exons 2 and 3. (D) Deletion of Keap1 significantly upregulates the expression of Nrf2 targets Nqo1 (P≤0.001), Ho-1 (P=0.05), and Gclc (P≤0.01) in T cells; however, there is no change in Nrf2 and Gclm mRNA levels. (E) Western blot analysis of Nrf2 and Nqo1 in nuclear and cytoplasmic fractions of T cells isolated from CD4-Keap1-KO (n=3) and Keap1F/F mice (n=3). (F) Quantification of Nrf2 and Nqo1 levels in nuclear and cytoplasmic fractions. Data represent the mean±SD. *P≤0.05; **P≤0.01; ***P≤0.001.
Figure 2.
Figure 2.
Baseline characteristics of T cells in CD4-Keap1-KO mice. (A–C) T cell–specific augmentation of Nrf2 results in higher percentages of CD25+Foxp3+ Tregs (A) and lower percentages of CD11b+CD11c+ and F4/80+ cells in CD4-Keap1-KO kidneys at baseline compared with Keap1F/F kidneys (B and C). (D) The percentage of CD69+ CD4, CD8, and DNT cells is lower in kidneys of CD4-Keap1-KO mice than in Keap1F/F mice. (E) Percentages of CD4, CD8, and DNT cells for baseline intracellular TNF-α, IFN-γ, and IL-17 are lower in kidneys of CD4-Keap1-KO mice compared with Keap1F/F mice. Representative flow images show selected populations and corresponding graphs show average percentages from four independent experiments. Data represent the mean±SD. *P≤0.05; **P≤0.01. KMNC, kidney mononuclear cell.
Figure 3.
Figure 3.
Frequency of Tregs and intracellular cytokines by lymphocytes isolated from inguinal LN and thymus at baseline. (A) The percentage of Tregs is significantly higher in the LN in CD4-Keap1-KO at baseline than in Keap1F/F mice. (B and C) Baseline intracellular TNF-α, IFN-γ, and IL-17 is lower in CD4, CD8, and DNT cells isolated from CD4-Keap1-KO LN (B) and thymus (C) than in Keap1F/F counterparts. Data represent the mean±SD. *P≤0.05; **P≤0.01.
Figure 3.
Figure 3.
Frequency of Tregs and intracellular cytokines by lymphocytes isolated from inguinal LN and thymus at baseline. (A) The percentage of Tregs is significantly higher in the LN in CD4-Keap1-KO at baseline than in Keap1F/F mice. (B and C) Baseline intracellular TNF-α, IFN-γ, and IL-17 is lower in CD4, CD8, and DNT cells isolated from CD4-Keap1-KO LN (B) and thymus (C) than in Keap1F/F counterparts. Data represent the mean±SD. *P≤0.05; **P≤0.01.
Figure 4.
Figure 4.
Effect of T cell–specific Keap1 deletion on IR-induced AKI. (A) Deletion of Keap1 from T cells in CD4-Keap1-KO mice (n=7) improves kidney function after bilateral IR injury compared with Keap1F/F mice (n=9). (B) There is no mortality in CD4-Keap1-KO mice; however, 20% of mice died in the control group 72 hours after IR injury. (C) Representative images of hematoxylin and eosin–stained kidney sections showing significantly fewer necrotic tubules and greater normal renal cortex and medullary tissue in CD4-Keap1-KO mice compared with Keap1F/F mice 24 and 72 hours after IR injury. (D) Dot plot showing the percent score for necrotic tubules and normal cortex and medulla for CD4-Keap1-KO (n=8–10) and Keap1F/F (n=9–11) mice 24 and 72 hours after IR injury. (E) Proinflammatory cytokine IFN-γ is lower in whole kidney lysates of CD4-Keap1-KO mice compared with Keap1F/F mice 72 hours after IR injury, whereas TNF-α, MCP-1, and IL-10 are not significantly different between the groups. Graphs represent the mean±SEM. *P≤0.05; **P≤0.01. MCP-1, monocyte chemoattractant protein-1. Original magnification, ×200 in C.
Figure 4.
Figure 4.
Effect of T cell–specific Keap1 deletion on IR-induced AKI. (A) Deletion of Keap1 from T cells in CD4-Keap1-KO mice (n=7) improves kidney function after bilateral IR injury compared with Keap1F/F mice (n=9). (B) There is no mortality in CD4-Keap1-KO mice; however, 20% of mice died in the control group 72 hours after IR injury. (C) Representative images of hematoxylin and eosin–stained kidney sections showing significantly fewer necrotic tubules and greater normal renal cortex and medullary tissue in CD4-Keap1-KO mice compared with Keap1F/F mice 24 and 72 hours after IR injury. (D) Dot plot showing the percent score for necrotic tubules and normal cortex and medulla for CD4-Keap1-KO (n=8–10) and Keap1F/F (n=9–11) mice 24 and 72 hours after IR injury. (E) Proinflammatory cytokine IFN-γ is lower in whole kidney lysates of CD4-Keap1-KO mice compared with Keap1F/F mice 72 hours after IR injury, whereas TNF-α, MCP-1, and IL-10 are not significantly different between the groups. Graphs represent the mean±SEM. *P≤0.05; **P≤0.01. MCP-1, monocyte chemoattractant protein-1. Original magnification, ×200 in C.
Figure 5.
Figure 5.
Post-IR changes in kidney-infiltrating immune cells and cytokine production in CD4-Keap1-KO and Keap1F/F mice. (A) There is a significantly higher percentage of Tregs (P=0.04) and a lower percentage of CD11b+CD11c+ (P=0.02) and F4/80+ (P=0.03) cells in kidneys of CD4-Keap1-KO mice 24 hours after the induction of AKI. (B) Absolute numbers of Tregs (343.30±102.5 versus 284.1±80.9) and CD11b+CD11c+ (6.4×10⁴±1.8×10³ versus 8.3×10⁴±3.2×10³) and F4/80+ (1×10⁵±4.1×10³ versus 1.8×10⁵±9.1×10³) cells are not different between CD4-Keap1-KO and Keap1F/F mice at 24 hours after IR injury. (C) Intracellular IL-17 levels are higher in CD4, CD8, and DNT cells isolated 24 hours after IR from kidneys of CD4-Keap1-KO mice, whereas there is no difference in TNF-α and IFN-γ production. IRI, ischemia reperfusion injury. Data represent the mean±SD. *P≤0.05.
Figure 6.
Figure 6.
In vitro activation of CD4+ T cells from spleens of CD4-Keap1-KO mice with anti-CD3/CD28 show attenuated IFN-γ production at day 3 (P=0.03) and day 7 (P=0.05) compared with Keap1F/F. There is no difference in IL-4–producing CD4+ T cell populations in either mouse. Data represent the mean±SD. *P≤0.05.
Figure 7.
Figure 7.
Effect of adoptive transfer of CD4-Keap1-KO T cells into WT (C57BL/6) mice (n=7–10). (A) The success of adoptive transfer is confirmed by establishing the presence of CFSE-labeled T cells in peripheral blood of WT recipients before inducing AKI. (B and C) Adoptive transfer of T cells from CD4-Keap1-KO mice significantly improves renal function (P=0.02) and improves survival (log-rank [Mantel–Cox] test, chi-squared P≤0.01) in WT mice after IR injury. Data represent the mean±SEM. *P≤0.05; **P≤0.01.

Comment in

Similar articles

Cited by

References

    1. Clarkson MR, Friedewald JJ, Eustace JA, Rabb H: Acute kidney injury. In: Brenner & Rector’s The Kidney, edited by Brenner BM, 8th Ed., Philadelphia, Saunders, Elsevier, 2008, pp 943–986
    1. Srisawat N, Kellum JA: Acute kidney injury: Definition, epidemiology, and outcome. Curr Opin Crit Care 17: 548–555, 2011 - PubMed
    1. Rewa O, Bagshaw SM: Acute kidney injury-epidemiology, outcomes and economics. Nat Rev Nephrol 10: 193–207, 2014 - PubMed
    1. Jang HR, Ko GJ, Wasowska BA, Rabb H: The interaction between ischemia-reperfusion and immune responses in the kidney. J Mol Med (Berl) 87: 859–864, 2009 - PubMed
    1. Kinsey GR, Okusa MD: Role of leukocytes in the pathogenesis of acute kidney injury. Crit Care 16: 214, 2012 - PMC - PubMed

Publication types

MeSH terms