. 2015:2015:789502.
doi: 10.1155/2015/789502. Epub 2015 Jul 29.

Dopaminergic Modulation of Striatal Inhibitory Transmission and Long-Term Plasticity

Affiliations

Dopaminergic Modulation of Striatal Inhibitory Transmission and Long-Term Plasticity

Elizabeth Nieto Mendoza et al. Neural Plast. 2015.

Erratum in

Abstract

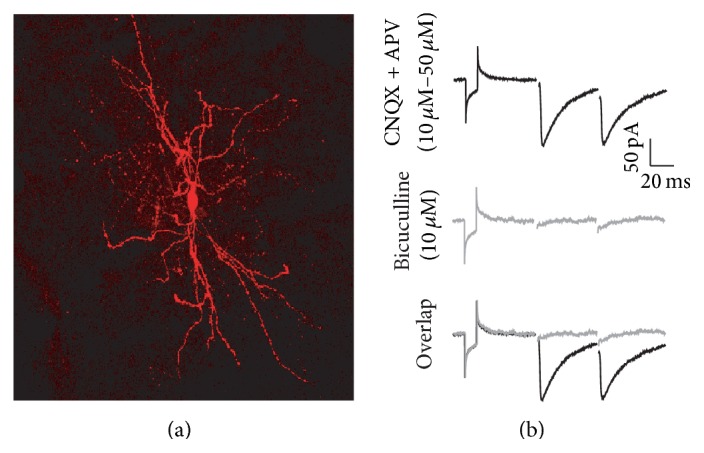
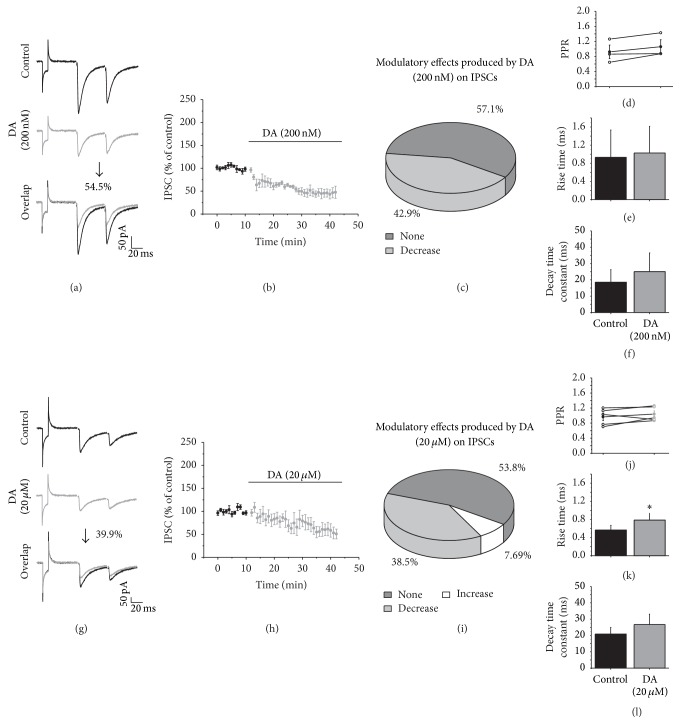
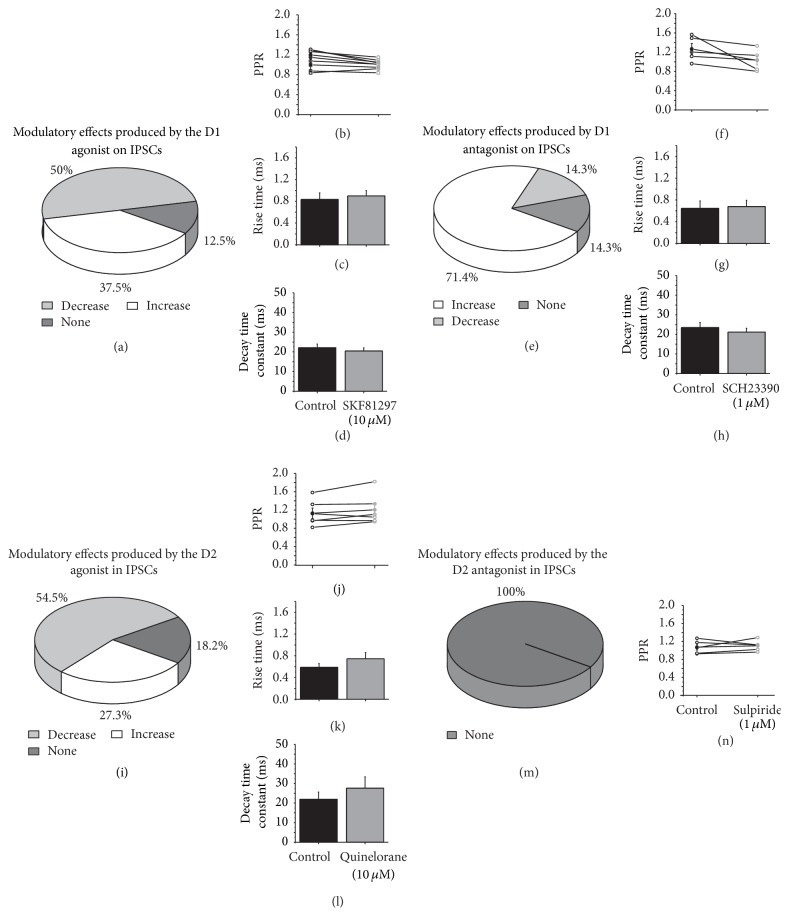
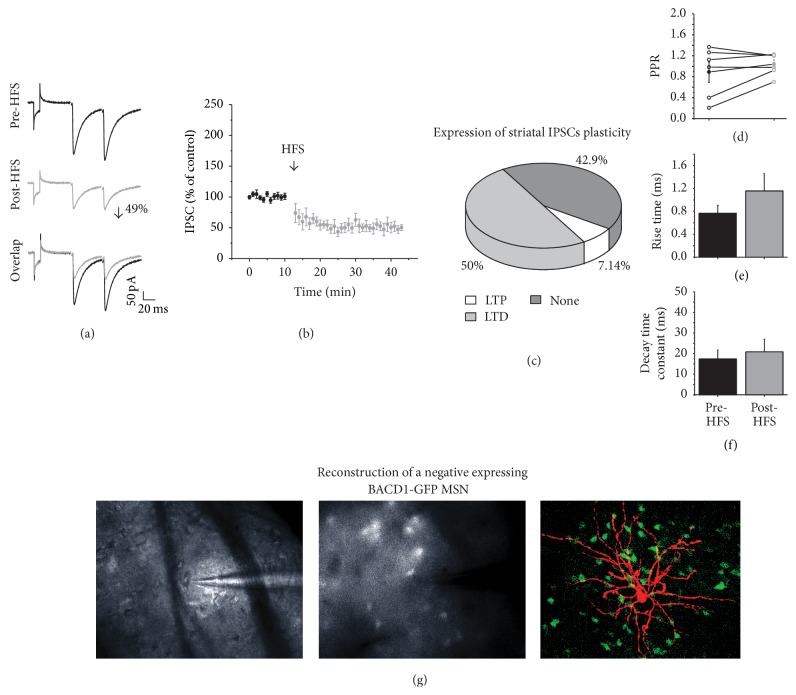
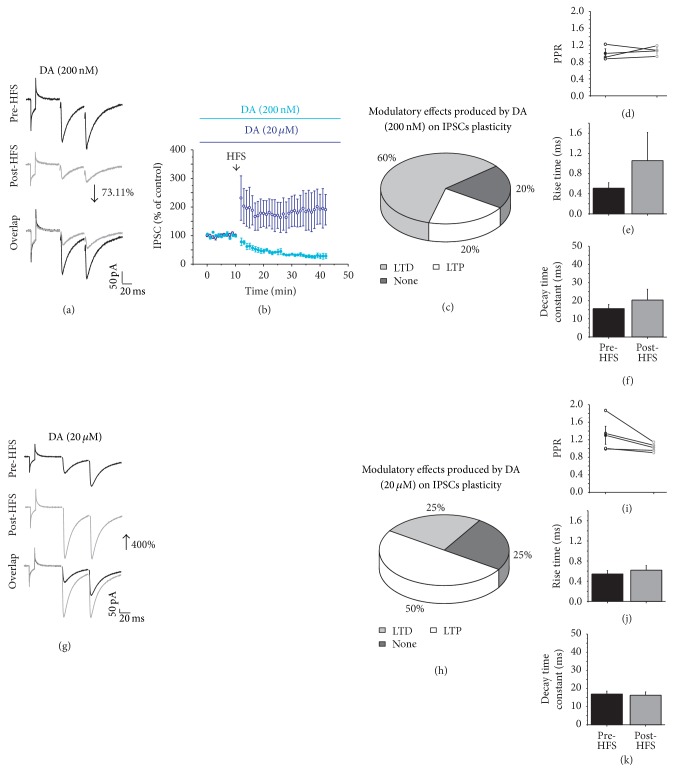
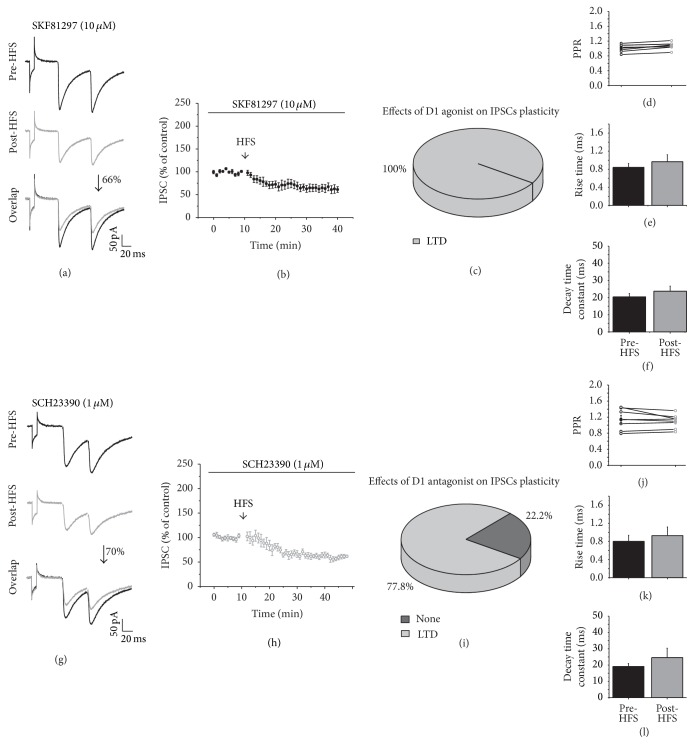
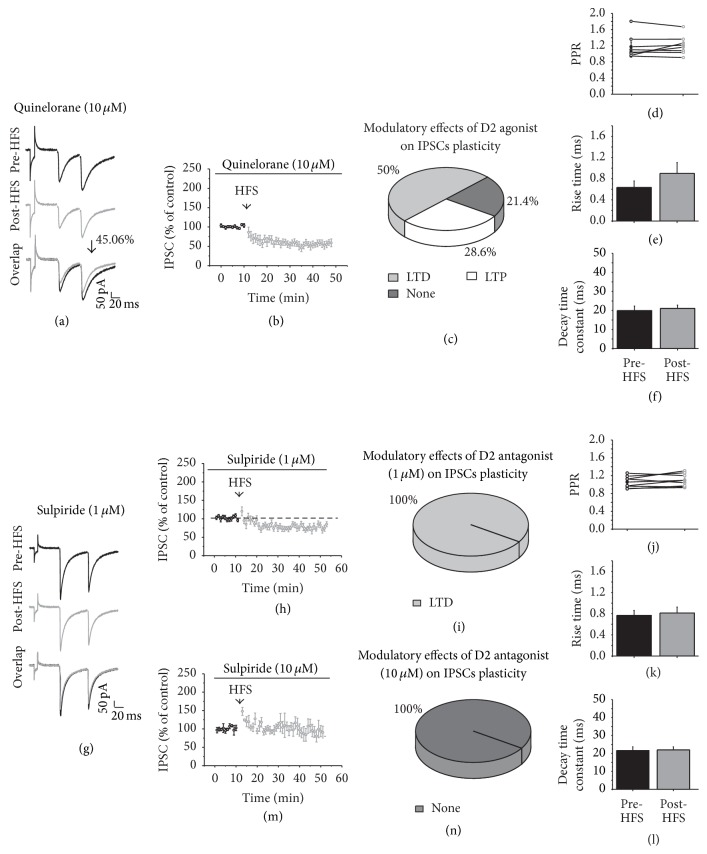
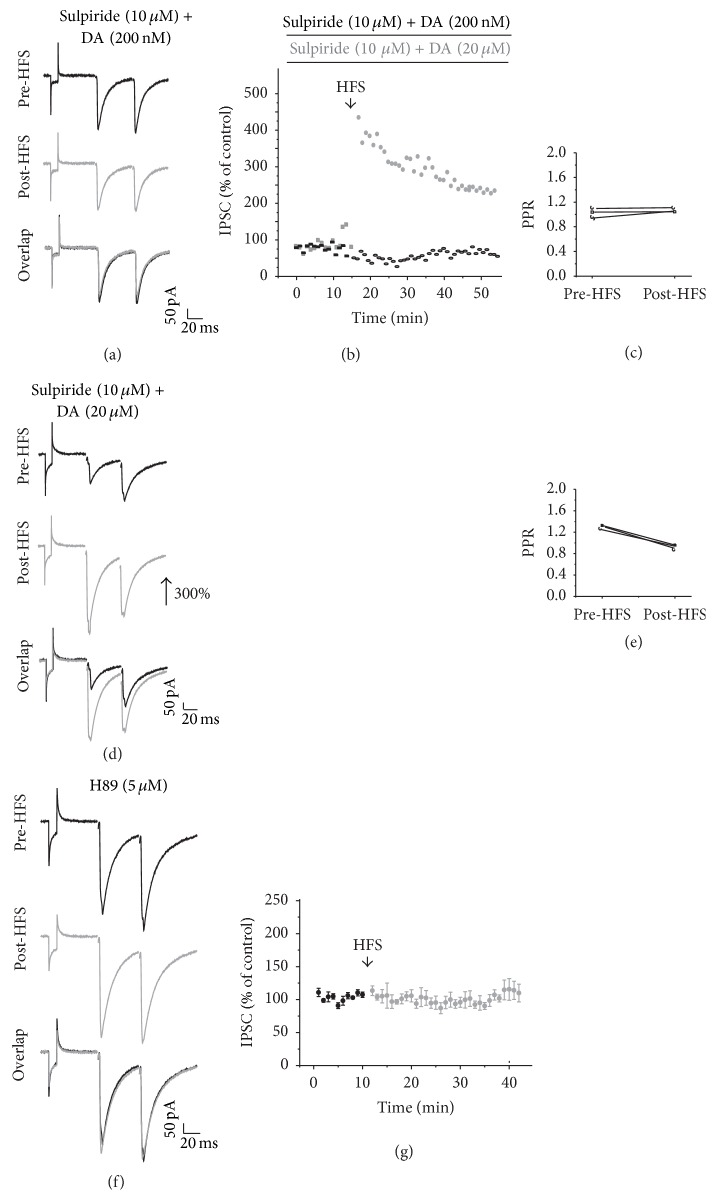
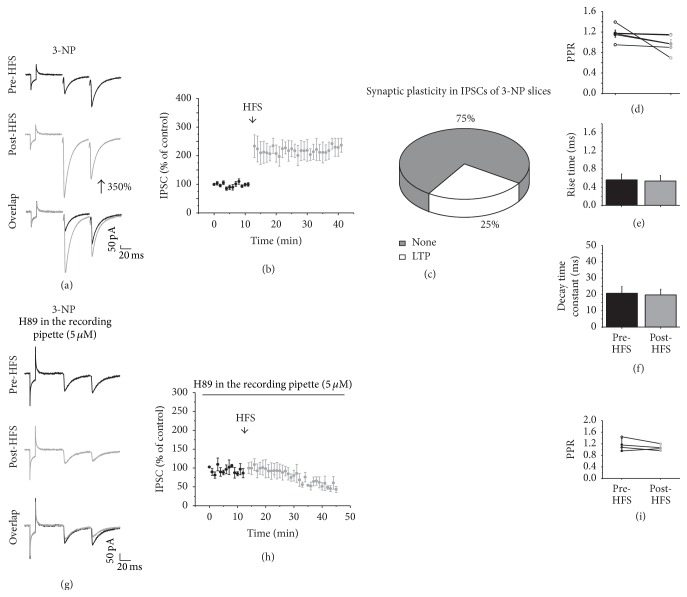
Dopamine (DA) modulates glutamatergic synaptic transmission and its plasticity in the striatum; however it is not well known how DA modulates long-term plasticity of striatal GABAergic inhibitory synapses. This work focused on the analysis of both dopaminergic modulation of inhibitory synapses and the synaptic plasticity established between GABAergic afferents to medium spiny neurons (MSNs). Our results showed that low and high DA concentrations mainly reduced the amplitude of inhibitory synaptic response; however detailed analysis of the D1 and D2 participation in this modulation displayed a wide variability in synaptic response. Analyzing DA participation in striatal GABAergic plasticity we observed that high frequency stimulation (HFS) of GABAergic interneurons in the presence of DA at a low concentration (200 nM) favored the expression of inhibitory striatal LTD, whereas higher concentration of DA (20 μM) primarily induced LTP. Interestingly, the plasticity induced in an animal model of striatal degeneration mimicked that induced in the presence of DA at a high concentration, which was not abolished with D2 antagonist but was prevented by PKA blocker.


Figures

Figure 1
Figure 1
Characterization of IPSCs recordings in MSNs. (a) Reconstruction of a MSN filled with biocytin during electrophysiological recordings in voltage clamp mode and subsequently processed with avidin-Cy3. (b) Top: IPSCs of the MSNs in the presence of CNQX (10 μM) and APV (50 μM). Middle: Bicuculline (10 μM) abolished the IPSCs of MSNs. Bottom: overlap of the recordings. H V = −70 mV.
Figure 2
Figure 2
DA modulation of striatal GABAergic transmission. (a and g) show IPSCs traces in the control (top) and in the presence of DA ((a) 200 nM or (g) 20 μM in the middle) and an overlap of the recordings (bottom). (b and h) illustrate the time course of the DA effects. Data are presented as percentage of change compared with the control in all graphs. (c and i) Pie charts illustrate the distribution of the modulatory effects of DA (200 nM and 20 μM, resp.) on the IPSC amplitude. (d and i) display the PPR comparison of the IPSCs in the control and in the presence of DA. (e and k) The rise time and (f and l) the decay time constants of the IPSCs in the control and in the presence of DA. In this figure and the rest H V = −70 mV, and recordings were in presence of CNQX (10 μM) and APV (50 μM).
Figure 3
Figure 3
D1 and D2 receptors modulate striatal GABAergic transmission. (a, e, i, and m) are pie charts to illustrate the distribution of the modulatory effects of the D1 agonist, D1 antagonist, D2 agonist, and D2 antagonist, respectively, on the IPSC amplitude. (b, f, j, and n) display the PPR comparison of IPSCs in the control and after the addition of the DA reagent. (c, g, and k) The rise time and (d, h, and l) the decay time constants of the IPSCs in the control and in the presence of SKF81297 (10 μM), SCH23390 (1 μM), Quinelorane (10 μM), and sulpiride (1 μM).
Figure 4
Figure 4
GABAergic synaptic plasticity. (a) shows representative traces of IPSC before and after the HFS (3 trains, of 100 Hz, for 3 s, with 10 s of interval). (b) Time course of the IPSC amplitudes before and after HFS. The data are normalized and presented as the percentage of change compared with the control in this figure and the rest of figures. (c) Distribution, in percentages, of the type of plasticity generated by HFS, 50% developed LTD, 7.14% developed LTP, and 42.9 did not develop plasticity. (d) PPR comparison of the IPSCs before and after HFS did not change. (e) Rise time and (f) decay time constants before and after stimulation. (g) Reconstruction of a MSN that exhibited LTD but was not positive to D1-GFP. In the left 10x magnification of the cell, in the middle 60x augmentation, note that no fluorescence is observed in the tip of the electrode. In the right, the cell was filled with biocytin during the electrophysiological recording and later processed with avidin-Cy3, to visualize it. Note that there is no overlap between GFP and the Cy3 of the MSN.
Figure 5
Figure 5
DA modulates GABAergic synaptic plasticity of MSNs. (a and g) are representative IPSC traces in the presence of DA (200 nM or 20 μM, resp.) before (top) and after HFS (middle) and an overlap of the recordings (bottom). (b) Time course of the IPSC amplitude before and after HFS in the presence of DA 200 nM (light blue) and 20 μM (dark blue). (c and h) show the distribution, in percentages, of the types of plasticity that were generated in the presence of DA (200 nM or 20 μM, resp.). (d and i) are the PPR comparisons of the IPSCs before and after HFS in the presence of DA (200 nM or 20 μM). (e and j) are the rise time, while (f and k) are the decay time before and after HFS in the presence of DA (200 nM or 20 μM).
Figure 6
Figure 6
D1 modulation of GABAergic synaptic plasticity. (a and g) show representative IPSC traces before HFS (top) and after HFS (middle) and an overlap of the recordings (bottom), all in the presence of the D1 agonist SKF81297 (10 μM) and the D1 antagonist SCH23390 (1 μM), respectively. (b and h) illustrate the time course of the effects of HFS on the IPSC amplitude in the presence of SKF81297 and SCH23390, respectively. (c and i) display the distribution in percentages of the types of plasticity that were generated in the presence of the D1 agonist or antagonist. (d and j) are the PPR comparison of the IPSCs before and after HFS in presence of SKF81297 and SCH23390, respectively. (e and k) are the rise time, while (f and l) are the decay time in the presence of SKF81297 and SCH23390, respectively, before and after HFS.
Figure 7
Figure 7
D2 modulation of GABAergic synaptic plasticity. (a and g) show representative IPSC traces before (top) and after HFS (middle) in the presence of the D2 agonist (Quinelorane, 10 μM) and the D2 antagonist (sulpiride, 1 μM), respectively, and an overlap of the recordings (bottom). (b, h, and m) are the time course of the IPSC amplitude before and after HFS in the presence of Quinelorane or sulpiride. (c and i) illustrate the distribution, in percentages, of the types of plasticity that were generated in the presence of the D2 agents. (d and j) are the PPR comparison of the IPSCs before and after HFS in presence of Quinelorane or sulpiride. (e and k) are the rise time and (f and l) are the decay time in the presence of Quinelorane or sulpiride before and after HFS. (n) HFS in the presence of sulpiride blocks the generation of LTD.
Figure 8
Figure 8
Sulpiride and H89 on DA triggered plasticity. (a and d) are representative IPSC traces in the presence of DA + sulpiride before (top) and after HFS (middle) and the overlap of the recordings (bottom). (b) Time course of the IPSC amplitude of two experiments before and after HFS in the presence of DA (200 nM) + sulpiride (10 μM) and DA (20 μM) + sulpiride (10 μM). Note that sulpiride prevented the LTD induced by DA 200 nM but did not prevent the LTP induced by HFS in the presence of DA (20 μM). (c and e) are the PPR comparison of the IPSCs before and after HFS in presence of DA (200 nM or 20 μM, resp.) + sulpiride (10 μM). (f) illustrates representative IPSC traces in the presence of PKA inhibitor H89. (g) Time course of the IPSC amplitude in the presence of the PKA blocker. Note that H89 blocks striatal plasticity induction.
Figure 9
Figure 9
Synaptic plasticity in the striatal degeneration. (a) shows representative traces of IPSC before (top) and after HFS (middle) and an overlap of the traces (bottom). Note that LTP is produced after HFS. (b) illustrates the time course of the IPSC amplitude before and after HFS. (c) displays the percentage of cells that exhibited LTP after HFS in 3-NP-treated slices. (d) shows the PPR comparison of the IPSCs before and after HFS. (e) The rise time and (f) decay time constants before and after HFS. (g) shows representative IPSCs traces before (top) and after HFS (middle) in the presence of H89 (5 μM) and overlap of the traces (bottom). (h) Time course of the IPSC amplitude before and after HFS in the presence of H89 (5 μM). Note that the block of PKA prevented the generation of LTP in 3-NP slices. (i) is the PPR comparison of the IPSCs before and after HFS in the presence of H89.

References

    1. Bromberg-Martin E. S., Matsumoto M., Hikosaka O. Dopamine in motivational control: rewarding, aversive, and alerting. Neuron. 2010;68(5):815–834. doi: 10.1016/j.neuron.2010.11.022. - DOI - PMC - PubMed
    1. Nishi A., Kuroiwa M., Shuto T. Mechanisms for the modulation of dopamine D1 receptor signaling in striatal neurons. Frontiers in Neuroanatomy. 2011;5, article 43 doi: 10.3389/fnana.2011.00043. - DOI - PMC - PubMed
    1. Willis G. L., Moore C., Armstrong S. M. Breaking away from dopamine deficiency: an essential new direction for Parkinson's disease. Reviews in the Neurosciences. 2012;23(4):403–428. doi: 10.1515/revneuro-2012-0037. - DOI - PubMed
    1. Calabresi P., Mercuri N. B., Di Filippo M. Synaptic plasticity, dopamine and Parkinson's disease: one step ahead. Brain. 2009;132(2):285–287. doi: 10.1093/brain/awn340. - DOI - PubMed
    1. Cepeda C., Buchwald N. A., Levine M. S. Neuromodulatory actions of dopamine in the neostriatum are dependent upon the excitatory amino acid receptor subtypes activated. Proceedings of the National Academy of Sciences of the United States of America. 1993;90(20):9576–9580. doi: 10.1073/pnas.90.20.9576. - DOI - PMC - PubMed

Publication types

MeSH terms

LinkOut - more resources