Comparative Study
. 2015 Sep 22;6(28):26192-215.
doi: 10.18632/oncotarget.4613.

Combined expressional analysis, bioinformatics and targeted proteomics identify new potential therapeutic targets in glioblastoma stem cells

Affiliations
Comparative Study

Combined expressional analysis, bioinformatics and targeted proteomics identify new potential therapeutic targets in glioblastoma stem cells

Biljana Stangeland et al. Oncotarget. .

Abstract

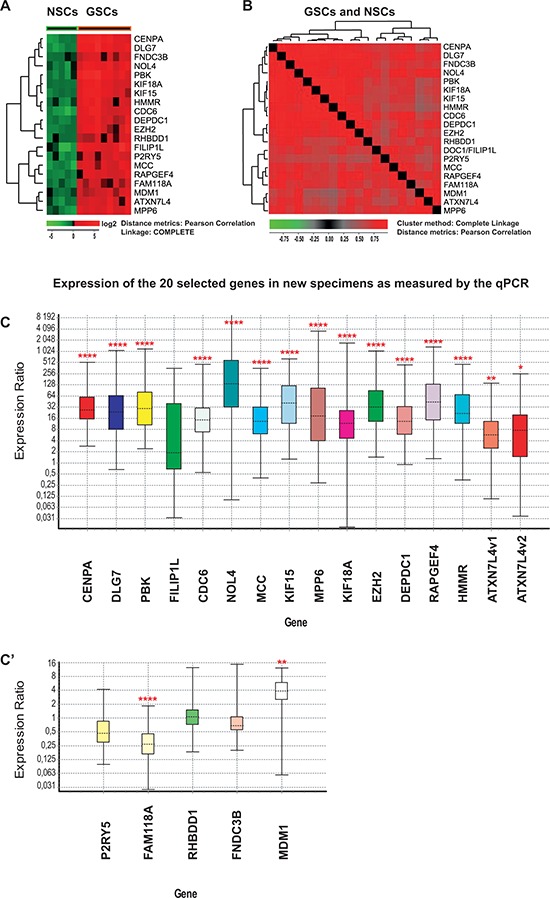
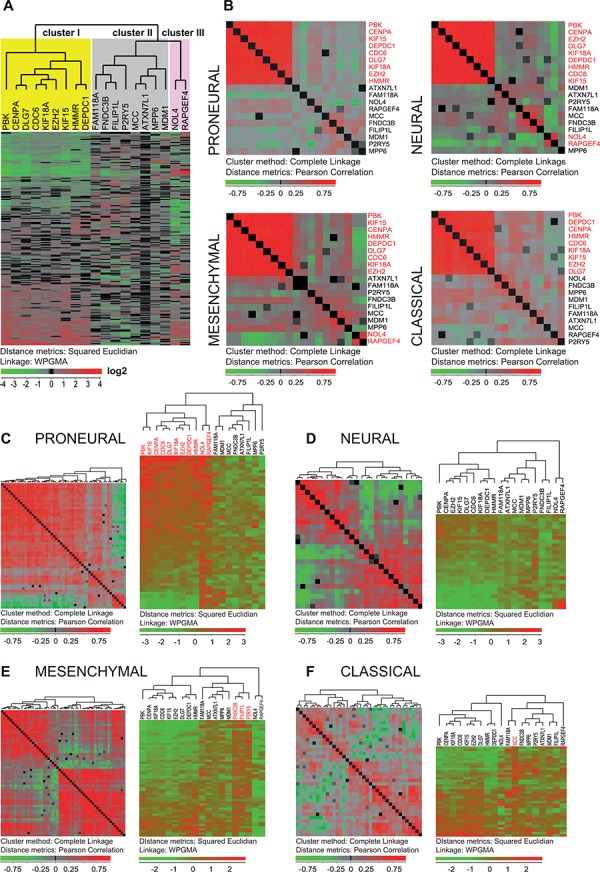
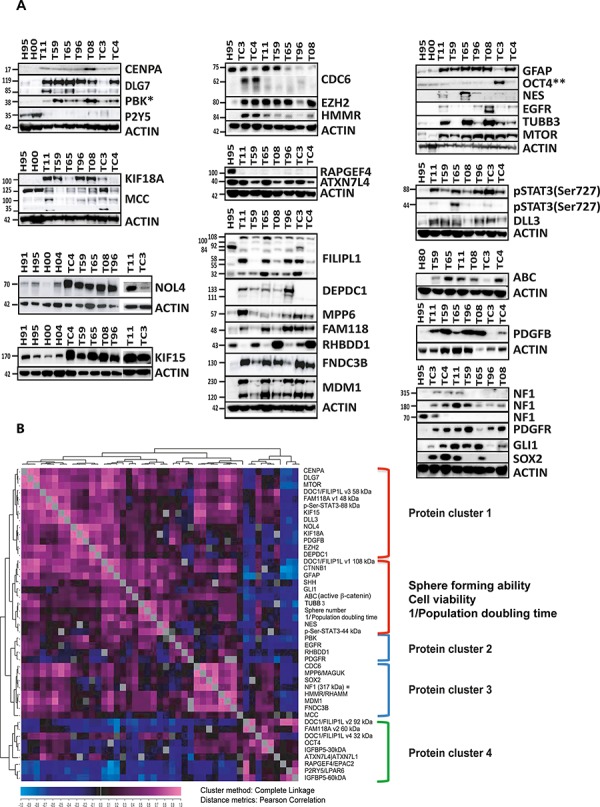
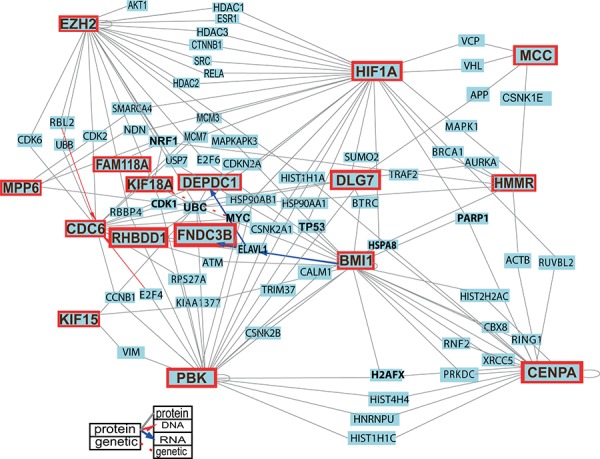
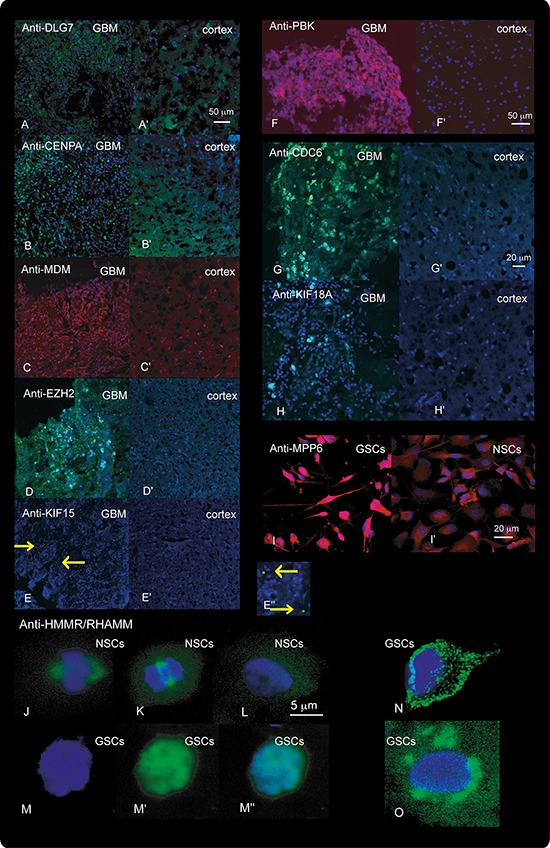
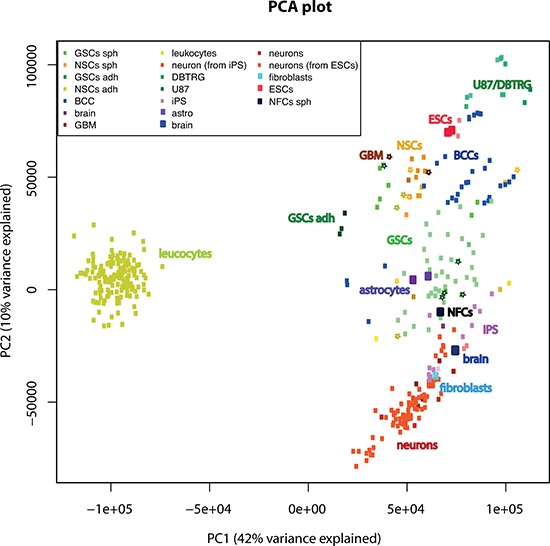
Glioblastoma (GBM) is both the most common and the most lethal primary brain tumor. It is thought that GBM stem cells (GSCs) are critically important in resistance to therapy. Therefore, there is a strong rationale to target these cells in order to develop new molecular therapies.To identify molecular targets in GSCs, we compared gene expression in GSCs to that in neural stem cells (NSCs) from the adult human brain, using microarrays. Bioinformatic filtering identified 20 genes (PBK/TOPK, CENPA, KIF15, DEPDC1, CDC6, DLG7/DLGAP5/HURP, KIF18A, EZH2, HMMR/RHAMM/CD168, NOL4, MPP6, MDM1, RAPGEF4, RHBDD1, FNDC3B, FILIP1L, MCC, ATXN7L4/ATXN7L1, P2RY5/LPAR6 and FAM118A) that were consistently expressed in GSC cultures and consistently not expressed in NSC cultures. The expression of these genes was confirmed in clinical samples (TCGA and REMBRANDT). The first nine genes were highly co-expressed in all GBM subtypes and were part of the same protein-protein interaction network. Furthermore, their combined up-regulation correlated negatively with patient survival in the mesenchymal GBM subtype. Using targeted proteomics and the COGNOSCENTE database we linked these genes to GBM signalling pathways.Nine genes: PBK, CENPA, KIF15, DEPDC1, CDC6, DLG7, KIF18A, EZH2 and HMMR should be further explored as targets for treatment of GBM.

Keywords: GBM; GSCs; glioblastoma; glioblastoma stem cells; therapeutic targeting.


Conflict of interest statement

CONFLICTS OF INTEREST

None.

Figures

Figure 1
Figure 1. Expression of the 20 selected genes in NSC and GSC cultures measured by microarrays (A-B) and qPCR (C-C’)
A. Hierarchical clustering of the 20 selected genes in NSC (green) and GSC cultures (red) using Pearson correlation as a distance metric. Gene expression was analyzed in 14 primary cell cultures from newly harvested specimens (nine GSC cultures and five NSC cultures). Red corresponds to higher gene expression levels. B. Hierarchical clustering with distance matrix using Pearson correlation as a distance measure was calculated for the same set of data as in A. Red corresponds to higher correlation levels. All fields are red thus indicating that the expression levels of the 20 selected genes are highly correlated in all 14 cultures. C-C’. Expression of the 20 selected genes in an independent set of samples measured by qPCR. Four NSC and seven GSC primary cultures were prepared from biopsies of newly harvested tissues. All genes were significantly up-regulated in GSC cultures with the exception of FILIP1L, P2RY5, RHBDD1 and FNDC3B. FAM118A was significantly down-regulated. The two isoforms of ATXN7L4 are indicated as ATXN7L4v1 and ATXN7L4v2. Expression values in GSCs were calculated using multiple controls (values obtained for all tested NSCs and NFCs) as reference. Fold change values and statistical parameters can be found in Table 1 and Supplementary Table S1. The bottom and top of each box indicate the 25th and 75th percentile (the lower and upper quartiles, respectively), and the band near the middle of the box represents the 50th percentile (the median). The ends of the whiskers represent the minima and maxima of all the data. For data analysis and the preparation of this figure we used the Pfaffl et al., 2002 algorithm utilized in REST software [61]. Asterisks correspond to p values and indicate level of significance: * = (p ≈ 0.01–0.05), ** = (p ≈ 0.001–0.01) and **** =(p < 0.0001).
Figure 2
Figure 2. Characterization of state of differentiation and growth parameters in NSCs, NFCs and GSCs
A–D. NSC cultures incubated on RN remained predominantly undifferentiated. Short incubation (up to a few weeks) on RN resulted in NSC cultures that were 99% nestin positive (NES) (A) while only 5.2% and 1.2% of cells were TUBB3 (C) and GFAP (B) positive, respectively. A. Immunolabeling with an anti-nestin antibody (green); Nuclear staining Hoechst 33258 (blue). (B–C) Weak TUBB3 and GFAP signals (red) were observed in the majority of cells but only the cells with strong staining were counted (B and yellow arrows in C). B. Very strong signal in a single GFAP positive cell (red). D. Frequency calculation for NES, GFAP and TUBB3 positive cells. E. Expression of NES in GSC culture T08. F. Close up from the marked area in E. G–J. Growth parameters calculated for NFC, NSC and GSC cultures. G. Doubling time of the cell populations (PDT). PDT values for seven GSC cultures, NFCs and NSCs are shown. NSCs were cultured either in AD1% medium (H80 SVZ and H95 HPC) or on RN. H. Growth curves of the NFC line and NSC and GSC cultures. Cell cultures were passaged for at least three times. I. Sphere forming ability of different GSC cultures varied from less than 10 to more than 60. J. Average diameter of spheres for GSC cultures was similar in the majority of cultures. In GSC culture T65, the highest number and size of spheres, and smallest PDT values were observed whilst the GSC culture T96 showed slowest growth (fewer spheres and longest PDT). The error bars represent standard deviations.
Figure 3
Figure 3. Expression of the 20 selected genes in GBM tissue specimens
A. Expression of the 19 selected genes (RHBDD1 was not represented) in the set of 200 GBM tissue samples from the TCGA database [24] is presented as a hierarchical clustering chart. The genes are divided into three groups according to their expression. B. Expression of the 19 genes calculated for each of the GBM subtypes (proneural, mesenchymal, neural and classical) presented as a hierarchical clustering with distance matrix (Pearson) chart. Each square represents correlation between two genes. Red corresponds to higher correlation levels. This analysis showed that particularly the nine following genes: CENPA, DLG7, PBK, CDC6, KIF15, KIF18A, EZH2, DEPDC1 and HMMR (red text) were highly co-expressed in all four subtypes. C–F. Both the hierarchical clustering (Squared Euclidian) and the hierarchical clustering with distance matrix (Pearson) are shown for the 19 genes in each of the GBM subtypes. For panels on the left each square represents the degree of linear dependence (Pearson correlation) between two samples. For the majority of proneural tumors (C, panel on the left) the degrees of linear dependences between the samples were high thus indicating that the expression of the whole 19-gene set was uniform in the majority of the tissue samples of this GBM subtype. The panel on the right (C) shows that especially the nine genes from cluster I (CENPA, DLG7, PBK, CDC6, KIF15, KIF18A, EZH2, DEPDC1, HMMR) and the two genes from cluster III, (NOL4 and RAPGEF4) were highly expressed in the majority of proneural samples. The expression of these genes was weaker in the mesenchymal, neural and classical GBM subtypes (D–F, right). (E) NOL4 and RAPGEF4 were lowly expressed while FND3C, P2RY5 and FILIP1L were highly expressed in the mesenchymal subtype. MCC and NOL4 were previously characterized as the genes that specify the classical (F) and proneural (C) subtypes respectively [24].
Figure 4
Figure 4. Correlation between gene expression and the survival of GBM patients
A. The correlation between gene expression and survival was calculated using the set of 200 GBM samples from the TCGA database described in Verhaak et al., 2010 [24]. This material contained 54 classical, 58 mesenchymal, 57 proneural and 33 neural GBM tissue samples. Using hierarchical clustering, the patients were sorted according to the expression of the nine genes in gene cluster I (from Figure 3A). B. The survival times of GBM patients with the highest and lowest expression of the nine genes were compared. The subclassification of these patient groups is described in the text on the left (high = blue and low = red). This analysis showed that the concurrent high expression of the nine genes had a negative effect on patient survival (median survival reduced from 383 to 290 days). The calculated p value was p = 0.00196 (Gehan-Breslow-Wilcoxon test). C. The survival times of mesenchymal subtype of GBM patients with the highest and lowest expression of the nine genes were compared (median survival reduced from 468 to 199 days). The calculated p value was p = 0.0039 (Gehan-Breslow-Wilcoxon test).
Figure 5
Figure 5. Expression of the proteins encoded by the 20 selected genes and targeted proteomics
A. Western blot showed that 15 genes were significantly up-regulated at the protein level in all tested GSC cultures, including CENPA, DLG7, PBK, FILIPL1, DEPDC1, NOL4, CDC6, KIF15, MPP6, KIF18A, EZH2, HMMR, FAM118A, FNDC3B and MDM1. RHBDD1 was up-regulated at the protein level in some of the GSC cultures while MCC and RAPGEF4 were clearly down-regulated at the protein level even though their RNA expression levels were significantly higher in GSCs. This analysis was performed in two to four NSC (not all shown) and seven GSC cultures. The observed sizes in kDa are indicated. The expected protein sizes, quantification of the observed bands and additional information can be found in Table 1 and Supplementary Figure S7. *This western blot was included in another manuscript [56]. **This western blot was previously published in [22]. B. Results of targeted proteomics. Quantified western data were used for hierarchical clustering with a distance matrix in order to determine the level of co-expression. Each square in the chart represents the Pearson's correlation between the expression levels of two proteins (pink representing the highest and dark blue the lowest correlation). Reporters of the known signaling pathways and proteins relevant for sub-classification of GBM at the protein level [26] were also included (western images of the reporters are shown in A, panel to the right). In addition to the western data, the results of the functional assays were quantified and added to the protein dataset. The sphere forming assay and PDT values are presented as normalized values (0–1, 1 being the highest sphere forming ability, 0 being the number of spheres in NSCs) and reciprocal values (1/n), respectively. The nine proteins (corresponding to the nine genes in gene cluster I) are indicated in yellow.
Figure 6
Figure 6. Protein-protein interactions among the proteins encoded by the 20 selected genes and the principal regulators of stemness, growth and tumorigenicity in GSCs
By querying the COGNESCENTE database we obtained information on protein-protein interactions documented in the literature. Fourteen of the proteins encoded by the selected 20 genes were interconnected and built a network. Several of these (PBK, CENPA, CDC6, EZH2, MPP6 and MCC) were highly interconnected and could be called network “hubs”. For clarity of the image the list of queried genes was limited to the 20 selected genes, and BMI1 and HIF1A. For a detailed image with all interactions see Supplementary Figure S8.
Figure 7
Figure 7. Results of Immunolabeling
Immunolabeling with antibodies against DLG7, CENPA, MDM, EZH2, KIF15, PBK, CDC6 and KIF18A in the cerebral cortex (A’–H’) and in GBM tissues A–H. and against MPP6 and HMMR in NSCs (I’, J–L. and GSCs I, M–O. is shown. Tissues immunolabeled with anti-DLG7 (A-A’), anti-CENPA (B-B’), anti-EZH (D-D’), anti-KIF15 (E-E”), anti-CDC6 (G-G’), anti-KIF18A (H-H’), and HMMR (J–O) were visualized with green fluorescence. Tissues and cells immunolabeled with Anti-MDM1 (C-C’), anti-PBK (F-F’) and anti-MPP6 (I-I’) were visualized with red fluorescence. DAPI staining of the nuclei is visualized as blue fluorescence. E”, Enlargement of a section from e showing the KIF15 signal (arrowheads) in GSCs. In NSCs the HMMR protein was located in centromeres during mitosis (J and K) and diffusely spread through the cytoplasm during interphase (L). In GBM HMMR was both up-regulated and showed aberrant distribution in the cells (M–O). In these cells, HMMR was detected in the cytoplasm (N), around the nucleus (O) and in the nucleus, where its expression overlapped with DAPI (M-M”). M, nuclear staining (blue). M‘ Anti-HMMR staining (green). Overlap between the two (J, M”, N and O).
Figure 8
Figure 8. Global analysis comparing GSC and NSC cultures used in this work, to various cell types and tissues. For visualization of global analysis we used principal component analysis (PCA) of gene expression
Cultures used in this work are indicated by stars. Abbreviations: DBTRG and U87 are GBM cell lines; BCC-breast cancer cells (both cell lines and cancer stem cells), ESCs-embryonic stem cells; iPS cells-induced pluripotent stem cells; adh-adherent cells.

Similar articles

Cited by

References

    1. Helseth R, Helseth E, Johannesen TB, Langberg CW, Lote K, Ronning P, Scheie D, Vik A, Meling TR. Overall survival, prognostic factors, and repeated surgery in a consecutive series of 516 patients with glioblastoma multiforme. Acta neurologica Scandinavica. 2010;122:159–167. - PubMed
    1. Stupp R, Hegi ME, Mason WP, van den Bent MJ, Taphoorn MJ, Janzer RC, Ludwin SK, Allgeier A, Fisher B, Belanger K, Hau P, Brandes AA, Gijtenbeek J, Marosi C, Vecht CJ, Mokhtari K, et al. Effects of radiotherapy with concomitant and adjuvant temozolomide versus radiotherapy alone on survival in glioblastoma in a randomised phase III study: 5-year analysis of the EORTC-NCIC trial. Lancet Oncol. 2009;10:459–466. Epub 2009 Mar 2009. - PubMed
    1. Moe MC, Varghese M, Danilov AI, Westerlund U, Ramm-Pettersen J, Brundin L, Svensson M, Berg-Johnsen J, Langmoen IA. Multipotent progenitor cells from the adult human brain: neurophysiological differentiation to mature neurons. Brain. 2005;128:2189–2199. - PubMed
    1. Moe MC, Westerlund U, Varghese M, Berg-Johnsen J, Svensson M, Langmoen IA. Development of neuronal networks from single stem cells harvested from the adult human brain. Neurosurgery. 2005;56:1182–1188. discussion 1188–1190. - PubMed
    1. Eriksson PS, Perfilieva E, Bjork-Eriksson T, Alborn AM, Nordborg C, Peterson DA, Gage FH. Neurogenesis in the adult human hippocampus. Nature medicine. 1998;4:1313–1317. - PubMed

Publication types

MeSH terms