. 2015 Sep;205(3):W233-43.
doi: 10.2214/AJR.14.14054.

Quantitative Radiology Reporting in Oncology: Survey of Oncologists and Radiologists

Affiliations

Quantitative Radiology Reporting in Oncology: Survey of Oncologists and Radiologists

Les R Folio et al. AJR Am J Roentgenol. 2015 Sep.

Abstract

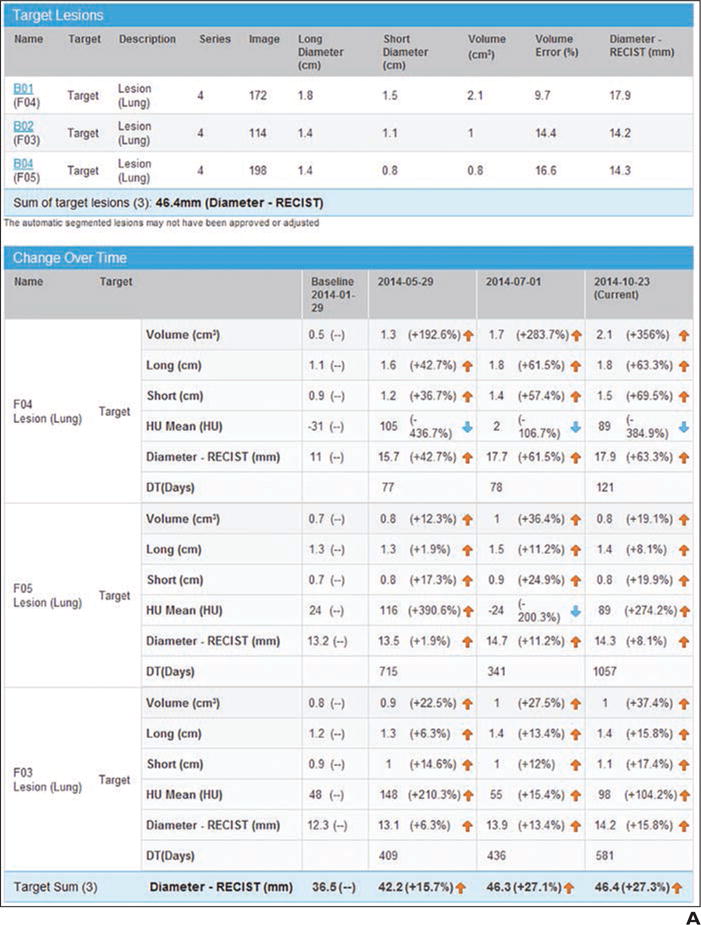
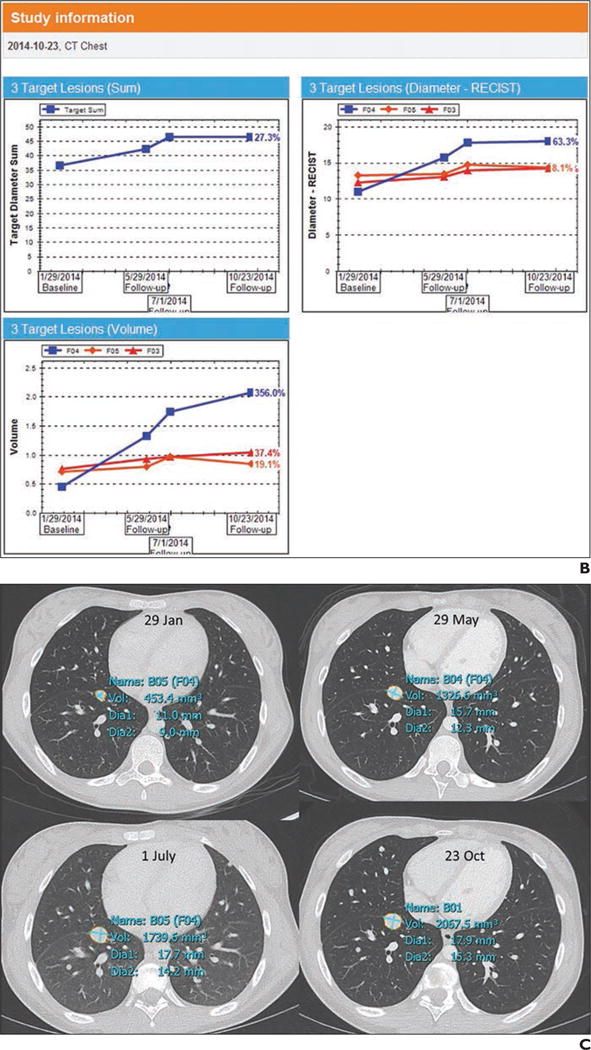
Objective: Tumor quantification is essential for determining the clinical efficacy and response to established and evolving therapeutic agents in cancer trials. The purpose of this study was to seek the opinions of oncologists and radiologists about quantitative interactive and multimedia reporting.

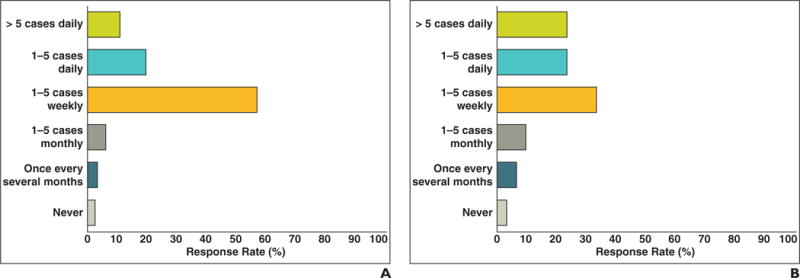
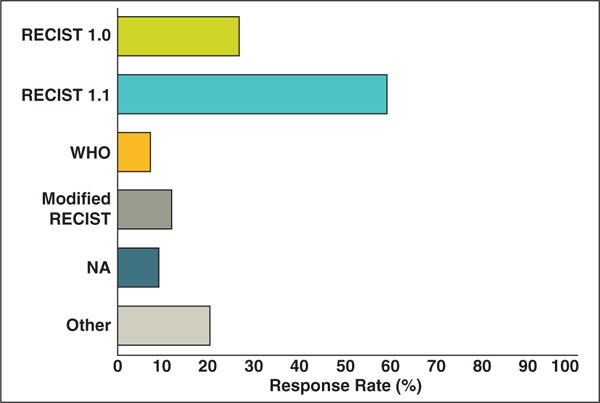
Subjects and methods: Questionnaires were distributed to 253 oncologists and registrars and to 35 radiologists at our institution through an online survey application. Questions were asked about current reporting methods, methods for Response Evaluation Criteria in Solid Tumors (RECIST) tumor measurement, and preferred reporting format.

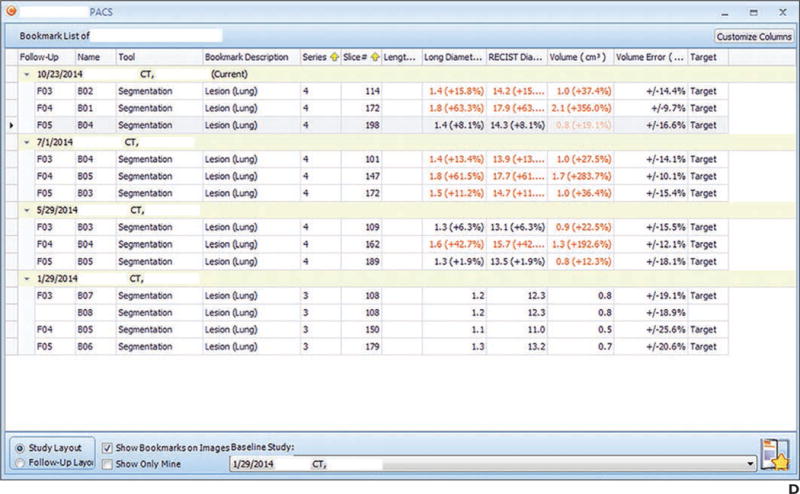
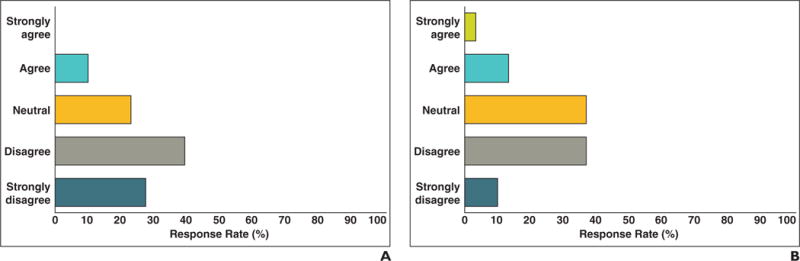
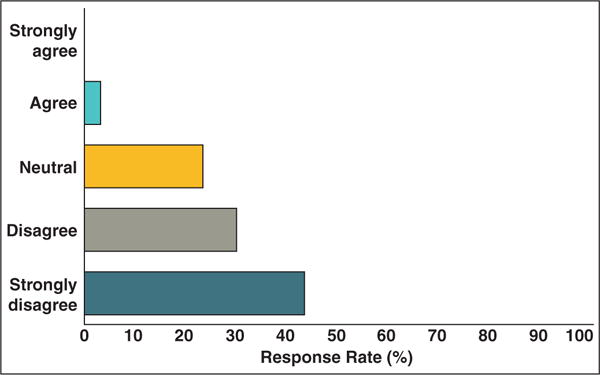
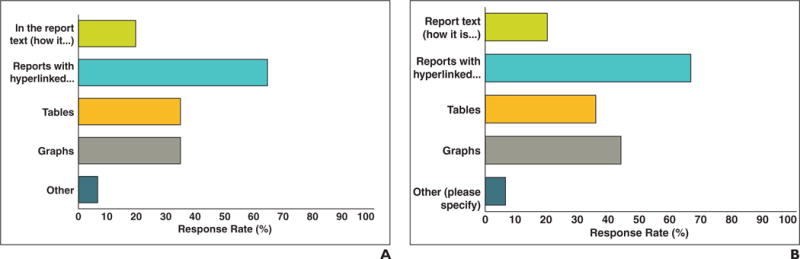
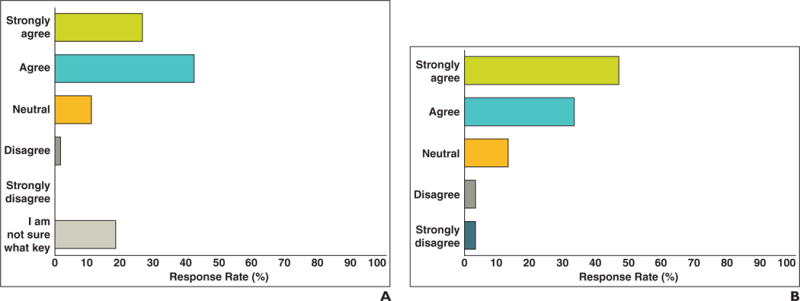
Results: The overall response rates were 43.1% (109/253) for oncologists and 80.0% (28/35) for radiologists. The oncologists treated more than 40 tumor types. Most of the oncologists (65.7% [67/102]) and many radiologists (44.4% [12/27]) (p = 0.020) deemed the current traditional qualitative radiology reports insufficient for reporting tumor burden and communicating measurements. Most of the radiologists (77.8% [21/27]) and oncologists (85.5% [71/83]) (p = 0.95) agreed that key images with measurement annotations helped in finding previously measured tumors; however, only 43% of radiologists regularly saved key images. Both oncologists (64.2% [70/109]) and radiologists (67.9% [19/28]) (p = 0.83) preferred the ability to hyperlink measurements from reports to images of lesions as opposed to text-only reports. Approximately 60% of oncologists indicated that they handwrote tumor measurements on RECIST forms, and 40% used various digital formats. Most of the oncologists (93%) indicated that managing tumor measurements within a PACS would be superior to handwritten data entry and retyping of data into a cancer database.

Conclusion: Oncologists and radiologists agree that quantitative interactive reporting would be superior to traditional text-only qualitative reporting for assessing tumor burden in cancer trials. A PACS reporting system that enhances and promotes collaboration between radiologists and oncologists improves quantitative reporting of tumors.

Keywords: productivity; quality improvement; radiology reports; tumor metrics; work flow.


Figures

Fig. 1
Fig. 1
Example of presentation in PACS. A, Screen shot shows quantitative tumor report generated in PACS. Tumor measurements are automatically exported to report after radiologist obtains measurements. B, Screen shot shows tumor data tabulated and graphs of tumor trajectory (change in tumor size over time). In this example, tumors became larger during one therapy and then stabilized between time points 3 and 4. C, Screen shot shows key images saved and their measurement annotations. D, Screen shot shows bookmark list of measurements and trajectory of each lesion linked to key images.
Fig. 1
Fig. 1
Example of presentation in PACS. A, Screen shot shows quantitative tumor report generated in PACS. Tumor measurements are automatically exported to report after radiologist obtains measurements. B, Screen shot shows tumor data tabulated and graphs of tumor trajectory (change in tumor size over time). In this example, tumors became larger during one therapy and then stabilized between time points 3 and 4. C, Screen shot shows key images saved and their measurement annotations. D, Screen shot shows bookmark list of measurements and trajectory of each lesion linked to key images.
Fig. 2
Fig. 2
Responses to “Current radiologist report is adequate for making tumor assessments.” A and B, Graphs show oncologists (A) and radiologists (B) agree that current qualitative reporting systems are inadequate for reporting tumor burden.
Fig. 3
Fig. 3
Graph shows responses to “Current clinical history in imaging request is satisfactory for radiologists to provide tumor assessments.”
Fig. 4
Fig. 4
Responses to “How often do you or your team measure tumors?” A and B, Frequency of oncologist (A) and radiologist (B) measurement of tumor burden. Approximately one half of oncologists and radiologists perform measurements in more than one to five cases weekly, some more than five cases per day.
Fig. 5
Fig. 5
Responses to “Which measurement criteria do you currently use for tumor assessment?” Bar graph shows distribution of tumor assessment criteria oncologist respondents currently use for tumor assessment. Most oncologists (59%) use Response Evaluation Criteria in Solid Tumors (RECIST) 1.1. WHO = World Health Organization, NA = not applicable.
Fig. 6
Fig. 6
Responses to “How would you like to have tumor measurements presented in radiologist reports?” A and B, Oncologist (A) and radiologist (B) preferences for presentation of tumor measurements in radiologist reports. Most (64.2% of oncologists, 67.9% of radiologists) responded that hyperlinks from report to annotated images would be desirable. Approximately one half would like to have graphs and tables included that are possible with our new PACS.
Fig. 7
Fig. 7
Responses to “Finding tumor measurements is easier when radiologists save key images in PACS that include tumor measurements from previous examinations.” A and B, Oncologist (A) and radiologist (B) responses regarding ease of finding tumor measurements when key image feature is used.

References

    1. Röntgen WK. Eine neue Art von Strahlen. Würzburg, Germany: Medicophysical Institute of the University of Würzburg; 1896.
    1. Reiner BI, Knight N, Siegel EL. Radiology reporting, past, present, and future: the radiologist’s perspective. J Am Coll Radiol. 2007;4:313–319. - PubMed
    1. Danton GH. Radiology reporting: changes worth making are never easy. Appl Radiol. 2010;39:19–23.
    1. Baker SR. The dictated report and the radiologist’s ethos: an inextricable relationship—pitfalls to avoid. Eur J Radiol. 2014;83:236–238. - PubMed
    1. Jaffe TA, Wickersham NW, Sullivan DC. Quantitative imaging in oncology patients. Part 1. Radiology practice patterns at major U.S. cancer centers. AJR. 2010;195:101–106. - PubMed

Publication types

LinkOut - more resources