. 2015 Sep 10;162(6):1322-37.
doi: 10.1016/j.cell.2015.08.004. Epub 2015 Aug 18.

Robust Anti-viral Immunity Requires Multiple Distinct T Cell-Dendritic Cell Interactions

Affiliations

Robust Anti-viral Immunity Requires Multiple Distinct T Cell-Dendritic Cell Interactions

Sarah Eickhoff et al. Cell. .

Abstract

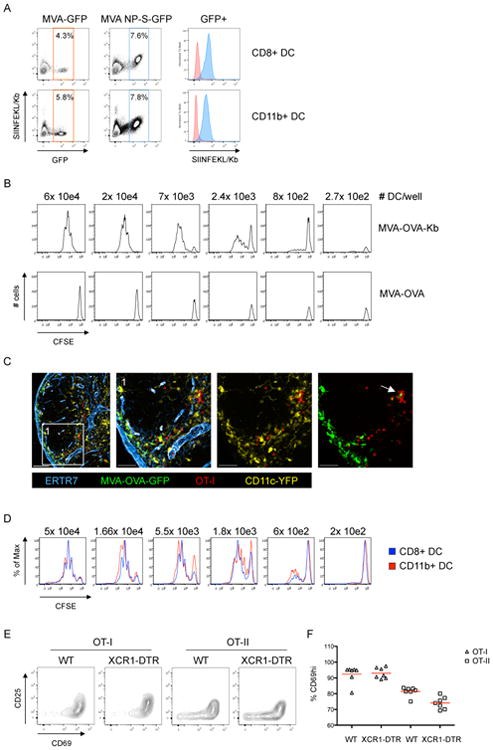
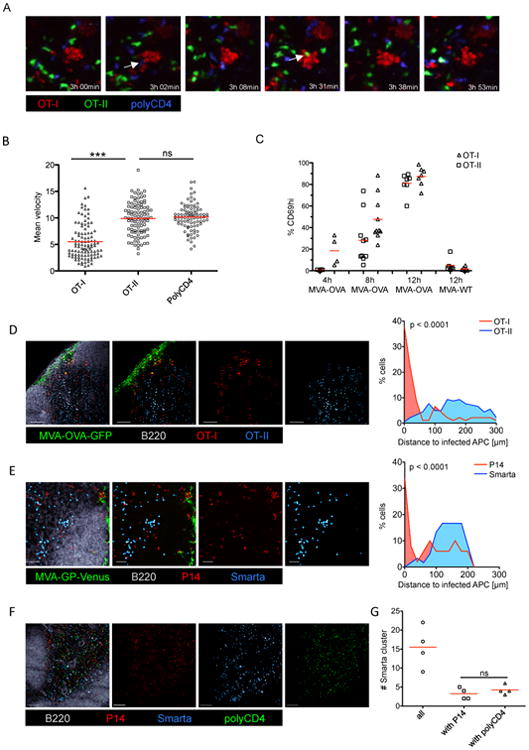
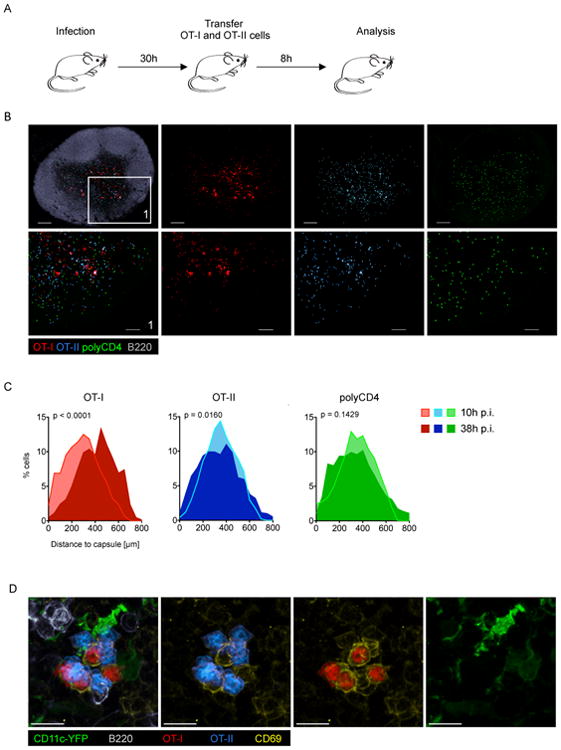
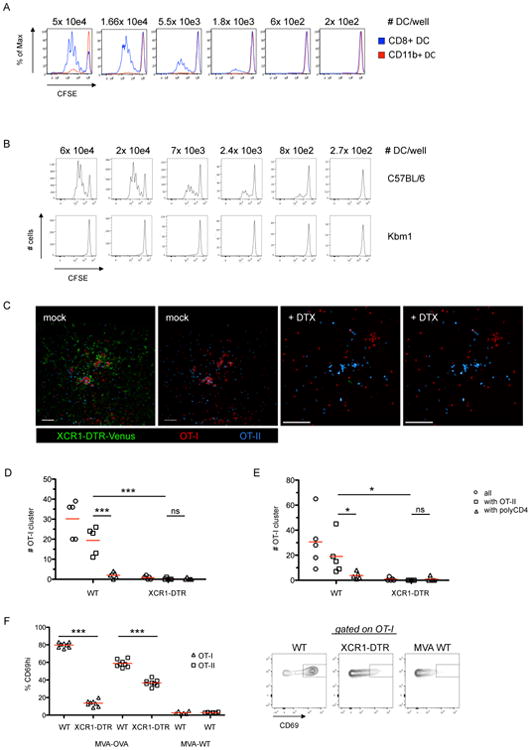
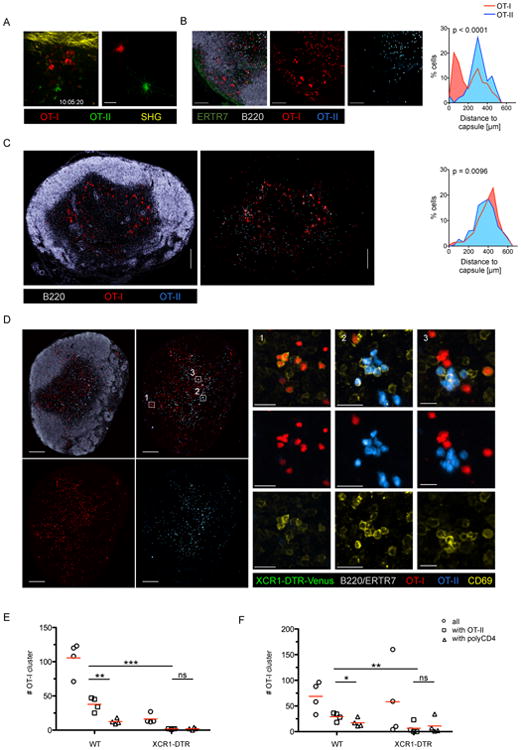
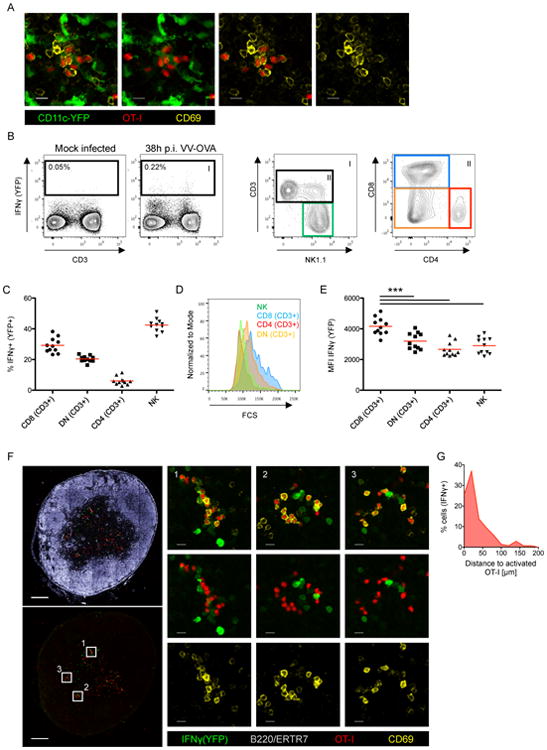
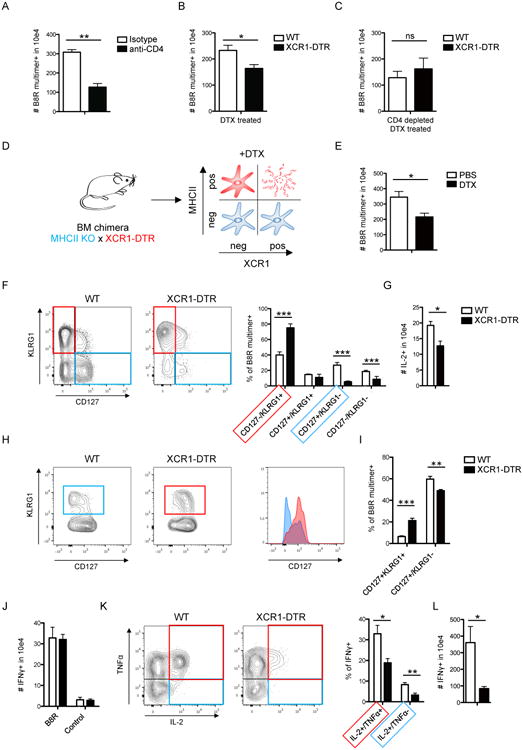
Host defense against viruses and intracellular parasites depends on effector CD8(+) T cells, whose optimal clonal expansion, differentiation, and memory properties require signals from CD4(+) T cells. Here, we addressed the role of dendritic cell (DC) subsets in initial activation of the two T cell types and their co-operation. Surprisingly, initial priming of CD4(+) and CD8(+) T cells was spatially segregated within the lymph node and occurred on different DCs with temporally distinct patterns of antigen presentation via MHCI versus MHCII molecules. DCs that co-present antigen via both MHC molecules were detected at a later stage; these XCR1(+) DCs are the critical platform involved in CD4(+) T cell augmentation of CD8(+) T cell responses. These findings delineate the complex choreography of cellular interactions underlying effective cell-mediated anti-viral responses, with implications for basic DC subset biology, as well as for translational application to the development of vaccines that evoke optimal T cell immunity.


Figures

Figure 1
Figure 1. Direct priming of CD8+ T cells does not require XCR1+ DC
(A) Analysis of splenic DC after i.v. infection with MVA-GFP or MVA-NP-SIINFEKL-GFP (8h p.i.). (B) Analysis of OT-I proliferation after ex vivo coincubation with isolated splenic DC from Kbm1 mice infected with MVA-OVA or MVA-OVA-Kb (8h pi). (C) Immunofluorescent (IF) images of a dLN showing clustering/interaction between transferred OT-I cells and infected (GFP-expressing) DC (MVA-OVA-GFP; f.p.; 8h p.i.). (D) Analysis of OT-I proliferation after coincubation with DC subsets sorted ex vivo (MVA-OVA; i.v.; 8h p.i.). (E/F) Activation marker (CD25/CD69) upregulation on transferred OT-I and OT-II cells in the popliteal LN 12h after f.p. infection (MVA-OVA). Representative plots (E) and analysis (F) are shown comparing DTX-treated WT and XCR1-DTR animals. Data are representative of three (n=3) (A-D) and two (n=4) (E/F) independent experiments. ** = p≤0.01, ns = non-significant, scale bars 100/50 μm. See also Figure S1 and Movie S1.
Figure 2
Figure 2. Priming of CD4+ and CD8+ T cells occurs on spatially distinct DC
(A) Images from IVM of the popliteal LN 3-4h after MVA-OVA f.p. infection. OT-I, OT-II and control cells (polyclonal CD4+ T cells) were transferred 24h prior to infection. White arrows indicate brief interaction between clustered OT-I and OT-II or control cells (see also Movie S2). (B) Analysis of the mean velocity of transferred T cells using the data shown in Movie S2, (red bars indicate mean values). (C) Analysis of CD69 upregulation on transferred OT-I and OT-II cells in the dLN at different time-points after f.p. infection (MVA-OVA/MVA WT). (D/E/F) IF images of a dLN showing the localization of (D) transferred OT-I and OT-II cells (MVA-OVA-GFP), (E) transferred P14 and Smarta cells (MVA-GP-Venus), (F) transferred P14, Smarta and polyclonal CD4+ T cells (MVA-GP) 10h p.i. (G) Quantification of cluster abundance from four experiments as in F. Data are representative of at least two independent experiments (A/B; n=10), (C/G; n=4-8; pooled data) (D-F; n=10). *** = p≤0.001, ns = non-significant, scale bars (D/E/F) 100 μm, See also Figure S2 and Movie S2.
Figure 3
Figure 3. CD4+ and CD8+ T cells co-cluster later during infection
(A) Schematic of the experimental set-up to reveal antigen-bearing cells later in the course of infection (MVA-OVA). (B) IF images of the dLN showing the localisation of OT-I, OT-II and control cells (polyclonal CD4 T cells). (C) Histograms showing cellular localisation 10h (see Figure 2) or 38h p.i. (see experimental set-up shown in 3A). (D) IF image of the dLN showing a mixed OT-I/OT-II cell cluster and activation status (CD69). Data are representative of 10 (B/D; n=20) or three (C; n=3) independent experiments. Scale bars (B) 200 μm/100 μm, (D) 10 μm. See also Figure S3.
Figure 4
Figure 4. Non-infected cross-presenting XCR1+ DC are the information-transmission platform for CD4+ and CD8+ T cells
(A) Proliferation of CFSE labeled OT-I cells after ex vivo coincubation with sorted splenic DC subsets (MVA-OVA; i.v.; 30h p.i.). (B) Proliferation of CFSE labeled OT-I cells after ex vivo coincubation with isolated splenic DC from WT or Kbm1 mice 30h p.i. (MVA-OVA-Kb; i.v.). (C) Images of dLN using the experimental set-up as in Figure 3A. XCR1-DTR-Venus mice were treated with PBS or DTX. (D/E) T cell cluster abundance in the presence or absence of XCR1 DC using a (D) semi-automated or (E) fully automated analysis. (F) Analysis and representative plots of CD69 expression on OT-I/OT-II cells that were transferred 28h post infection (MVA-OVA/MVA WT; f.p.) and analyzed 12h later in the dLN. Data are representative of three independent experiments (n=8). *** = p≤0.001, scale bars 50 μm. See also Figure S4.
Figure 5
Figure 5. XCR1+ DC are the information transfer platform for CD4+ and CD8+ T cells during VV infection
(A) IF image and translated tracks from IVM of the popliteal LN 10-11h after VV-OVA infection (f.p.). See also Movie S3. (B) IF images of a dLN showing the localization and cluster formation of transferred OT-I and OT-II cells (VV-OVA; f.p.; 10h p.i.). (C/D) IF images of the dLN of a XCR-DTR-Venus mice treated with PBS (C) or DTX (D) showing the localization of labeled OT-I and OT-II cells following the experimental set-up shown in Figure 3A using VV-OVA. (E/F) T cell cluster abundance in the presence or absence of XCR1 DC using a (D) semi-automated or (E) fully automated analysis. Data are representative of three independent experiments (n=4). Scale bars (A) 50 μm, (B) 100μm, (C) 200 μm, (D) 200 μm/20 μm. See also Figure S5 and Movie S4.
Figure 6
Figure 6. Localization of endogenous activated CD8+ T cells during VV infection
(A) IF Images of a LN showing co-localization of transferred OT-I cells and endogenous (non-OT-I) CD69hi cells (VV-OVA; f.p.; 10h p.i.). (B/C/D/E) Analysis of IFNγ(YFP+) reporter animals (VV-OVA; 36h p.i.). (B) Graphs show the gating strategy, (C) the cellular distribution, (D) the size distribution and (E) the mean fluorescence intensity (MFI) of the YFP signal of IFNγ+(YFP+) cells (red bars indicates mean values). (F) IF images showing the localization of YFP expressing cells 36h after infection of IFNγ (YFP+) reporter animals (VV-OVA; f.p.). OT-I cells were transferred 8h before analysis. (G) Histogram shows the distance between IFNγ+(YFP+) cells and activated (CD69hi) OT-I cells. Data are representative of two independent experiments (n=8) (C/E/G) shows pooled data. *** = p≤0.001, scale bar (A) 10 μm, (F) 200 μm/10 μm. See also Figure S6.
Figure 7
Figure 7. VV-specific T cells activated in the absence of XCR1+ DC are ‘helpless’
(A-C) Analysis of the total numbers of B8R multimer-specific splenic CD8+ T cells 8 days after VV-OVA infection (i.p.). Comparison of (A) isotype vs. CD4 depleted mice, (B) WT vs. XCR1-DTR mice treated with DTX and (C) WT vs. XCR1-DTR mice treated with DTX and anti-CD4 antibodies. (D) Schematic of DC composition in bone-marrow (bm) chimeric animals (MHCII KO × XCR1-DTR → WT). (E) Antiviral CD8+ immune response is shown comparing DTX vs. PBS treated bm chimeric animals on d8 (VV-OVA i.p.). (F/G) Analysis of B8R specific immune responses d8 p.i. (VV-OVA i.p.), comparing WT vs. XCR1-DTR animals treated with DTX, showing (F) the phenotype of B8R multimer-specific CD8+ T cells and (G) the amount of IL-2 producing CD8+ T cells after peptide (B8R) stimulation for 5h. (H-L) Analysis of the immune response 60 p.i. (VV-OVA i.p.), comparing WT vs. XCR1-DTR animals treated with DTX. (H) Phenotype and (I) relative distribution of B8R multimer-specific memory subsets. (J) Absolute numbers of IFNγ-producing CD8+ T cells, (K) relative distribution of polyfunctional CD8+ T cells (gated on IFNγ+) after peptide (B8R) stimulation. (L) Recall response d5 after Lm-B8R challenge. Graph shows total numbers of IFNγ-producing CD8+ T cells after peptide (B8R) stimulation. Data are representative of three or two (L) independent experiments (n=4). The graphs show mean +SEM. * = p≤0.05, ** = p≤0.01, *** = p≤0.001, ns = “non significant”. See also Figures S7.

Comment in

References

    1. Alcami A, Koszinowski UH. Viral mechanisms of immune evasion. Trends Microbiol. 2000;8:410–418. - PMC - PubMed
    1. Allan RS, Waithman J, Bedoui S, Jones CM, Villadangos JA, Zhan Y, Lew AM, Shortman K, Heath WR, Carbone FR. Migratory dendritic cells transfer antigen to a lymph node-resident dendritic cell population for efficient CTL priming. Immunity. 2006;25:153–162. - PubMed
    1. Becker M, Guttler S, Bachem A, Hartung E, Mora A, Jakel A, Hutloff A, Henn V, Mages HW, Gurka S, et al. Ontogenic, Phenotypic, and Functional Characterization of XCR1(+) Dendritic Cells Leads to a Consistent Classification of Intestinal Dendritic Cells Based on the Expression of XCR1 and SIRPalpha. Front Immunol. 2014;5:326. - PMC - PubMed
    1. Bedoui S, Whitney PG, Waithman J, Eidsmo L, Wakim L, Caminschi I, Allan RS, Wojtasiak M, Shortman K, Carbone FR, et al. Cross-presentation of viral and self antigens by skin-derived CD103+ dendritic cells. Nat Immunol. 2009;10:488–495. - PubMed
    1. Bennett SR, Carbone FR, Karamalis F, Flavell RA, Miller JF, Heath WR. Help for cytotoxic-T-cell responses is mediated by CD40 signalling. Nature. 1998;393:478–480. - PubMed

Publication types