. 2015 Sep;27(9):2484-500.
doi: 10.1105/tpc.114.126664. Epub 2015 Aug 21.

Differential Growth in Periclinal and Anticlinal Walls during Lobe Formation in Arabidopsis Cotyledon Pavement Cells

Affiliations

Differential Growth in Periclinal and Anticlinal Walls during Lobe Formation in Arabidopsis Cotyledon Pavement Cells

William J Armour et al. Plant Cell. 2015 Sep.

Abstract

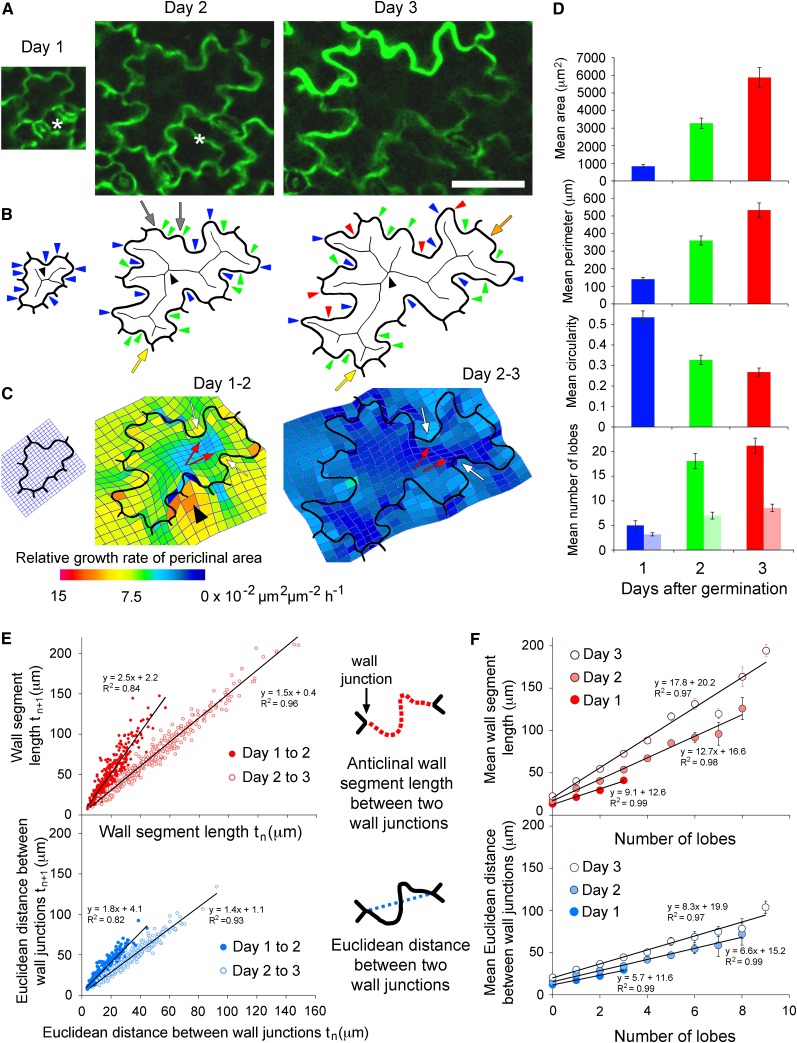
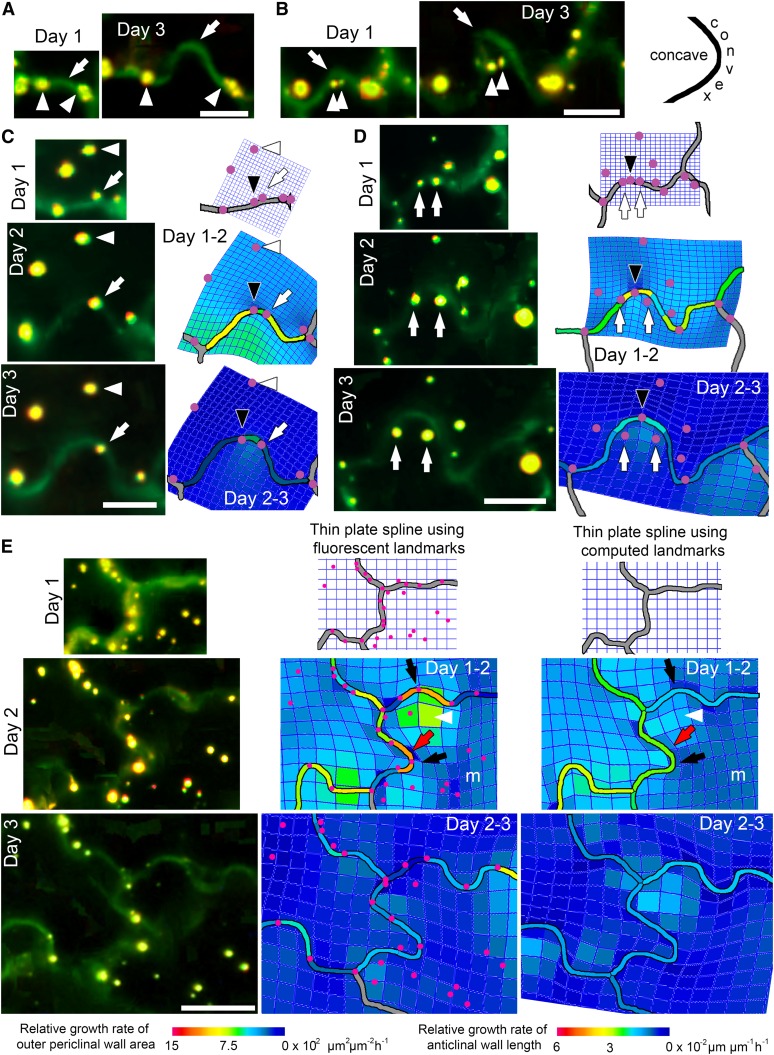
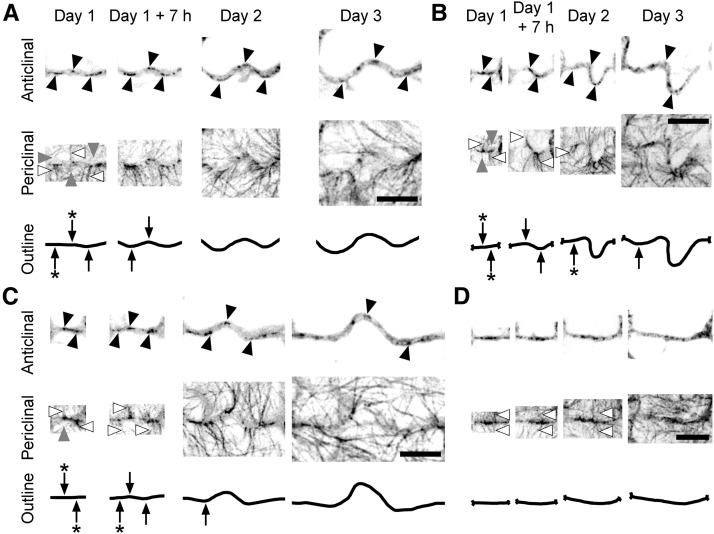
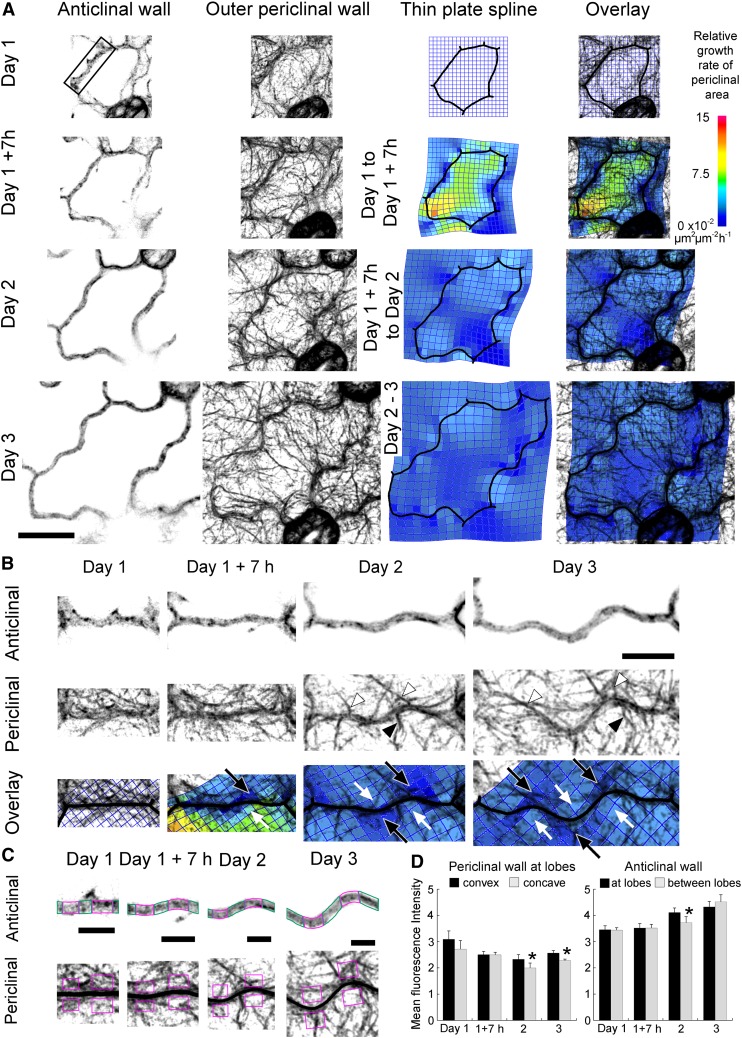
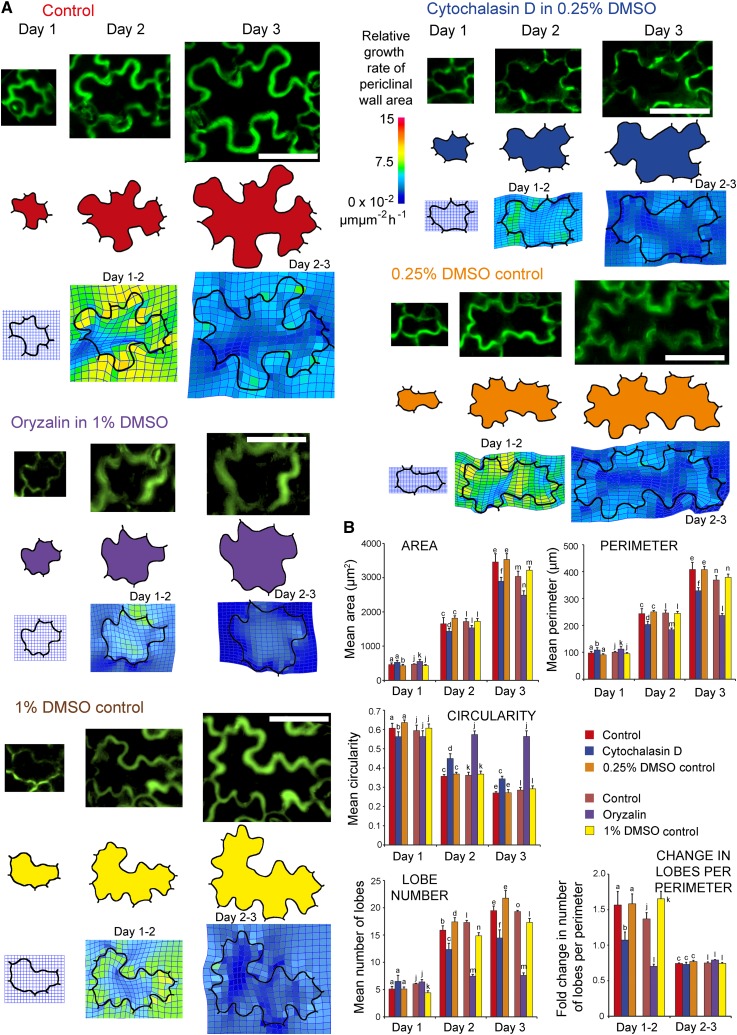
Lobe development in the epidermal pavement cells of Arabidopsis thaliana cotyledons and leaves is thought to take place via tip-like growth on the concave side of lobes driven by localized concentrations of actin filaments and associated proteins, with a predicted role for cortical microtubules in establishing the direction of restricted growth at the convex side. We used homologous landmarks fixed to the outer walls of pavement cells and thin-plate spline analysis to demonstrate that lobes form by differential growth of both the anticlinal and periclinal walls. Most lobes formed within the first 24 h of the cotyledons unfurling, during the period of rapid cell expansion. Cortical microtubules adjacent to the periclinal wall were persistently enriched at the convex side of lobes during development where growth was anisotropic and were less concentrated or absent at the concave side where growth was promoted. Alternating microtubule-enriched and microtubule-free zones at the periclinal wall in neighboring cells predicted sites of new lobes. There was no particular arrangement of cortical actin filaments that could predict where lobes would form. However, drug studies demonstrate that both filamentous actin and microtubules are required for lobe formation.


Figures

Figure 1.
Figure 1.
Lobe Development and Growth of Arabidopsis Pavement Cells. (A) A representative cell at 1, 2, and 3 d after germination. A neighboring cell divided between days 1 and 2 (asterisks). Bar = 50 µm and applies to all three images of the cell between days 1 and 3. (B) Digital outlines of the cell. Lobes at day 1 (blue arrowheads) and new lobes at day 2 (green arrowheads) and day 3 (red arrowheads) were identified manually. Alternatively, concave lobes were identified at the branch ends of each skeleton (black arrowheads indicate the skeletons). Skeleton branch ends were sometimes present at wall junctions (yellow arrows) or regions of straight wall (orange arrow) and were not always located at small concave lobes (gray arrows). (C) Thin-plate spline analysis (mesh overlying cell outline) of differential growth in cell walls between days 1 and 2 and days 2 and 3. Periclinal wall growth was predicted to be isotropic on the concave side of lobes (white arrows) and anisotropic on the convex side (red arrows). The region of intense growth (arrowhead) corresponds to the newly divided cell (asterisk in [A]). (D) The mean area, perimeter, and circularity of 50 pavement cells at days 1, 2, and 3. A circularity value of 1 is a perfect circle, and 0 is an infinitely complex shape. The mean number of lobes (concave and convex) within each cell per day was identified manually (dark bars) or the mean number of concave lobes was ascertained by counting skeleton branch ends (light bars). Error bars are se of the mean. (E) The length of each anticlinal wall segment between two wall junctions within the 50 pavement cells was compared between successive days. For each wall segment, the Euclidean distance between the two wall junctions was also compared between days. (F) The number of lobes per mean anticlinal wall segment length between wall junctions or per Euclidean distance between wall junctions on day 1, 2, or 3. Error bars are se of the mean. The sample sizes on day 3 are: 154 anticlinal wall segments with 0 lobes, 116 with 1 lobe, 46 with 2 lobes, and 10 with 3 lobes; on day 4: 16 anticlinal wall segments with 0 lobes, 72 with 1 lobe, 77 with 2 lobes, 72 with 3 lobes, 48 with 4 lobes, 22 with 5 lobes, 12 with 6 lobes, 4 with 7 lobes, and 3 with 8 lobes; on day 5: 12 anticlinal wall segments with 0 lobes, 45 with 1 lobe, 71 with 2 lobes, 80 with 3 lobes, 57 with 4 lobes, 28 with 5 lobes, 19 with 6 lobes, 4 with 7 lobes, 7 with 8 lobes, and 4 with 9 lobes.
Figure 2.
Figure 2.
Anticlinal and Periclinal Wall Growth Varies across a Region of Contiguous Pavement Cells. Fluorescently stained pavement cells at the base of a cotyledon and their digital outlines on days 1, 2, and 3 after germination. The relative anticlinal and periclinal wall growth rates from days 1 to 2 are depicted as a color scale on day 2 images and the growth rates from days 2 to 3 on day 3 images. New anticlinal walls are gray because their growth rates could not be calculated. New lobes sometimes developed within preexisting lobes (black arrowhead). Each thin-plate spline (mesh overlay on the periclinal wall images) models differential movement of the wall junctions (black dots) between days. Bar = 100 µm.
Figure 3.
Figure 3.
Differential Growth of the Outer Periclinal and Anticlinal Walls at Lobes during Development. Anticlinal walls (green) and the position of externally applied fluorescent markers on the outer periclinal wall (yellow) during lobe formation from 1 to 3 d after germination from selected walls in Figure 2. Thin-plate spline analysis (mesh) depicts growth of the outer periclinal wall by comparing the positions of homologous landmarks (fluorescent markers, wall junctions, and lobe tips; represented as magenta dots) over time. The relative growth rate of anticlinal wall segments between homologous landmarks is shown by the color overlay on the anticlinal walls. (A) Lobe formation (arrows) between two fluorescent markers (arrowheads) demonstrating anticlinal wall growth. Bar = 10 µm. (B) During development of this lobe, two fluorescent markers (arrowheads) originally positioned near the lobe tip move a similar distance away from the tip (arrows), demonstrating periclinal wall growth. The diagram on the right illustrates the position of the convex and concave sides of a lobe. Bar = 10 µm. (C) A fluorescent marker (arrow) on the anticlinal wall near a lobe tip (black arrowhead) remains at a relatively constant distance from a second marker (white arrowhead) on the convex side of the lobe during lobe formation. Thin-plate spline analysis shows restriction of periclinal wall growth on the convex side of the lobe (blue) and promotion of growth on the concave side (green). Bar = 10 µm. (D) Development of two lobes depicted by thin-plate spline analysis. Growth of the periclinal wall is promoted at the concave side of the lobes as demonstrated by the displacement of two fluorescent markers (arrows) from the anticlinal wall at a lobe tip (black arrowhead). Bar = 10 µm. (E) Lobe development in multiple cell walls investigated using two thin-plate spline approaches: (1) using externally applied landmarks and (2) using computed landmarks positioned along the anticlinal wall (landmarks not shown; for an example, see Supplemental Figure 1). Between days 1 and 2, there is differential growth of the periclinal walls with anisotropic growth at the convex side of developing lobes (black arrows) as shown by elongated mesh, which was sometimes skewed to one side of a lobe (red arrows). Growth of the periclinal wall is greatest at the concave side of lobes (arrowheads) and slower in the middle (m) of cells. The distances between externally applied homologous landmarks showed that anticlinal wall segment growth rates varied along a wall with greatest rates at lobe tips. In the thin-plate spline analysis using computed landmarks, it was assumed that growth of each anticlinal wall segment was at a constant rate and these rates varied between walls. From day 2 to 3, growth of anticlinal and periclinal walls was slower. Bar = 50 µm.
Figure 4.
Figure 4.
During Pavement Cell Development at the Periclinal Wall, Microtubules Associate with the Convex Side of Lobes and Microtubule Free Zones Persist at the Concave Side of Lobes. The arrangement of microtubules and growth of cell walls during lobe development in pavement cells expressing GFP-TUB6 from 1 to 3 d after germination. Fluorescence images are optical sections of the anticlinal wall at the middle of the cell and projections of serial sections of the cortical cytoplasm next to the outer periclinal wall. Thin-plate spline analysis predicts relative growth rates in the outer periclinal wall between consecutive time periods. (A) Microtubule arrangements during the development of a representative pavement cell from 1 to 3 d after germination. In the overlays, concentrations of microtubules correlate with regions of relatively slower periclinal wall growth. Bar = 20 µm. (B) and (C) Formation of lobes from two anticlinal walls (the solid and dashed line boxes in [A]) at higher zoom. At the anticlinal wall, cortical microtubules associate with the convex side of lobe tips (black arrowheads) during development and extend to the periclinal wall, where these microtubules fan out from the convex side of lobes (white arrowheads). Thin-plate spline analysis predicts that periclinal wall growth is slower at the convex side of lobes, which have bands of microtubules during development (white arrows), and is faster at the concave side of lobes, where microtubules are less concentrated or absent (black arrows). Bars = 10 µm. (D) Microtubule fluorescence intensities were measured for the anticlinal wall at lobe tips (areas at lobes outlined in magenta) and other regions of the wall (areas between lobes outlined in green). Fluorescence intensities at the periclinal walls on the concave side of lobes were compared with those on the convex side (areas within magenta boxes). Bars = 5 µm. (E) The average microtubule fluorescence intensities at lobes within cells, including the cell in (A), measured as in (D), at each time point are represented with standard errors. Statistical significant differences within a time point are denoted by an asterisk (P < 0.05, two-sample t test). Seven lobes were chosen per cell and one cell per plant. n = 4 plants at day 1 and 5 plants at day 1 +7 h, day 2, and day 3.
Figure 5.
Figure 5.
Microtubule Banding Predicts the Growth of New Lobes. Microtubule arrays at four walls during lobe development of pavement cells expressing GFP-TUB6 from 1 to 3 d after germination. Fluorescence images are optical sections of the anticlinal wall at the middle of the cell and projections of serial sections of the cortical cytoplasm next to the outer periclinal wall. Microtubules were present as bands at the anticlinal wall surface (black arrowheads) and were continuous with microtubules at the outer periclinal cortex region (white arrowheads). Microtubules were less concentrated or absent at the outer periclinal concave region (gray arrowheads). Straight areas of wall enriched with microtubules (black arrows marked with an asterisk) developed into lobes over time (black arrows). Bars = 10 µm. (A) A wall with three bands of microtubules at day 1. Two bands on the left are part of a straight section of wall that starts to curve into two lobes by day 1 +7 h. The band of microtubules on the far right is associated with a lobe that is already growing. (B) This straight wall has two bands of microtubules that mark the sites where lobes start developing at day 1 +7 h. At day 2, another band of microtubules appears on the left and a new lobe is forming here on day 3. (C) A straight wall has two initial bands of microtubules. By day 1 +7 h, these two locations are becoming lobes while a new third band appears for the first time. A lobe forms at this third location by day 2. (D) A wall with bands of microtubules that met on either side of the anticlinal wall on day 1, 1 +7 h, and 2 changed little in shape from day 1 to 3.
Figure 6.
Figure 6.
Actin Filaments Do Not Strongly Associate with Either Side of Lobes during Development of Pavement Cells. The arrangement of actin filaments and cell wall growth in pavement cells of GFP-fABD2 seedlings from 1 to 3 d after germination. Fluorescence images are optical sections of the anticlinal wall at the middle of the cell and projections of serial sections of the cortical cytoplasm next to the outer periclinal wall. Thin-plate spline analysis predicts relative growth rates of the outer periclinal wall between consecutive time periods. (A) Filamentous actin in a representative pavement cell from 1 to 3 d after germination. On all days, actin filaments were distributed throughout the cortical cytoplasm. Bar = 20 μm. (B) Development of three lobes from a relatively straight wall (the boxed region in [A] at higher zoom). Relative growth rates in the outer periclinal wall were promoted on the concave side of forming lobes (white arrows) and were restricted on the convex side of lobes (black arrows). Bundles of actin filaments were at both the concave (black arrowheads) and convex (white arrowheads) side of lobes. Bar = 10 µm. (C) Fluorescence intensity of actin filaments at the anticlinal wall was measured at lobe tips (areas at lobes outlined in magenta) and other regions of the wall (areas between lobes outlined in green). Fluorescence intensity of the filaments was measured in the cortical cytoplasm adjacent to the periclinal wall (areas within the magenta boxes) on the concave and convex sides of lobes. Bar = 5 µm. (D) Average actin filament fluorescence intensities at lobes within cells, including the cell in (A), measured as in (C), are represented for each time point with standard errors. Statistically significant differences within a time point are denoted by an asterisk (P < 0.05, two-sample t test). Seven lobes were chosen per cell and one cell per plant. n = 5 plants at each time period.
Figure 7.
Figure 7.
Effect of Cytoskeletal Inhibitors on Pavement Cell Development. (A) Comparison of pavement cell development from 1 to 3 d after germination between control cells and cells treated with the cytoskeletal inhibitors, cytochalasin D or oryzalin, or their corresponding DMSO controls. For each cell, the top row of images shows anticlinal wall and lobe development, the middle row is a digital outline of the cell in which the cell area is colored, and the bottom row shows thin-plate spline analysis of differential growth in the periclinal cell walls between consecutive days. Bars = 50 µm. (B) Changes in the mean area, perimeter, circularity, number of lobes, and the fold change in the number of lobes per perimeter from control and inhibitor treated cells from day 1 to 3. Error bars are se of the mean and n = 4 cotyledons per treatment (with five cells from each cotyledon). Different letters represent statistically significant differences (P < 0.05, repeated measures ANOVA).

Comment in

References

    1. Ambrose C., Allard J.F., Cytrynbaum E.N., Wasteneys G.O. (2011). A CLASP-modulated cell edge barrier mechanism drives cell-wide cortical microtubule organization in Arabidopsis. Nat. Commun. 2: 430. - PMC - PubMed
    1. Ambrose J.C., Shoji T., Kotzer A.M., Pighin J.A., Wasteneys G.O. (2007). The Arabidopsis CLASP gene encodes a microtubule-associated protein involved in cell expansion and division. Plant Cell 19: 2763–2775. - PMC - PubMed
    1. Ambrose J.C., Wasteneys G.O. (2008). CLASP modulates microtubule-cortex interaction during self-organization of acentrosomal microtubules. Mol. Biol. Cell 19: 4730–4737. - PMC - PubMed
    1. Arganda-Carreras I., Fernández-González R., Muñoz-Barrutia A., Ortiz-De-Solorzano C. (2010). 3D reconstruction of histological sections: Application to mammary gland tissue. Microsc. Res. Tech. 73: 1019–1029. - PubMed
    1. Asl L.K., Dhondt S., Boudolf V., Beemster G.T.S., Beeckman T., Inzé D., Govaerts W., De Veylder L. (2011). Model-based analysis of Arabidopsis leaf epidermal cells reveals distinct division and expansion patterns for pavement and guard cells. Plant Physiol. 156: 2172–2183. - PMC - PubMed

Publication types

Substances

LinkOut - more resources