

Ultrasound-Propelled Nanocups for Drug Delivery
- PMID: 26296985
- PMCID: PMC4660885
- DOI: 10.1002/smll.201501322
Ultrasound-Propelled Nanocups for Drug Delivery
Abstract
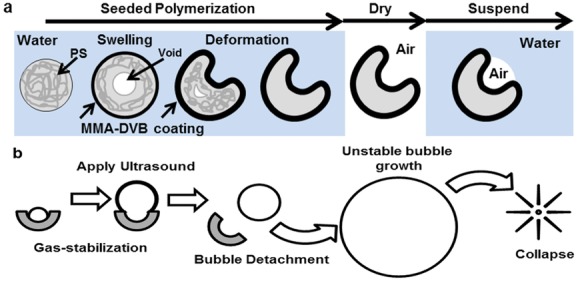
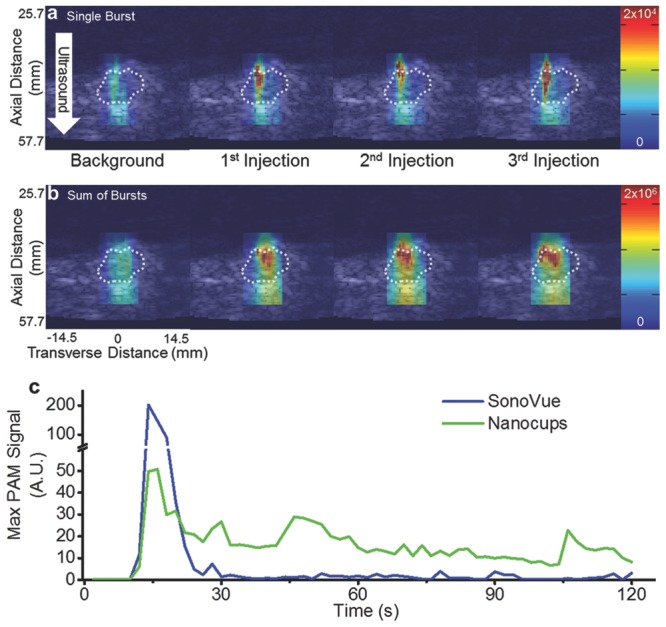
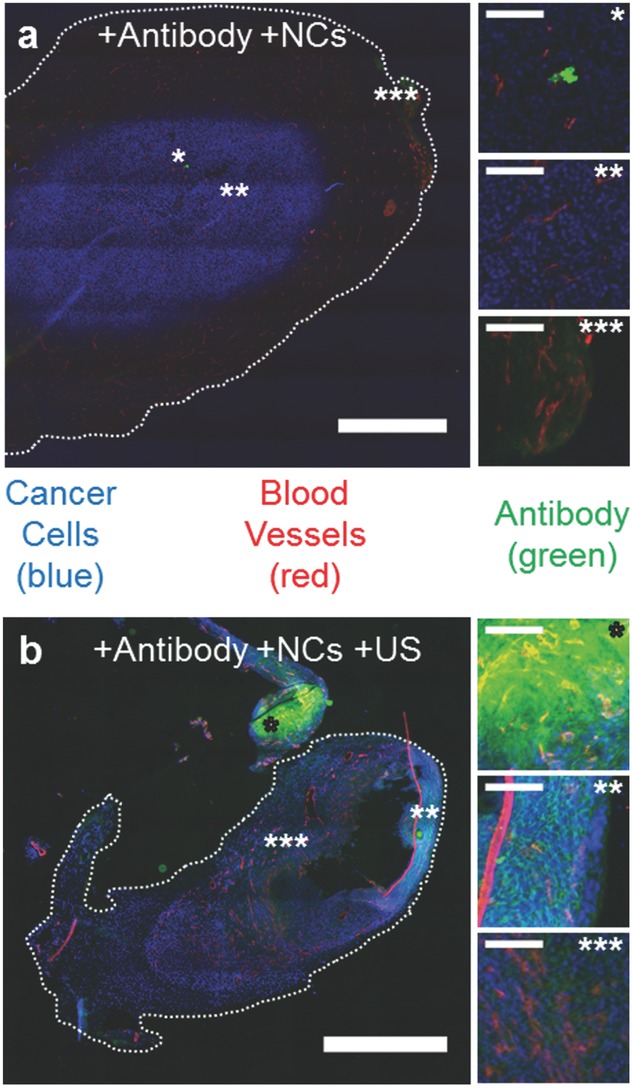
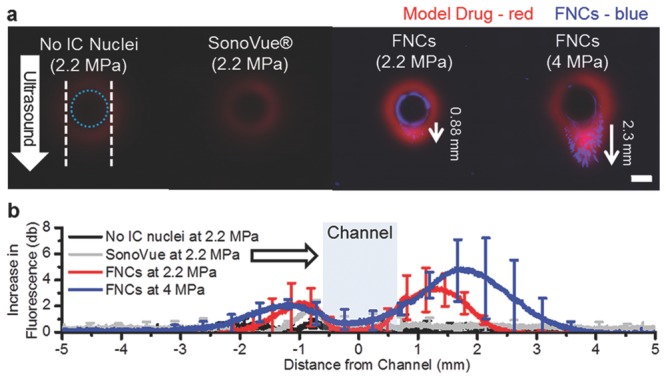
Ultrasound-induced bubble activity (cavitation) has been recently shown to actively transport and improve the distribution of therapeutic agents in tumors. However, existing cavitation-promoting agents are micron-sized and cannot sustain cavitation activity over prolonged time periods because they are rapidly destroyed upon ultrasound exposure. A novel ultrasound-responsive single-cavity polymeric nanoparticle (nanocup) capable of trapping and stabilizing gas against dissolution in the bloodstream is reported. Upon ultrasound exposure at frequencies and intensities achievable with existing diagnostic and therapeutic systems, nanocups initiate and sustain readily detectable cavitation activity for at least four times longer than existing microbubble constructs in an in vivo tumor model. As a proof-of-concept of their ability to enhance the delivery of unmodified therapeutics, intravenously injected nanocups are also found to improve the distribution of a freely circulating IgG mouse antibody when the tumor is exposed to ultrasound. Quantification of the delivery distance and concentration of both the nanocups and coadministered model therapeutic in an in vitro flow phantom shows that the ultrasound-propelled nanocups travel further than the model therapeutic, which is itself delivered to hundreds of microns from the vessel wall. Thus nanocups offer considerable potential for enhanced drug delivery and treatment monitoring in oncological and other biomedical applications.
Keywords: cancer therapy; cavitation; drug delivery; nanoparticles; ultrasound.
© 2015 WILEY-VCH Verlag GmbH & Co. KGaA, Weinheim.
Figures
Similar articles
-
Acoustic Cavitation-Mediated Delivery of Small Interfering Ribonucleic Acids with Phase-Shift Nano-Emulsions.Ultrasound Med Biol. 2015 Aug;41(8):2191-201. doi: 10.1016/j.ultrasmedbio.2015.04.002. Epub 2015 May 13. Ultrasound Med Biol. 2015. PMID: 25979417 Free PMC article.
-
A Novel Microbubble Capable of Ultrasound-Triggered Release of Drug-Loaded Nanoparticles.J Biomed Nanotechnol. 2016 Mar;12(3):516-24. doi: 10.1166/jbn.2016.2181. J Biomed Nanotechnol. 2016. PMID: 27280249
-
In Vitro Investigation of the Individual Contributions of Ultrasound-Induced Stable and Inertial Cavitation in Targeted Drug Delivery.Ultrasound Med Biol. 2015 Jul;41(7):1853-64. doi: 10.1016/j.ultrasmedbio.2015.03.016. Epub 2015 Apr 14. Ultrasound Med Biol. 2015. PMID: 25887690
-
Acoustically active liposome-nanobubble complexes for enhanced ultrasonic imaging and ultrasound-triggered drug delivery.Wiley Interdiscip Rev Nanomed Nanobiotechnol. 2014 May-Jun;6(3):316-25. doi: 10.1002/wnan.1255. Epub 2014 Jan 23. Wiley Interdiscip Rev Nanomed Nanobiotechnol. 2014. PMID: 24459007 Review.
-
Magnetic nanoparticle-based drug delivery for cancer therapy.Biochem Biophys Res Commun. 2015 Dec 18;468(3):463-70. doi: 10.1016/j.bbrc.2015.08.022. Epub 2015 Aug 10. Biochem Biophys Res Commun. 2015. PMID: 26271592 Review.
Cited by
-
Nanostructured TiO2 cavitation agents for dual-modal sonophotocatalysis with pulsed ultrasound.Ultrason Sonochem. 2021 May;73:105530. doi: 10.1016/j.ultsonch.2021.105530. Epub 2021 Mar 17. Ultrason Sonochem. 2021. PMID: 33799108 Free PMC article.
-
Polymeric materials for ultrasound imaging and therapy.Chem Sci. 2023 Oct 17;14(43):11941-11954. doi: 10.1039/d3sc04339h. eCollection 2023 Nov 8. Chem Sci. 2023. PMID: 37969594 Free PMC article. Review.
-
Recent Developments in Metallic Degradable Micromotors for Biomedical and Environmental Remediation Applications.Nanomicro Lett. 2023 Nov 30;16(1):41. doi: 10.1007/s40820-023-01259-3. Nanomicro Lett. 2023. PMID: 38032424 Free PMC article. Review.
-
Understanding Acoustic Cavitation Initiation by Porous Nanoparticles: Toward Nanoscale Agents for Ultrasound Imaging and Therapy.Chem Mater. 2016 Aug 23;28(16):5962-5972. doi: 10.1021/acs.chemmater.6b02634. Epub 2016 Aug 9. Chem Mater. 2016. PMID: 28484307 Free PMC article.
-
Overview of Therapeutic Ultrasound Applications and Safety Considerations: 2024 Update.J Ultrasound Med. 2025 Mar;44(3):381-433. doi: 10.1002/jum.16611. Epub 2024 Nov 11. J Ultrasound Med. 2025. PMID: 39526313 Free PMC article. Review.
References
Publication types
MeSH terms
Substances
Grants and funding
LinkOut - more resources
Full Text Sources
Other Literature Sources
Molecular Biology Databases
Research Materials
