Comparative Study
. 2015 Jul;18(5):673-81.
doi: 10.1016/j.jval.2015.03.1792. Epub 2015 Jun 11.

Extending Treatment Networks in Health Technology Assessment: How Far Should We Go?

Affiliations
Comparative Study

Extending Treatment Networks in Health Technology Assessment: How Far Should We Go?

Deborah M Caldwell et al. Value Health. 2015 Jul.

Abstract

Background: Network meta-analysis may require substantially more resources than does a standard systematic review. One frequently asked question is "how far should I extend the network and which treatments should I include?"

Objective: To explore the increase in precision from including additional evidence.

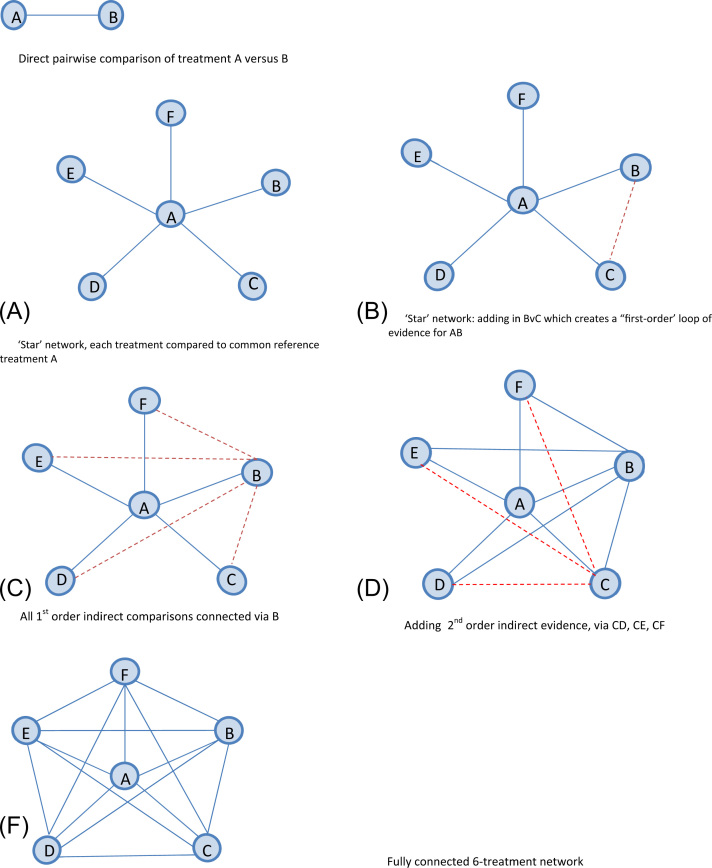
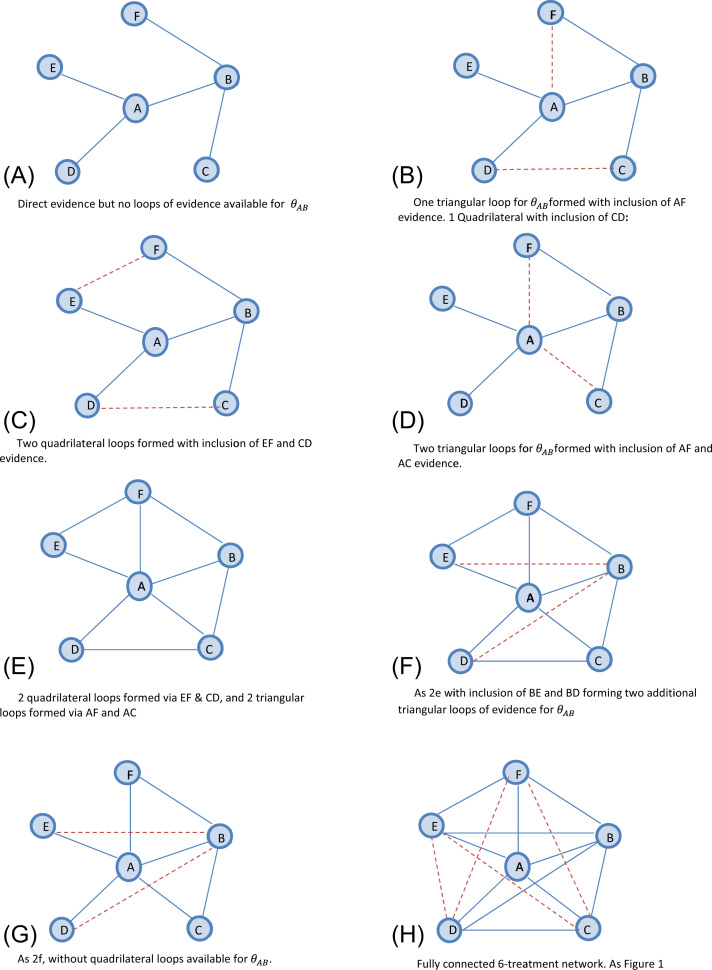
Methods: We assessed the benefit of extending treatment networks in terms of precision of effect estimates and examined how this depends on network structure and relative strength of additional evidence. We introduced a "star"-shaped network. Network complexity is increased by adding more evidence connecting treatments under five evidence scenarios. We also examined the impact of heterogeneity and absence of evidence facilitating a "first-order" indirect comparison.

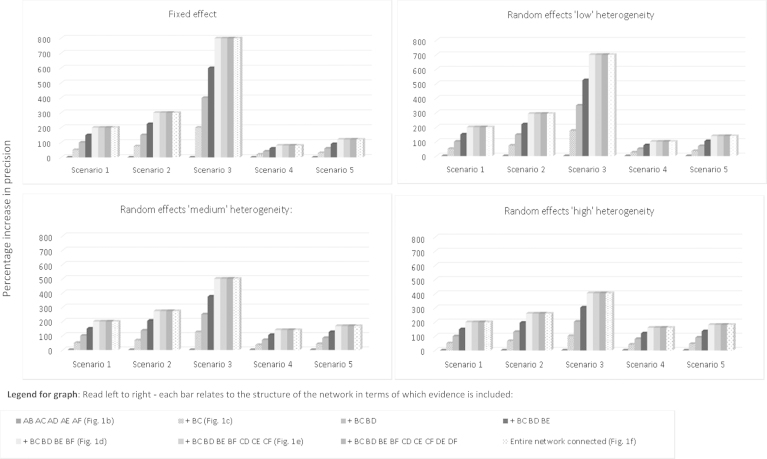
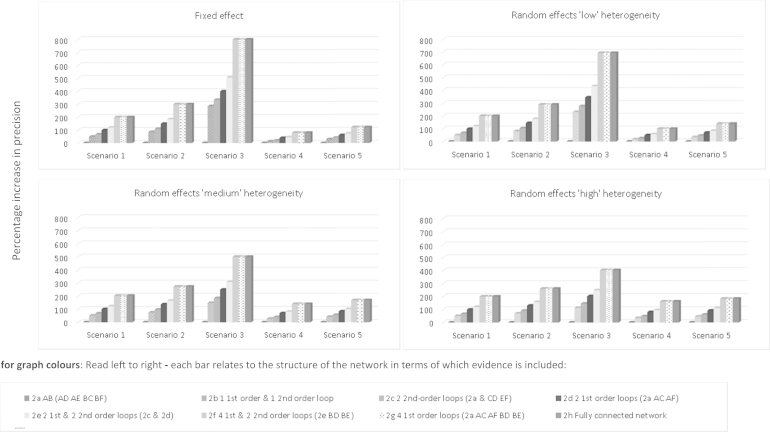
Results: In all scenarios, extending the network increased the precision of the A versus B treatment effect. Under a fixed-effect model, the increase in precision was modest when the existing direct A versus B evidence was already strong and was substantial when the direct evidence was weak. Under a random-effects model, the gain in precision was lower when heterogeneity was high. When evidence is available for all "first-order" indirect comparisons, including second-order evidence has limited benefit for the precision of the A versus B estimate. This is interpreted as a "ceiling effect."

Conclusions: Including additional evidence increases the precision of a "focal" treatment comparison of interest. Once the comparison of interest is connected to all others via "first-order" indirect evidence, there is no additional benefit in including higher order comparisons. This conclusion is generalizable to any number of treatment comparisons, which would then all be considered "focal." The increase in precision is modest when direct evidence is already strong, or there is a high degree of heterogeneity.

Keywords: comparative effectiveness; health technology assessment; literature searching; mixed treatment comparisons; network meta-analysis; systematic review.


Figures

Fig. 1
Fig. 1
Graphical representation of the star network and approach to connecting the network under the assumption of all available evidence. The solid blue line indicates existing evidence. The dotted red line indicates evidence added at each step of extension. (A) Direct pairwise comparison of treatment A versus B. (B) “Star” network, each treatment compared with common reference treatment A. (C) “Star” network: adding in B vs. C, which creates a “first-order” loop of evidence for AB. (D) All first-order indirect comparisons connected via B. (E) Adding second-order indirect evidence, via CD, CE, and CF. (F) Fully connected six-treatment network.
Fig. 2
Fig. 2
Graphical representation of network and approach to connecting the network under assumption of missing first-order indirect evidence. The solid blue line indicates existing evidence. The dotted red line indicates evidence added at each step of extension. (A) Direct evidence but no loops of evidence available for θAB. (B) One triangular loop for θAB formed with the inclusion of AF evidence. One quadrilateral with the inclusion of CD. (C) Two quadrilateral loops formed with the inclusion of EF and CD evidence. (D) Two triangular loops forθAB formed with the inclusion of AF and AC evidence. (E) Two quadrilateral loops formed via EF and CD, and two triangular loops formed via AF and AC. (F) As 2E with the inclusion of BE and BD forming two additional triangular loops of evidence for θAB. (G) As 2F, without quadrilateral loops available for θAB. (H) Fully connected six-treatment network. As Figure 1.
Fig. 3
Fig. 3
Star network with six treatments for all available evidence. Comparison of percentage increase in precision (y-axis) for treatment contrast A vs. B from expanding the network of treatments under five separate scenarios over that achieved from a standard, pairwise meta-analysis. Scenarios considered under fixed- and random-effects models. Random-effects models assume “low,” “medium,” and “high” levels of heterogeneity as defined in the main text. The height of each bar denotes the percentage increase in the precision of A vs. B treatment effect estimate from a network meta-analysis (NMA). The horizontal axis reports each increasing level of the network under each of the five scenarios. Read left to rightEach bar relates to the structure of the network in terms of which evidence is included. Scenario 1: “One trial per comparison”: Equal variance across the network. Each comparison XY represents one meta-analysis with variance equal to 1. Scenario 2: “AB weakest link, IC trials weaker”: AB comparison is the “weakest” link, with the comparisons forming ICs being weaker. Scenario 3: “AB weakest link, IC trials strong”: AB comparison is the “weakest” link, with the comparisons forming ICs being stronger. Scenario 4: “AB strongest link, IC trials weaker”: AB comparison is the “strongest” link, with the comparisons forming ICs being weaker. Scenario 5: “AB strongest link, IC trials strong”: AB comparison is the “strongest” link, with the comparisons forming ICs also being strong. IC, indirect comparisons.
Fig. 4
Fig. 4
Star network with six treatments when first-order indirect evidence is unavailable. Comparison of percentage increase in precision (y-axis) for treatment contrast A vs. B from expanding network of treatments under five separate scenarios over that achieved from a standard, pairwise meta-analysis. Scenarios considered under fixed- and random-effects models. Random-effects models assume “low,” “medium,” and “high” levels of heterogeneity as defined in the main text. The height of each bar denotes the percentage increase in precision of A vs. B treatment effect estimate from a network meta-analysis (NMA). The horizontal axis reports each increasing level of the network under each of the five scenarios. For graph colors: Read left to rightEach bar relates to the structure of the network in terms of which evidence is included. Scenario 1: “One trial per comparison”: Equal variance across the network. Each comparison XY represents one meta-analysis with variance equal to 1. Scenario 2: “AB weakest link, IC trials weaker”: AB comparison is the “weakest” link, with the comparisons forming ICs being weaker. Scenario 3: “AB weakest link, IC trials strong”: AB comparison is the “weakest” link, with the comparisons forming ICs being stronger. Scenario 4: “AB strongest link, IC trials weaker”: AB comparison is the “strongest” link, with the comparisons forming ICs being weaker. Scenario 5: “AB strongest link, IC trials strong”: AB comparison is the “strongest” link, with the comparisons forming ICs also being strong. IC, indirect comparision.

References

    1. Dias S., Sutton A.J., Ades A.E., Welton N.J. Evidence synthesis for decision making 2: a generalized linear modeling framework for pairwise and network meta-analysis of randomized controlled trials. Med Decis Making. 2013;33:607–617. - PMC - PubMed
    1. National Institute for Health and Care ExcelAU: Provide place of publication for reference 2.lence Aripiprazole for Treating Moderate to Severe Manic Episodes in Adolescents with Bipolar I Disorder. NICE technology appraisal guidance. National Institute for Health and Care Excellence. 2013
    1. Jefferson T. Ranking antidepressants. Lancet. 2009;373:1759. - PubMed
    1. Turner E., Moreno S.G., Sutton A.J. Ranking antidepressants. Lancet. 2009;373:1760. - PubMed
    1. Salanti G., Kavvoura F.K., Ioannidis J.P.A. Exploring the geometry of treatment networks. Ann Intern Med. 2008;148:544–553. - PubMed

Publication types

MeSH terms

LinkOut - more resources