. 2015 Oct;169(2):1382-96.
doi: 10.1104/pp.15.00276. Epub 2015 Aug 21.

Drought Induces Distinct Growth Response, Protection, and Recovery Mechanisms in the Maize Leaf Growth Zone

Affiliations

Drought Induces Distinct Growth Response, Protection, and Recovery Mechanisms in the Maize Leaf Growth Zone

Viktoriya Avramova et al. Plant Physiol. 2015 Oct.

Abstract

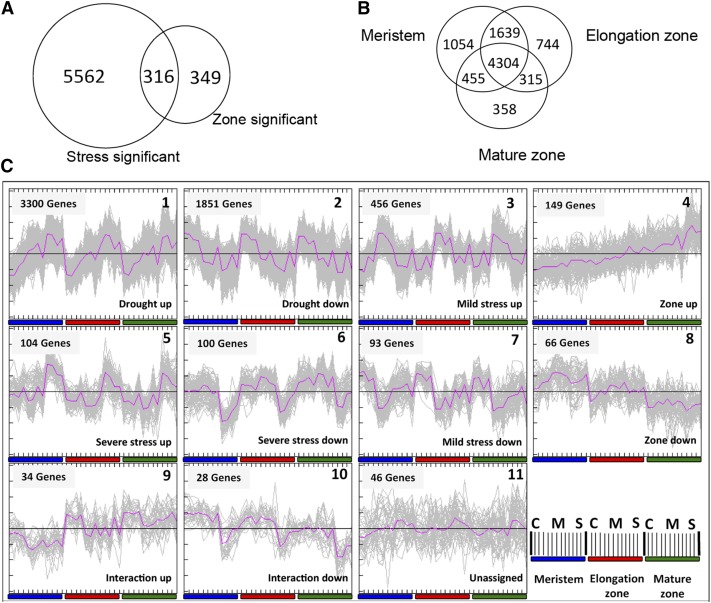
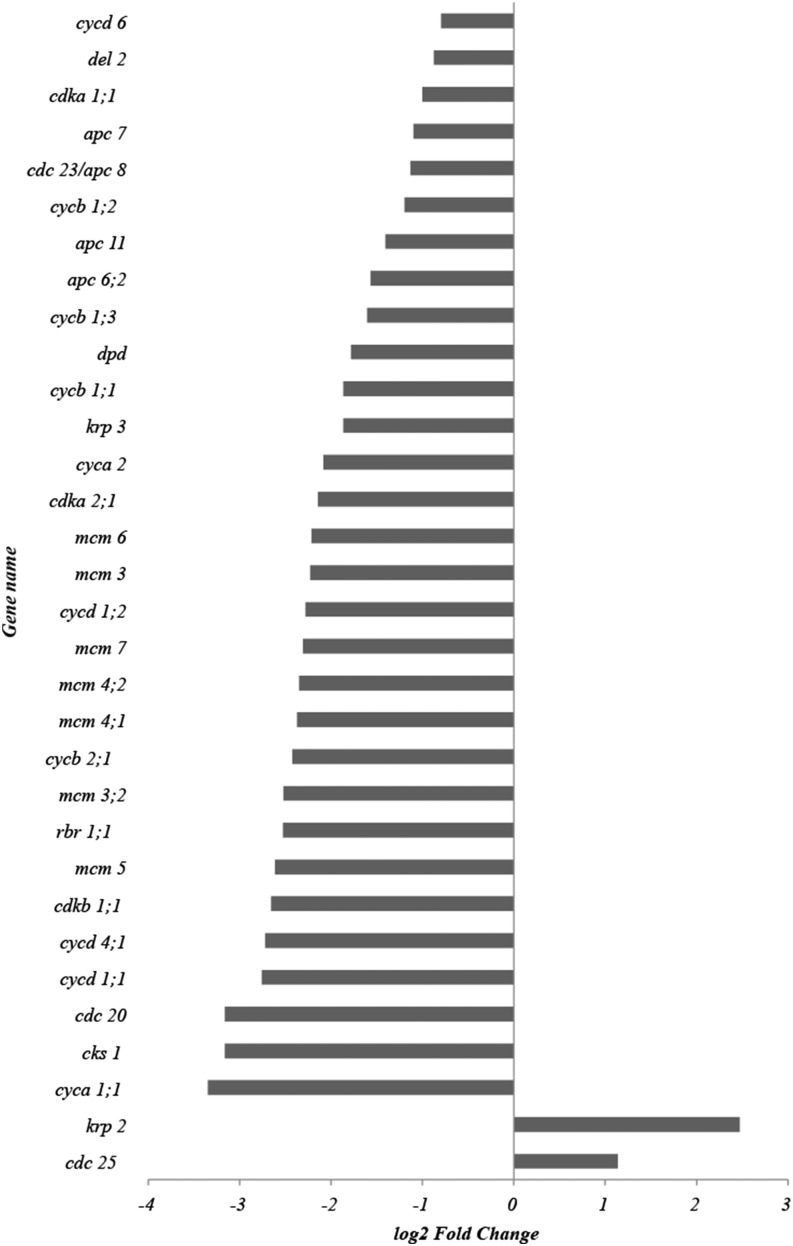
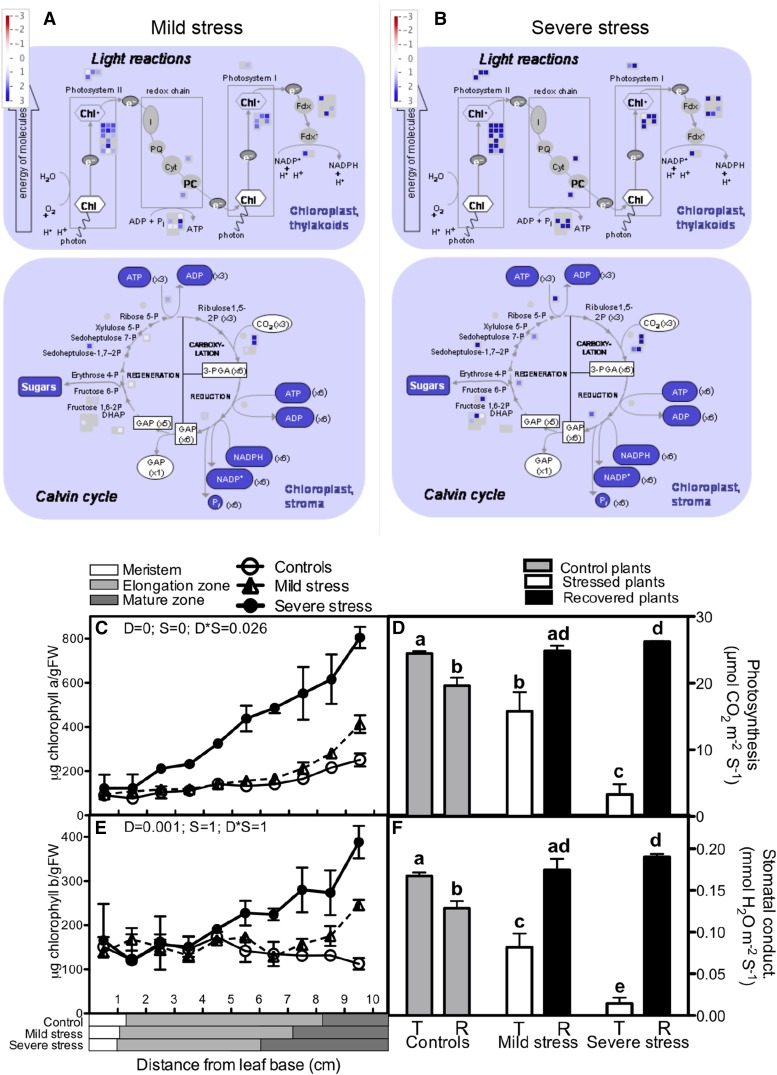
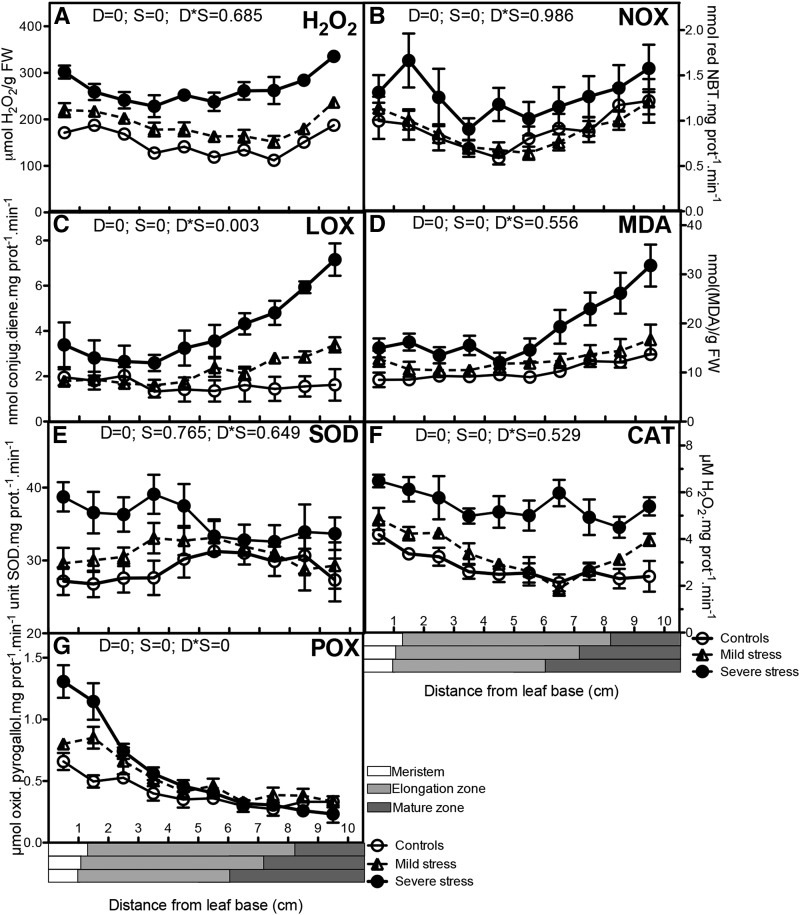
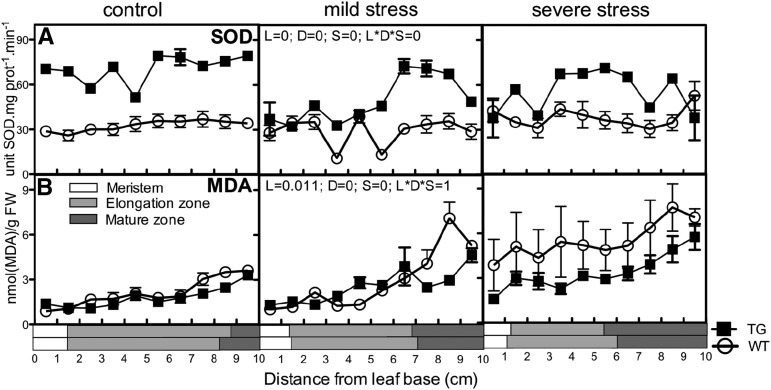
Drought is the most important crop yield-limiting factor, and detailed knowledge of its impact on plant growth regulation is crucial. The maize (Zea mays) leaf growth zone offers unique possibilities for studying the spatiotemporal regulation of developmental processes by transcriptional analyses and methods that require more material, such as metabolite and enzyme activity measurements. By means of a kinematic analysis, we show that drought inhibits maize leaf growth by inhibiting cell division in the meristem and cell expansion in the elongation zone. Through a microarray study, we observed the down-regulation of 32 of the 54 cell cycle genes, providing a basis for the inhibited cell division. We also found evidence for an up-regulation of the photosynthetic machinery and the antioxidant and redox systems. This was confirmed by increased chlorophyll content in mature cells and increased activity of antioxidant enzymes and metabolite levels across the growth zone, respectively. We demonstrate the functional significance of the identified transcriptional reprogramming by showing that increasing the antioxidant capacity in the proliferation zone, by overexpression of the Arabidopsis (Arabidopsis thaliana) iron-superoxide dismutase gene, increases leaf growth rate by stimulating cell division. We also show that the increased photosynthetic capacity leads to enhanced photosynthesis upon rewatering, facilitating the often-observed growth compensation.


Figures

Figure 1.
Figure 1.
Gene expression analysis in the growth zone in response to drought. A, Overview of the 6,227 significant (two-way ANOVA with Bonferroni correction for the stress and an FDR correction for the zone effect; P < 0.05 and log2FC > 0.75) gene transcripts on the microarray. B, Overview of the transcripts changed significantly in response to drought stress in each developmental zone (meristem, elongation, and mature) along the leaf axis (three independent one-way ANOVAs with FDR correction; P < 0.05 and log2FC > 0.75). C, Clustering of gene expression profiles by quality threshold clustering analysis (Heyer et al., 1999; Pearson correlation measure; cluster diameter = 0.5 and minimum cluster population = 20) of the expression profiles of 6,227 significantly modulated genes (P < 0.05 and log2FC > 0.75). The abscissa, which is enlarged for cluster 8, denotes three stress treatments (C = control, M = mild, and S = severe stress) for each zone (meristem, elongation, and mature) and four biological replicates (each one a pool of four plants) for each zone/treatment combination. The ordinate indicates normalized and median-centered expression levels. The colored bars show the corresponding growth phases based on the kinematic analysis (Supplemental Fig. S2).
Figure 2.
Figure 2.
Effect of drought stress on cell cycle gene expression in the meristem. Presented are fold change values of the 34 of 57 cell cycle genes present on the array (for the full list of cell cycle genes, see Supplemental Table S2) that have significantly affected expression levels (log2FC > 0.75 and P < 0.05, two-way ANOVA with Bonferroni correction) under drought conditions.
Figure 3.
Figure 3.
Changes in the photosynthetic machinery in the growth zone of the maize leaf under mild and severe drought stress. A and B, Transcript abundance of photosynthesis-related genes (log2FC) under mild (A) and severe (B) drought stress. Chl, Chlorophyll; I, pheophytin; PQ, plastoquinone; Cyt, cytochrome; PC, plastocyanin; FDX, ferredoxin; GAP, glyceraldehyde 3-phosphate; PGA, 3-phosphoglycerate; DHAP, dihydroxyacetone. C and E, Chlorophyll a (C) and chlorophyll b (E) content across the leaf axis in well-watered and stressed plants (a two-way ANOVA was used as a statistical test and P values for the two factors, drought [D] and segment [S], as well as the interaction between them [D*S]). Data are averages ± se (n = 3). The length of each developmental zone (meristem, elongation, and mature) is marked on the x axis for each treatment (control, mild, and severe stress) according to Supplemental Figure S2. FW, Fresh weight. D and F, Rates of photosynthesis (D) and stomatal conductance (F) before and after recovery of the stressed plants (T = treatment and R = recovery). Unstressed plants of the same age as the plants that were subjected to stress and allowed to recover were included as a control for ontogenetic differences. Student’s t test was used for statistical analysis, and significant differences (P < 0.05) are marked with different letters. Data are averages ± se (n = 5).
Figure 4.
Figure 4.
Oxidative stress determinants and main antioxidant enzymes. Well-watered control plants were compared with mildly and severely stressed plants. Metabolite concentrations and enzyme activities were determined in each 1 cm of the leaf growth zone: H2O2 contents (A), NOX activity (B), LOX activity (C), malondialdehyde (MDA) contents (D), SOD activity (E), CAT activity (F), and POX activity (G). A two-way ANOVA was used as a statistical test, and P values for the two factors, drought (D) and segment (S), as well as the interaction between them (D*S), are presented. Data are averages ± se (n = 5). The length of each developmental zone (meristem, elongation, and mature) in each treatment (control, mild, and severe stress) is marked on the x axes of the graphs according to Supplemental Figure S2. FW, Fresh weight; NBT, nitroblue tetrazolium.
Figure 5.
Figure 5.
SOD activity and MDA levels in the leaf growth zone of the P35S:ATFeSOD line and its wild type. Biochemical determination of SOD activity (A) and MDA levels (B) was done in the growing zone of maize leaves from control (well-watered) plants and plants exposed to mild and severe water stress, comparing wild-type (WT) and 35S-AtFESOD transgenic (TG) lines. A three-way ANOVA was used as a statistical test, and P values for the three factors, line (L), drought (D), and segment (S), as well as the interaction between them (L*D*S), are present on the middle graph for each band. Data are averages ± se (n = 3). The length of each developmental zone (meristem, elongation, and mature) is marked on the x axes of the graphs for each line (wild type and transgenic). FW, Fresh weight.

References

    1. Aebi H. (1984) Catalase in vitro. Methods Enzymol 105: 121–126 - PubMed
    1. Aparicio OM, Weinstein DM, Bell SP (1997) Components and dynamics of DNA replication complexes in S. cerevisiae: redistribution of MCM proteins and Cdc45p during S phase. Cell 91: 59–69 - PubMed
    1. Ashghizadeh HR, Ehsanzadeh P (2008) Maize (Zea maize L.) performance under drought: decreased photosynthetic area vs. decreased efficiency of PSII. In Allen JF, Gantt E, Golbeck JH, Osmond B, eds, Photosynthesis: Energy from the Sun: 14th International Congress on Photosynthesis. Springer, Dordrecht, The Netherlands, pp 1445–1449
    1. Axelrod B, Cheesbrough TM, Laakso S (1981) Lipoxygenase from soybeans: EC 1.13.11.12 linoleate:oxygen oxidoreductase. Methods Enzymol 71: 441–451
    1. Beemster GTS, De Veylder L, Vercruysse S, West G, Rombaut D, Van Hummelen P, Galichet A, Gruissem W, Inzé D, Vuylsteke M (2005) Genome-wide analysis of gene expression profiles associated with cell cycle transitions in growing organs of Arabidopsis. Plant Physiol 138: 734–743 - PMC - PubMed

Publication types

MeSH terms

Substances