. 2015 Aug 22:14:114.
doi: 10.1186/s12933-015-0278-0.

Short-term high glucose exposure impairs insulin signaling in endothelial cells

Affiliations

Short-term high glucose exposure impairs insulin signaling in endothelial cells

Valeria De Nigris et al. Cardiovasc Diabetol. .

Abstract

Background: Hyperglycemia is the hallmark of diabetes and its cardiovascular complications. Insulin plays an important role in the regulation of vascular homeostasis and maintenance of endothelial function. Insulin signaling occurs after binding to the insulin receptor, causing activation of two separate and parallel pathways: PI3K/AKT/eNOS and Ras/Raf/MAPK pathways. AKT phosphorylates eNOS at Ser1177, resulting in increased nitric oxide production and vasodilation. The MAPK pathway results in endothelin-1 production and vasoconstriction and mitogenic effects.

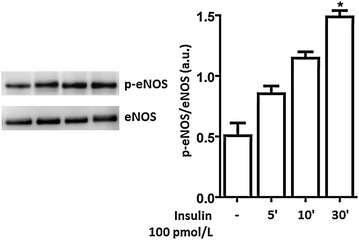
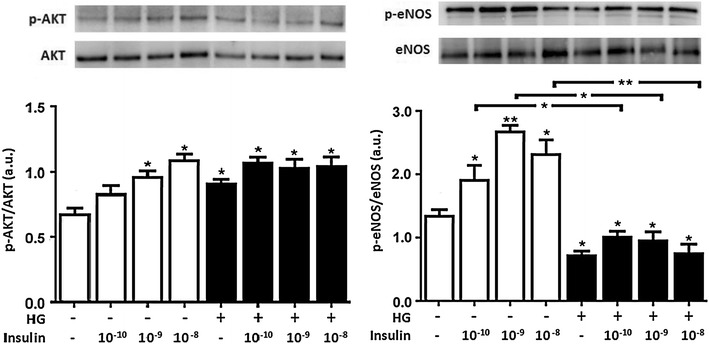
Methods: We studied the effects of physiological insulin treatment in human umbilical vein endothelial cells (HUVECs) on the two pathways under high glucose conditions, which mimic the in vivo condition of hyperglycemia. HUVECs were incubated with insulin at different physiological concentrations (from 10(-10) to 10(-8) M) for 30 min after 24 h of exposition to normal (5 mmol/L, NG) or high glucose (25 mmol/L, HG). Phosphorylated forms of AKT, eNOS, ERK1/2, p38, JNK and insulin receptor-β subunit (IRβ) were evaluated.

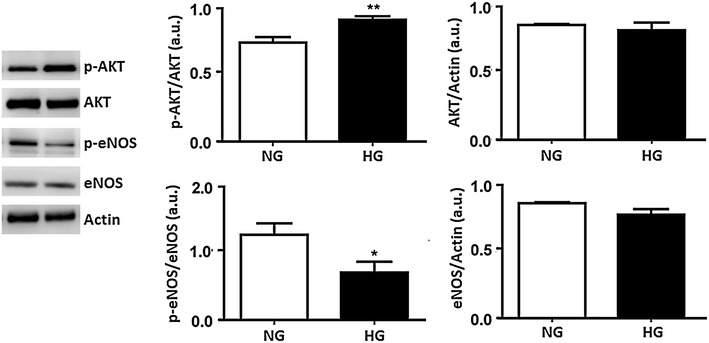
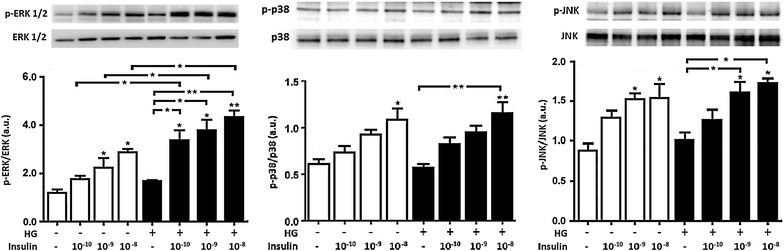
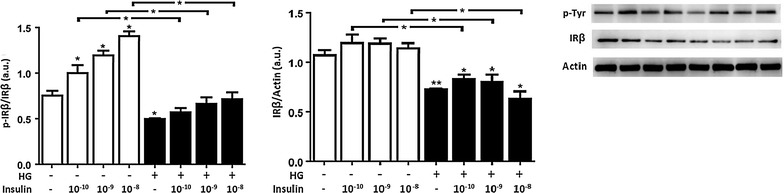
Results: In normal glucose, the active phosphorylated forms of AKT, eNOS, ERK1/2, p38 and JNK were increased in insulin treated cells, in a dose-dependent manner. In high glucose, insulin was not able to activate the PI3K/AKT/eNOS pathway, with the phosphorylated form of eNOS reduced with respect to the control. However, insulin was able to induce the up-regulation of phospho-ERK1/2, -p38 and -JNK. Moreover, we found reduced levels of IRβ phosphorylated form in high glucose as compared to the control. Insulin was able to increase phospho-IRβ in normal glucose but not in high glucose, in which the total protein levels remained reduced.

Conclusions: Exposure to short-term high glucose negatively affects insulin signaling even when physiological insulin concentrations are added. The impairment of the PI3K/AKT/eNOS pathway after physiological insulin treatment could contribute to detrimental effects on cardiovascular homeostasis under high glucose conditions, and might shift toward the activation of certain mitogenic effectors, such as ERK1/2, p38 and JNK, the only ones that respond to physiological insulin treatment in high glucose.


Figures

Fig. 1
Fig. 1
Administration of high glucose for 24 h enhanced phosphor-Ser473AKT and attenuated phospho-Ser1177eNOS in HUVECs. Whole cell lysates were prepared from confluent HUVECs exposed to 5 mmol/L (NG) or 25 mmol/L (HG) glucose for 24 h. AKT and eNOS phosphorylations were assayed for Western Blot analysis. The panels show representative images of different independent experiments. Densitometric values were normalized to total amounts of AKT and eNOS, respectively. *P < 0.05, **P < 0.01 HG vs. NG. Bars represent mean ± SEM for five independent experiments
Fig. 2
Fig. 2
Insulin 100 pmol/L slightly increased phospho-Ser1177eNOS at 5 and 10 min, with its major effect occurring at 30 min. HUVECs were treated with 100 pmol/L insulin at different time points: 5, 10 and 30 min. Whole cell lysates were prepared for Western Blot analysis. The panels show representative images of different independent experiments. Densitometric values were normalized to total eNOS. Bars represent mean ± SEM for five independent experiments. *P < 0.05 NG with insulin 100 pmol/L vs. NG w/o insulin treatment
Fig. 3
Fig. 3
Insulin administration enhanced AKT and eNOS phosphorylation in NG in a concentration-dependent manner, but had no effects in HG in HUVECs. Confluent HUVECs were exposed to 5 mmol/L (NG) or 25 mmol/L (HG) glucose for 24 h. During the last 30 min HUVECs were treated with different physiological concentrations of insulin: 10−10 M = 100 pmol/L, 10−9 M = 10 nmol/L and 10−8 M = 1 nmol/L. Whole cell lysates were prepared for immunoblot analysis of AKT and eNOS phosphorylation. The panels show representative images of different independent experiments. Densitometric values were normalized to total amounts of AKT and eNOS, respectively. Bars represent mean ± SEM for five independent experiments. *P < 0.05, **P < 0.01 HG vs. NG
Fig. 4
Fig. 4
Administration of high glucose for 24 h had no effects on ERK1/2, p38 and JNK phosphorylations in HUVECs; however, insulin administration increased them under NG and HG conditions. Confluent HUVECs were exposed to 5 mmol/L (NG) or 25 mmol/L (HG) of glucose for 24 h. During the last 30 min, HUVECs were treated with different physiological concentrations of insulin, and whole cell lysates were prepared for Western Blot analysis. The panels show representative images of different independent experiments. Densitometric values were normalized to total amounts of ERK1/2, p38 and JNK, respectively. Bars represent mean ± SEM for five independent experiments. *P < 0.05, **P < 0.01 HG vs. NG
Fig. 5
Fig. 5
Administration of high glucose for 24 h attenuated IRβ total expression and its phosphorylated form in HUVECs. Physiological insulin increased IRβ tyrosine phosphorylation only for the condition of NG. Previously exposed to 24 h of 5 mmol/L (NG) or 25 mmol/L (HG) of glucose, cells were stimulated with different insulin concentrations for 30 min. Whole cell lysates were prepared for immunoblot analysis of the phosphorylated form of IRβ and the total amount of IRβ protein. The panels show representative images of different independent experiments. Densitometric values were normalized to total amounts of IRβ and actin, as indicated. Bars represent mean ± SEM for five independent experiments. *P < 0.05, **P < 0.01 HG vs. NG

References

    1. Brownlee M. Biochemistry and molecular cell biology of diabetic complications. Nature. 2001;414:813–820. doi: 10.1038/414813a. - DOI - PubMed
    1. Tabit CE, Chung WB, Hamburg NM, Vita JA. Endothelial dysfunction in diabetes mellitus: molecular mechanisms and clinical implications. Rev Endocr Metab Disord. 2010;11:61–74. doi: 10.1007/s11154-010-9134-4. - DOI - PMC - PubMed
    1. Van den Oever IAM, Raterman HG, Nurmohamed MT, Simsek S. Endothelial dysfunction, inflammation, and apoptosis in diabetes mellitus. Mediat Inflamm. 2010;2010:792393–792408. - PMC - PubMed
    1. Kim J, Montagnani M, Koh KK, Quon MJ. Reciprocal relationships between insulin resistance and endothelial dysfunction: molecular and pathophysiological mechanisms. Circulation. 2006;113:1888–1904. doi: 10.1161/CIRCULATIONAHA.105.563213. - DOI - PubMed
    1. Nystrom FH, Quon M. Insulin signalling: metabolic pathways and mechanisms for specificity. Cell Signal. 1999;11:563–574. doi: 10.1016/S0898-6568(99)00025-X. - DOI - PubMed

MeSH terms