. 2015 Oct 1;195(7):3237-47.
doi: 10.4049/jimmunol.1402701. Epub 2015 Aug 21.

Decreased T Follicular Regulatory Cell/T Follicular Helper Cell (TFH) in Simian Immunodeficiency Virus-Infected Rhesus Macaques May Contribute to Accumulation of TFH in Chronic Infection

Affiliations

Decreased T Follicular Regulatory Cell/T Follicular Helper Cell (TFH) in Simian Immunodeficiency Virus-Infected Rhesus Macaques May Contribute to Accumulation of TFH in Chronic Infection

Ankita Chowdhury et al. J Immunol. .

Erratum in

Abstract

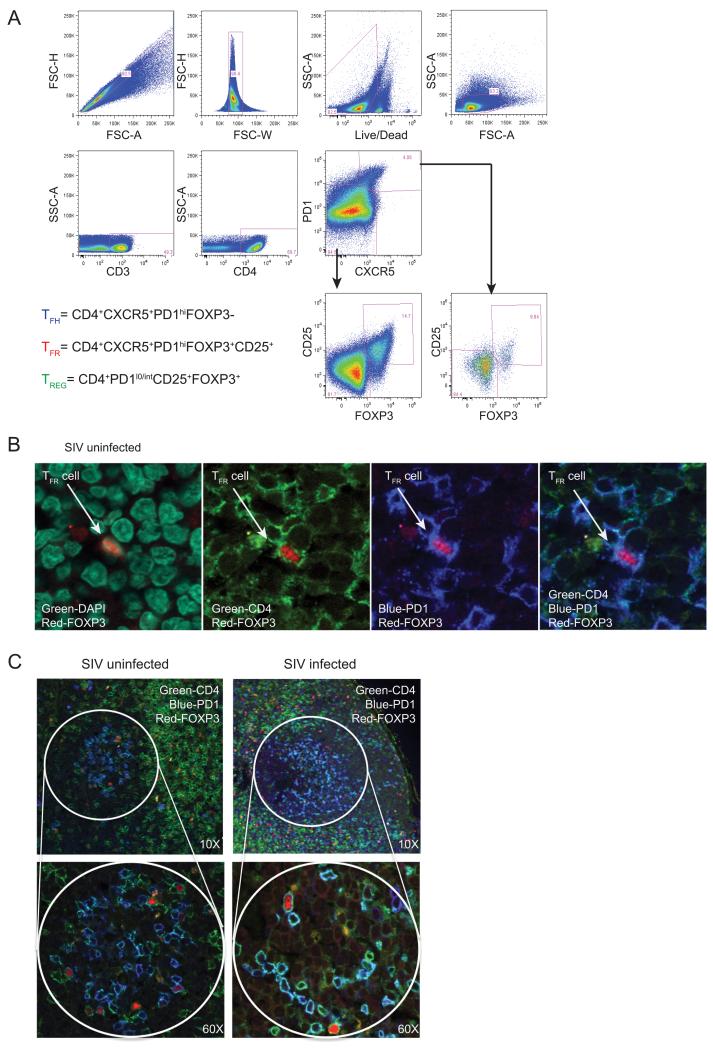
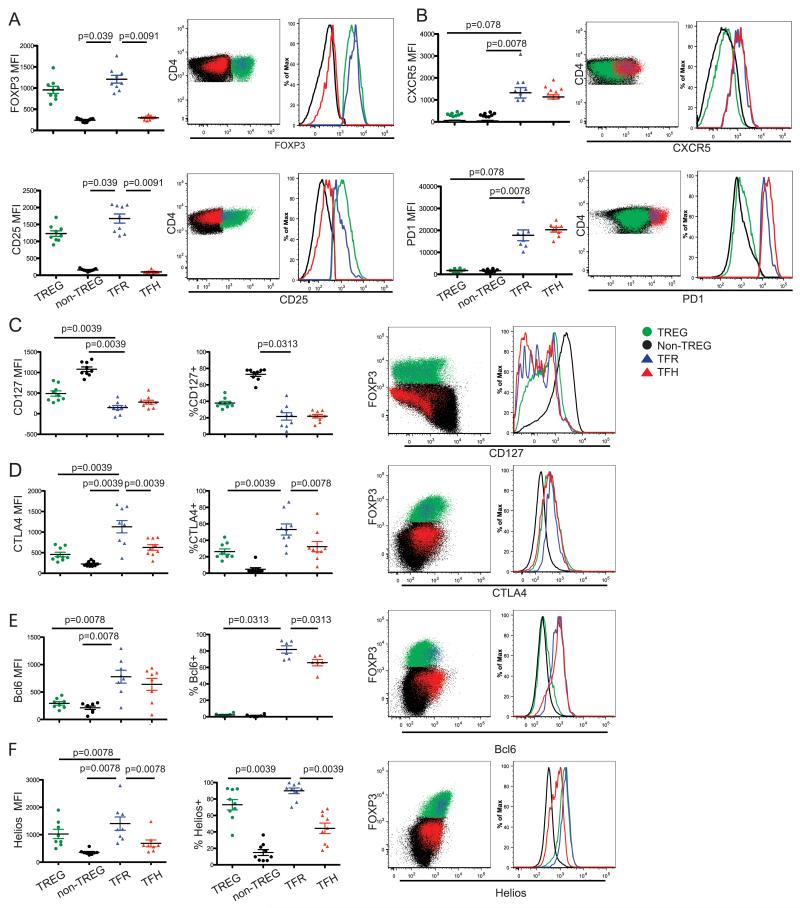
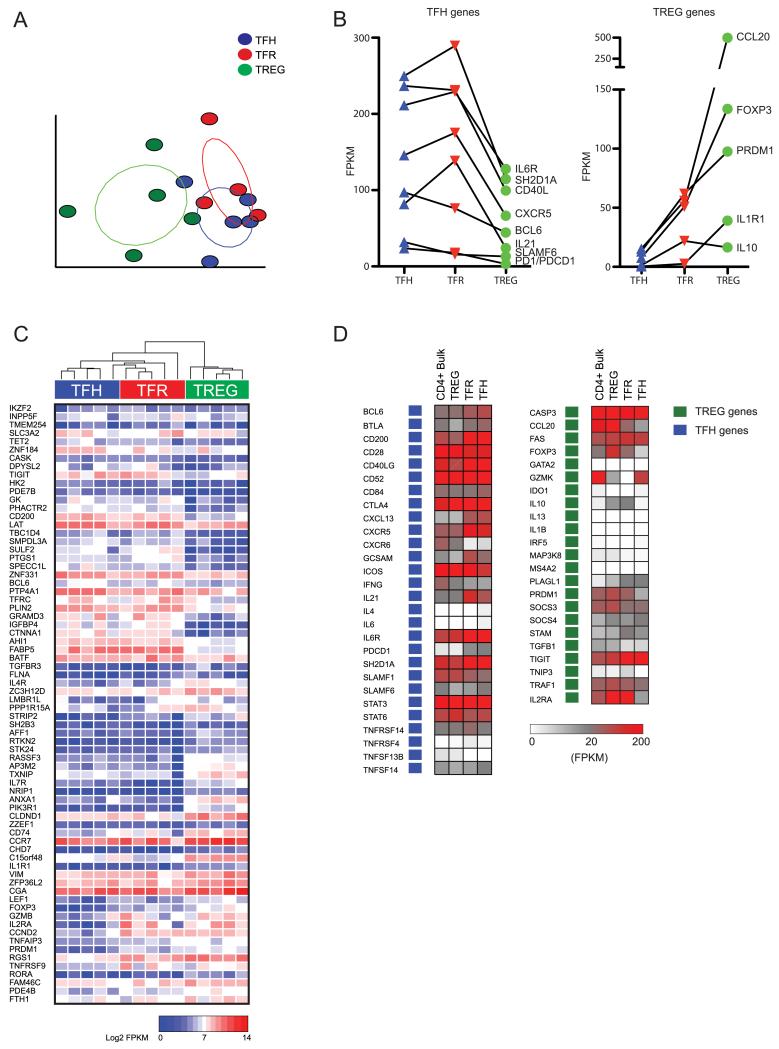
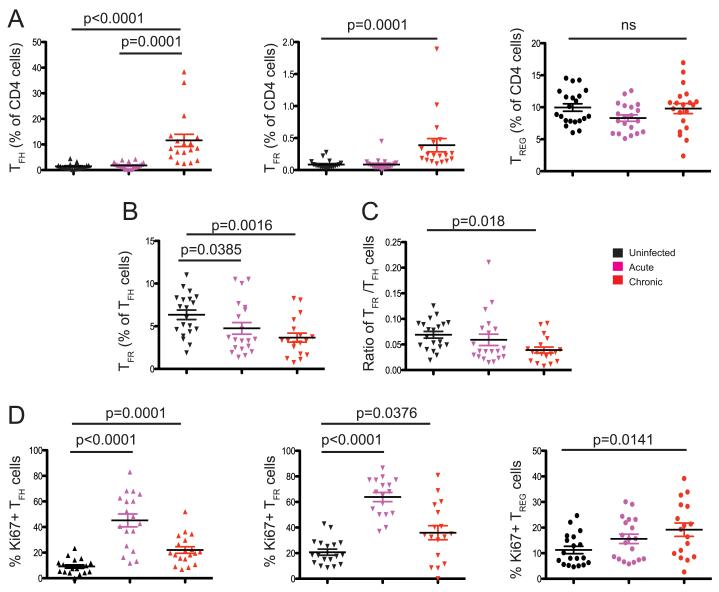
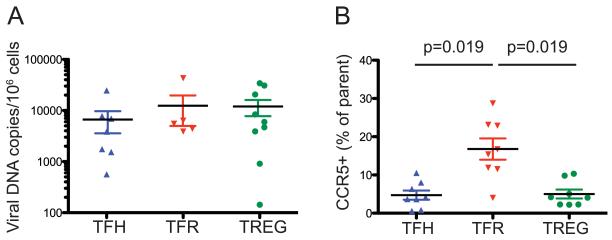
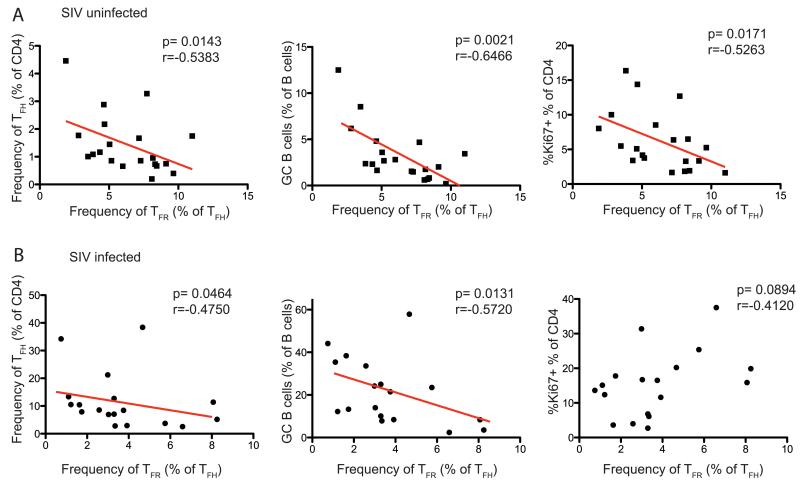
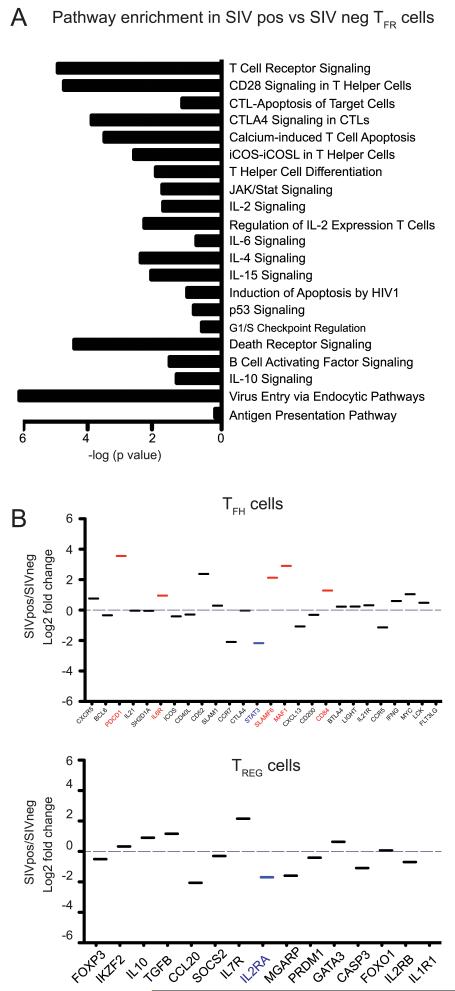
T follicular helper cells (TFH) are critical for the development and maintenance of germinal center (GC) and humoral immune responses. During chronic HIV/SIV infection, TFH accumulate, possibly as a result of Ag persistence. The HIV/SIV-associated TFH expansion may also reflect lack of regulation by suppressive follicular regulatory CD4(+) T cells (TFR). TFR are natural regulatory T cells (TREG) that migrate into the follicle and, similar to TFH, upregulate CXCR5, Bcl-6, and PD1. In this study, we identified TFR as CD4(+)CD25(+)FOXP3(+)CXCR5(+)PD1(hi)Bcl-6(+) within lymph nodes of rhesus macaques (RM) and confirmed their localization within the GC by immunohistochemistry. RNA sequencing showed that TFR exhibit a distinct transcriptional profile with shared features of both TFH and TREG, including intermediate expression of FOXP3, Bcl-6, PRDM1, IL-10, and IL-21. In healthy, SIV-uninfected RM, we observed a negative correlation between frequencies of TFR and both TFH and GC B cells, as well as levels of CD4(+) T cell proliferation. Post SIV infection, the TFR/TFH ratio was reduced with no change in the frequency of TREG or TFR within the total CD4(+) T cell pool. Finally, we examined whether higher levels of direct virus infection of TFR were responsible for their relative depletion post SIV infection. We found that TFH, TFR, and TREG sorted from SIV-infected RM harbor comparable levels of cell-associated viral DNA. Our data suggest that TFR may contribute to the regulation and proliferation of TFH and GC B cells in vivo and that a decreased TFR/TFH ratio in chronic SIV infection may lead to unchecked expansion of both TFH and GC B cells.


Figures

Figure 1
Figure 1. TFR can be defined by flow cytometry and identified by confocal microscopy within the germinal centers of RM
(A) Representative flow cytometry plot of lymphocytes from lymph nodes of untreated uninfected RM showing the gating strategy used to define TFR, TFH and TREG cell populations. (B) Representative confocal microscope image showing a single TFR within the lymph node of an uninfected RM. The first image shows staining for DAPI (green) and FoxP3 (red). The second image shows the same section with CD4 (green) and FoxP3 (red), the third PD1 (blue) and FoxP3 (red) and the last image CD4 (green), PD1 (blue) and FoxP3 (red). (C) Representative images of lymph node biopsies from SIV uninfected and acutely infected RM showing cells stained with CD4 (green), FoxP3 (red) and PD1 (blue) within the GC regions.
Figure 2
Figure 2. TFR share immunophenotypical features of both TFH and TREG populations
Mean fluorescence intensity, percent positive, representative flow cytometry plots and histograms (Panels A, B, C, D, E, F) for expression of various immunophenotypical markers (i.e., FoxP3, CD25, CXCR5, PD-1, CD127, CTLA4, Bcl-6 and Helios) among TREG, non- TREG, TFR and TFH populations from LN of healthy, unvaccinated and uninfected RM. Non-TREG here are defined as all CD4+CD25FoxP3 T-cells. Significance was determined by Wilcoxon signed rank tests.
Figure 3
Figure 3. RNA expression patterns confirm that TFR share TFH and TREG like phenotype
(A) Principal components analysis of RNA transcripts from five healthy, SIV-uninfected RM. Each circle represents the transcriptome of a sorted population of TFH (blue), TREG (green), or TFR (red) from a single animal. (B) Expression in FPKM of select TFH and TREG genes in sorted populations from uninfected RM. (C) Heat map of log 2 transformed gene expression of transcripts in FPKM. Transcripts represent TFH and TREG signature genes. The TFH gene signature was defined as transcripts that were significantly differentially expressed in sorted TFH compared to bulk CD4+ T-cells. TREG gene signature was defined as genes that were significantly differentially expressed in sorted TREG compared to bulk CD4+ T-cells. (D) Expression pattern of key TFH and TREG genes in sorted bulk CD4+ T-cell, TFH, TFR and TREG populations.
Figure 4
Figure 4. Kinetics of TFR, TFH and TREG after SIV infection
(A) Frequency of TFH, TFR and TREG as percentage of the total CD4+ T-cell population within lymph nodes of uninfected, acutely (week 2) SIV-infected and chronically (week 24) SIV-infected RM. (B) Frequency of TFR as a percent of TFH within the lymph nodes of the same animals. (C) Ratio of frequencies of TFR to the frequency of TFH (both calculated as a percent of the total CD4+ T-cell population). (D) Percent of proliferating, Ki67+, TFH, TFR and TREG within the lymph nodes of uninfected, acutely SIV-infected and chronically SIV-infected RM. Statistical analyses were performed using Mann-Whitney U tests.
Figure 5
Figure 5. Comparable levels of SIV infection in TFH, TFR and TREG isolated from the spleen of chronically SIV-infected RM
(A) Viral DNA copies per million sorted TFH, TFR and TREG from spleens of unvaccinated chronically SIV-infected RM. (B) Percent of CCR5-expressing cells among TFH, TFR and TREG in unvaccinated SIV-infected RM. Statistical analyses were performed using Mann-Whitney U tests.
Figure 6
Figure 6. TFR frequencies negatively correlate with TFH and GC B-cell frequencies in the lymph nodes of RM
Correlations between the frequencies of TFR (calculated as frequency of TFH) and the frequencies of TFH calculated as percent of total CD4+ T-cells (left) and GC B-cells calculated as percent of total B-cells (center) and proliferating (i.e., Ki67+) CD4+ T-cells (right) within the lymph nodes of SIV-uninfected (A) and chronically SIV-infected (B) RM. Statistical analyses were performed using Spearman rank correlation tests.
Figure 7
Figure 7. RNA expression within TFR cells in uninfected and infected RM
(A) Enrichment of gene pathways in TFR derived from the lymph nodes of unvaccinated SIV infected RM as compared to TFR from SIV-uninfected animals as determined by Ingenuity Pathway Analysis. (B) Log 2 fold change of expression of TFH and TREG related gene transcripts in TFR sorted from unvaccinated SIV-infected RM and SIV-uninfected RM. Significantly upregulated genes are in red and significantly down-regulated genes are in blue.

References

    1. Pissani F, Streeck H. Emerging concepts on T follicular helper cell dynamics in HIV infection. Trends in immunology. 2014;35:278–286. - PMC - PubMed
    1. Corti D, Lanzavecchia A. Broadly neutralizing antiviral antibodies. Annual review of immunology. 2013;31:705–742. - PubMed
    1. Murphy MK, Yue L, Pan R, Boliar S, Sethi A, Tian J, Pfafferot K, Karita E, Allen SA, Cormier E, Goepfert PA, Borrow P, Robinson JE, Gnanakaran S, Hunter E, Kong XP, Derdeyn CA. Viral escape from neutralizing antibodies in early subtype A HIV-1 infection drives an increase in autologous neutralization breadth. PLoS pathogens. 2013;9:e1003173. - PMC - PubMed
    1. Crotty S. Follicular helper CD4 T cells (TFH) Annual review of immunology. 2011;29:621–663. - PubMed
    1. Pratama A, Vinuesa CG. Control of TFH cell numbers: why and how? Immunology and cell biology. 2014;92:40–48. - PubMed

Publication types

MeSH terms

Associated data