. 2015 Sep 2;87(5):1093-105.
doi: 10.1016/j.neuron.2015.07.012. Epub 2015 Aug 19.

Neural Population Evidence of Functional Heterogeneity along the CA3 Transverse Axis: Pattern Completion versus Pattern Separation

Affiliations

Neural Population Evidence of Functional Heterogeneity along the CA3 Transverse Axis: Pattern Completion versus Pattern Separation

Heekyung Lee et al. Neuron. .

Abstract

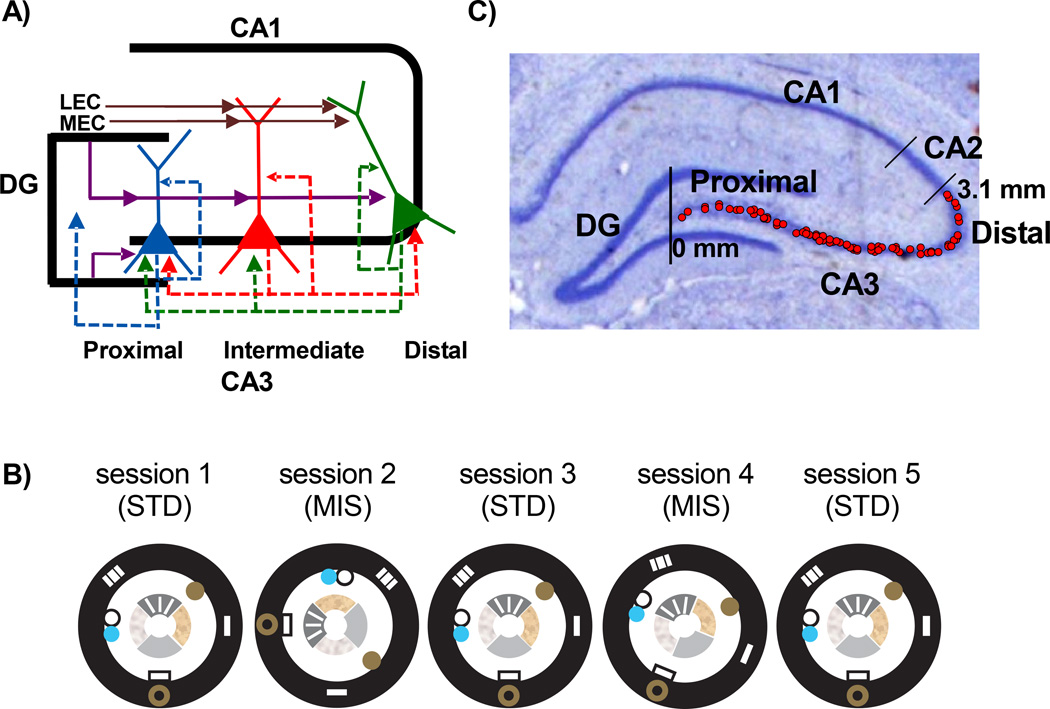
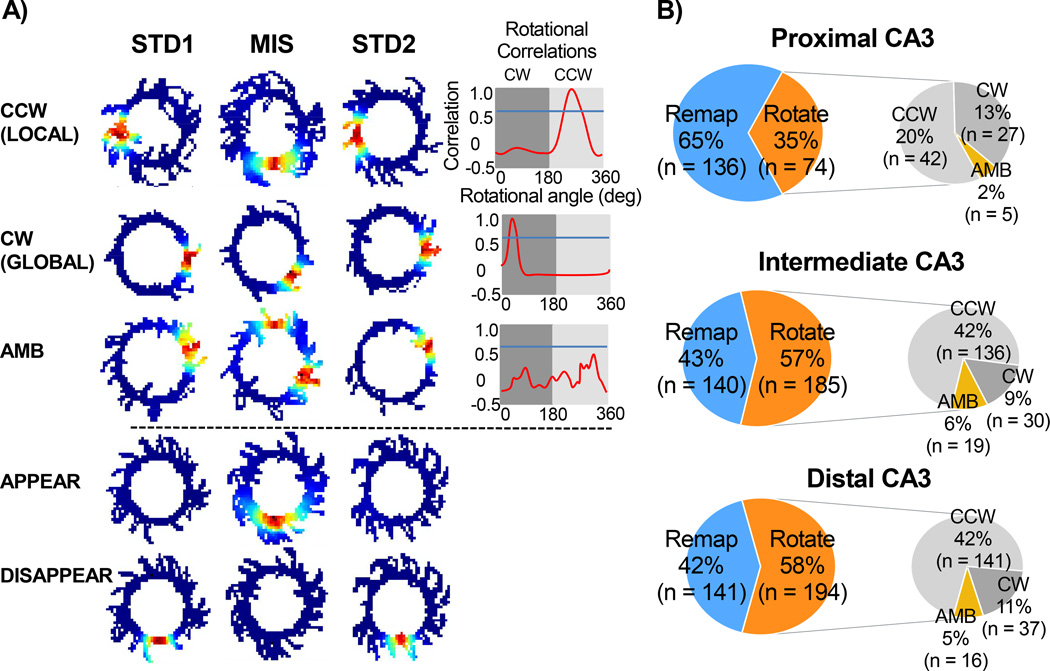
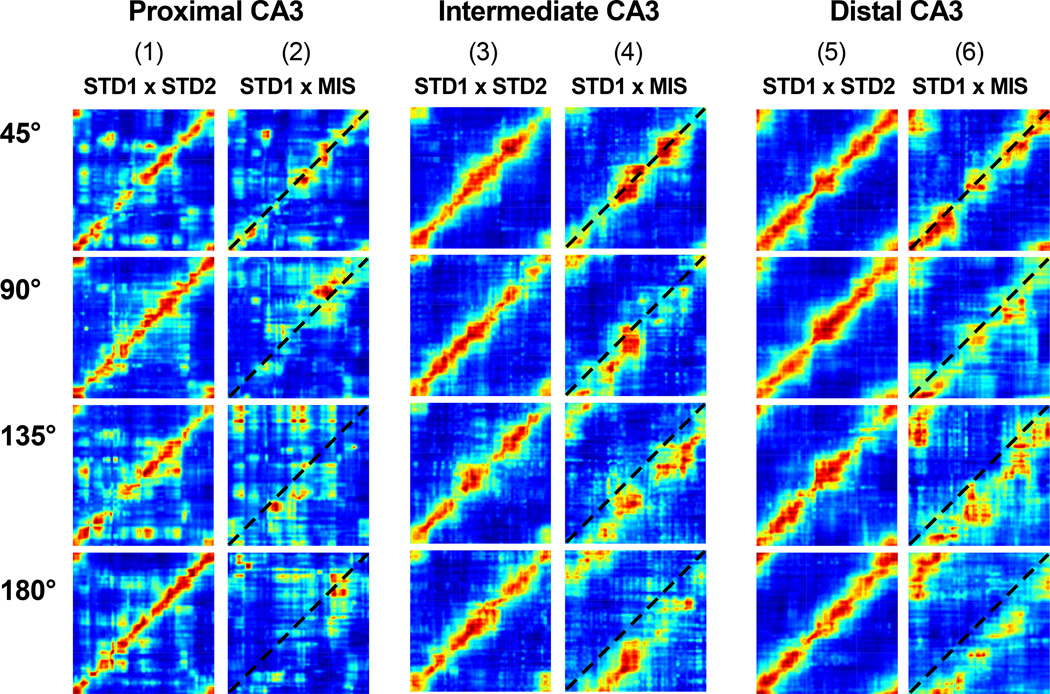
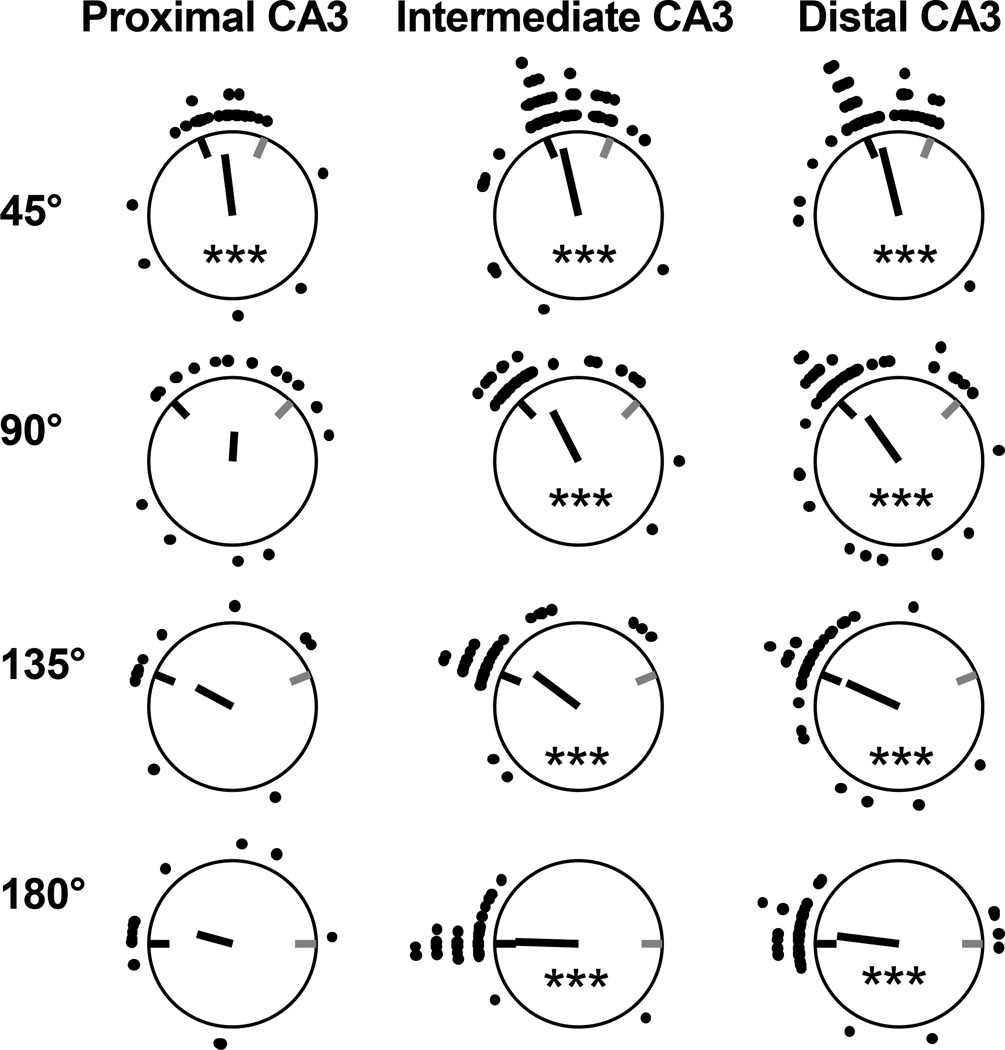
Classical theories of associative memory model CA3 as a homogeneous attractor network because of its strong recurrent circuitry. However, anatomical gradients suggest a functional diversity along the CA3 transverse axis. We examined the neural population coherence along this axis, when the local and global spatial reference frames were put in conflict with each other. Proximal CA3 (near the dentate gyrus), where the recurrent collaterals are the weakest, showed degraded representations, similar to the pattern separation shown by the dentate gyrus. Distal CA3 (near CA2), where the recurrent collaterals are the strongest, maintained coherent representations in the conflict situation, resembling the classic attractor network system. CA2 also maintained coherent representations. This dissociation between proximal and distal CA3 provides strong evidence that the recurrent collateral system underlies the associative network functions of CA3, with a separate role of proximal CA3 in pattern separation.


Figures

Figure 1
Figure 1
CA3 circuitry and experimental paradigm. (A) Schematic of the intrinsic and extrinsic inputs to CA3 along the transverse axis. Solid brown arrows indicate the entorhinal inputs, solid purple arrows indicate the DG inputs, and the dashed arrows indicate the recurrent collaterals in proximal (blue), intermediate (red), and distal (green) CA3. (B) Recording sessions consisted of three standard (STD) sessions interleaved with two mismatch (MIS) sessions. In the STD sessions, the local cues of the track (denoted by the inner ring of 4 textures) and the global cues along the curtain at the periphery (denoted by the black outer ring) were arranged in the familiar configuration that the rat had experienced in all preceding training trials. In the MIS sessions, changes to the sensory inputs were produced by rotating the global cues clockwise and the local cues counterclockwise by the same amount, for a net cue mismatch of 45°, 90°, 135°, or 180°. In this example, session 2 is a 180° mismatch and session 4 is a 45° mismatch. Over the course of 4 recording days, the rats experienced each mismatch amount twice. (C) Tetrodes were distributed across CA3 such that the recording positions covered the entire transverse axis of CA3.
Figure 2
Figure 2
Spatial properties of CA3 principal neurons are nonuniformly represented along the transverse axis. Each point of the scatter plot represents a tetrode recorded in a location along the CA3 transverse axis, starting at proximal CA3 (adjacent to the DG) and extending to distal CA3 (adjacent to CA2). The average value of all the cells recorded across all the sessions and days for each tetrode was plotted. Well-isolated, active principal cells that passed the inclusion criteria (> 20 spikes on the circular track during behavior, spatial information score > 0.5 with significance p < 0.01, and mean firing rate < 10 Hz) were included in the analyses. From proximal to distal CA3, (A) mean firing rates increased (r = 0.32, p = 0.004), (B) peak firing rates were not different (r = 0.14, p = 0.24), (C) spatial information scores decreased (r = −0.43, p = 0.0001), and (D) place field size increased (r = 0.46, p < 0.0001). n = 74, r, Pearson’s linear correlation coefficient.
Figure 3
Figure 3
Differences along the transverse axis in remapping vs. rotation of place fields. (A) Examples of spatial firing rate maps showing 5 different response types observed in CA3. Categories included counterclockwise (CCW) rotation with the local cues, clockwise (CW) rotation with the global cues, ambiguous (AMB) rotation responses, APPEAR in the MIS sessions, and DISAPPEAR in the MIS sessions. The rotation correlation analysis between STD1 and MIS session (red line) is shown to the right of the rate maps. These graphs show the correlations between STD and MIS rate maps as the MIS rate map is rotated in 1° increments rel ative to the STD rate map. Peak correlations above a threshold of 0.6 (Neunuebel and Knierim, 2014) located in the dark or light grey box indicated that the fields rotated CW or CCW, respectively. Peak correlations below 0.6 were considered ambiguous responses. Examples of ambiguous responses could be cells that split their place fields in two (as shown here) or cells that markedly changed their place field sizes or specificity between the STD and MIS sessions. In the rate maps, blue indicates 0 firing and red indicates the maximum firing rate for that cell. (B) Categorical classification of responses in different CA3 subregions. “Remap” comprises APPEAR and DISAPPEAR cells; “Rotate” comprises CCW, CW, and AMB cells. A higher proportion of cells in distal and intermediate CA3 rotate with the cues than remap, whereas a higher proportion of cells in proximal CA3 remap than rotate. Of the cells that rotate, a higher proportion of cells rotate with the local cues (CCW) in all the CA3 subregions, although in different proportions.
Figure 4
Figure 4
Proximal CA3 shows decorrelated representations between the standard and mismatch sessions while intermediate and distal CA3 show correlated representations. The firing rate of each cell was calculated for each 1° bin on the track and then normalized to its peak rate. The firing rate maps of all n cells in the sample were stacked to create a 360 × n matrix, in which each column of the matrix represents the population firing rate vector for a specific angle of the track (Fig. S3A). The firing rate vectors at each angle of a STD session (STD1) were correlated with (a) the firing rate vectors at each angle of the next STD session (STD2) to create a STD1 × STD2 correlation matrix and (b) the next MIS session to create a STD1 × MIS correlation matrix. The population representation maintained coherence in intermediate and distal CA3 in all mismatch sessions (columns 4 & 6, respectively), indicated by the bands of high correlation. The representation in proximal CA3 was coherent in the 45° MIS session but degraded in MIS sessions > 45° (column 2), indicated by the dispersed and weak bands of correlation. In these normalized matrices, the blue color indicates 0 and the red color indicates 1.
Figure 5
Figure 5
Shuffling analyses were performed to statistically quantify the population correlation differences between the CA3 subregions. The Peak Correlation Difference Index (PCDI) and the Euclidean distance of the peak correlation bands were calculated for each CA3 subregion. Comparisons between the subregions were then calculated for each measure as proximal CA3 - distal CA3, proximal CA3 - intermediate CA3, and intermediate CA3 - distal CA3. The experimental value (thick, black line) was compared to the distribution produced by 1000 random shufflings of the data. The PCDI difference (A) and the Euclidean distance difference (B) were not significantly different between the subregions in the 45° MIS session, but proximal CA3 was significantly different from intermediate and distal CA3 in MIS sessions > 45°. Because the 12 distributions of each measure are not independent of each other, standard multiple comparison tests (even modified tests such as Holm-Bonferroni or false discovery rate) are not appropriate (see Supplemental Experimental Procedures). With Holm-Bonferroni correction, only the 180° mismatch sessions would b e considered statistically significant. However, no particular comparison is the critical test for these data. Rather, the important results lie in the pattern of low p values for all Prox - Dist and Prox - Int comparisons for mismatch angles > 45° and the high p values for all Int – Dist comparisons.
Figure 6
Figure 6
Individual cell rotation amounts show strong local preference in intermediate and distal CA3. Each dot indicates the amount of rotation of a single place field between the standard and mismatch sessions. The line at the center of the polar plots denotes the mean vector; the black and grey tick marks corresponds to the local and global cue rotations, respectively. The mean vector lengths for intermediate and distal CA3 were significant for all mismatch angles, whereas the mean vector length for proximal CA3 was significant only in the 45° MIS se ssion (Rayleigh test, see below). There was no significant clustering for MIS session > 45° (90°: n = 19, z = 2.41, p = 0.09; 135°: n = 12, z = 2.85, p = 0.05; and 180°: n = 15, z = 2.78, p = 0.06), although the lack of significance is likely the result of the decreased statistical power due to the large number of cells that remapped in proximal CA3. Regardless of statistical significance, intermediate and distal CA3 followed the local cues for all mismatch angles and proximal CA3 followed the local cues for 3 out of the 4 mismatch angles (45°, 135°, and 180°). ***p < 0.0001. (proximal: 45°: n = 28, z = 1 5.38, p < 0.0001; intermediate: 45°: n = 64, z = 43.11, p < 0.0001; 90°: n = 41, z = 18.45 , p < 0.0001; 135°: n = 44, z = 18.88, p < 0.0001; 180°: n = 36, z = 20.58, p < 0.0001; di stal: 45°: n = 63, z = 43.06, p < 0.0001; 90°: n = 50, z = 21.26, p < 0.0001; 135°: n = 38, z = 17.26, p < 0.0001; 180°: n = 43, z = 24.44, p < 0.0001).
Figure 7
Figure 7
Population coherence in CA2 is similar to intermediate and distal CA3 but different from proximal CA3. (A) The population representation maintained coherence in CA2 in all mismatch angles, as indicated by the bands of high correlation (column 2). The correlation bands shifted below the main diagonal, demonstrating control by the local cues. In these normalized matrices, the blue color indicates 0 and the red color indicates 1. (B) Categorical classification of cell responses in CA2 to cue-mismatch manipulations. A higher proportion of cells in CA2 “Rotate” than “Remap”. Of the cells that rotate with the cues, a higher proportion of cells rotate with the local cues (CCW). (C) Individual cell rotation amounts between the standard and mismatch sessions in CA2. The mean vector length was significant for all mismatch angles, following the local cues (Rayleigh test, 45°: n = 30, z = 13.52, p < 0.0001; 90°: n = 32, z = 12.00, p < 0.0001; 135°: n = 24, z = 7.07, p < 0.0001; 180°: n = 28, z = 11.17, p < 0.0001). (D) PCDI difference and (E) Euclidean distance difference between CA2 and CA3 subregions. The real experimental value (thick, black line) was compared to the shuffled distributions. CA2 was different from proximal CA3 in MIS sessions, with p values < 0.05 or close to 0.05. The peak correlation difference in the 180° MIS session was also significantly different between CA2 and distal CA3. As with the comparisons among the CA3 regions (Fig. 5), the overall patterns of p values are the important result, not whether any particular comparison reaches a particular statistical significance value. ***p < 0.0001.
Figure 8
Figure 8
Place fields are unstable in CA2 compared to CA3 subregions. (A) From all four recording days, place cells that passed the inclusion criteria in all three STD sessions were ordered by the peak positions of their linearized rate maps in the first STD session (session 1). The positions of most place fields remained stable across session 1, session 3, and session 5 in all CA3 subregions. In CA2, the positions of the place fields started to misalign in session 3 and many were out of order in session 5. . In these plots, the firing rates of each place cell were normalized across the 3 sessions. The blue color indicates the minimum normalized firing rate (0) and the red color indicates maximum firing rate (1). (B) For a subset of place cells that passed the inclusion criteria in all three STD sessions, the rotation amounts of the place fields between the first STD session (session 1) and the last STD session (session 5) were calculated. To avoid counting the same cells over multiple days, we analyzed for each tetrode only the single day of recording that produced the largest number of well-isolated units. Comparisons of the rotation amounts in the CA2 and CA3 subregions showed significant region difference (Kruskal-Wallis test; χ2(3) = 21.82, p < 0.0001. Post-hoc Mann-Whitney U test showed that CA2 was different from proximal (z = 3.74, p < 0.0001), intermediate (z = 3.85, p < 0.0001) and distal (z = 4.33, p < 0.0001) CA3 but the CA3 subregions were not different from each other (Dist vs. Int: z = −0.95, p = 0.34; Dist vs. Prox: z = −0.24, p = 0.81; Int vs. Prox: z = 0.62, p = 0.53).

Comment in

  • Spatial processing: mapping function.
    Whalley K. Whalley K. Nat Rev Neurosci. 2015 Oct;16(10):575. doi: 10.1038/nrn4029. Epub 2015 Sep 9. Nat Rev Neurosci. 2015. PMID: 26350242 No abstract available.

Similar articles

Cited by

References

    1. Amaral DG, Witter MP. The three-dimensional organization of the hippocampal formation: a review of anatomical data. Neuroscience. 1989;31:571–591. - PubMed
    1. Amit DJ. Modeling Brain Function: The World of Attractor Neural Networks. Cambridge, UK/New York: Cambridge Univ. Press; 1989.
    1. Burke SN, Maurer AP, Nematollahi S, Uprety AR, Wallace JL, Barnes CA. The influence of objects on place field expression and size in distal hippocampal CA1. Hippocampus. 2011;21:783–801. - PMC - PubMed
    1. Caruana DA, Alexander GM, Dudek SM. New insights into the regulation of synaptic plasticity from an unexpected place: hippocampal area CA2. Learn Mem. 2012;19:391–400. - PMC - PubMed
    1. Chevaleyre V, Siegelbaum SA. Strong CA2 pyramidal neuron synapses define a powerful disynaptic cortico-hippocampal loop. Neuron. 2010;66:560–572. - PMC - PubMed

Publication types

LinkOut - more resources