. 2015 Aug 23:14:162.
doi: 10.1186/s12943-015-0433-y.

Invasion of ovarian cancer cells is induced byPITX2-mediated activation of TGF-β and Activin-A

Affiliations

Invasion of ovarian cancer cells is induced byPITX2-mediated activation of TGF-β and Activin-A

Moitri Basu et al. Mol Cancer. .

Abstract

Background: Most ovarian cancers are highly invasive in nature and the high burden of metastatic disease make them a leading cause of mortality among all gynaecological malignancies. The homeodomain transcription factor, PITX2 is associated with cancer in different tissues. Our previous studies demonstrated increased PITX2 expression in human ovarian tumours. Growing evidence linking activation of TGF-β pathway by homeodomain proteins prompted us to look for the possible involvement of this signalling pathway in PITX2-mediated progression of ovarian cancer.

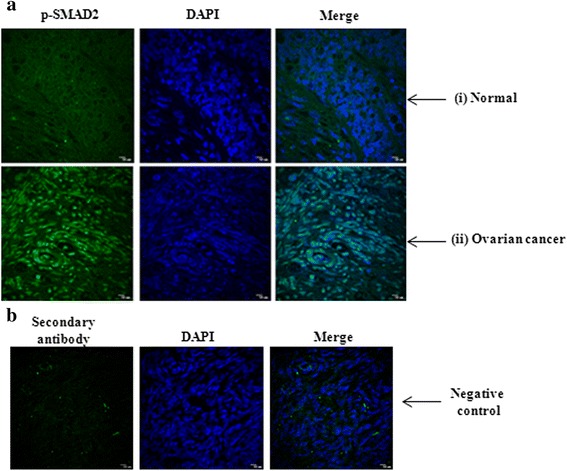
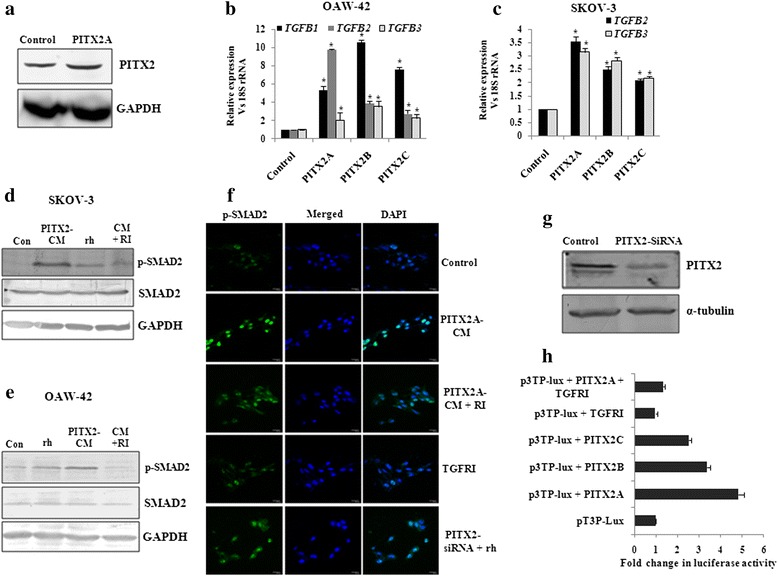
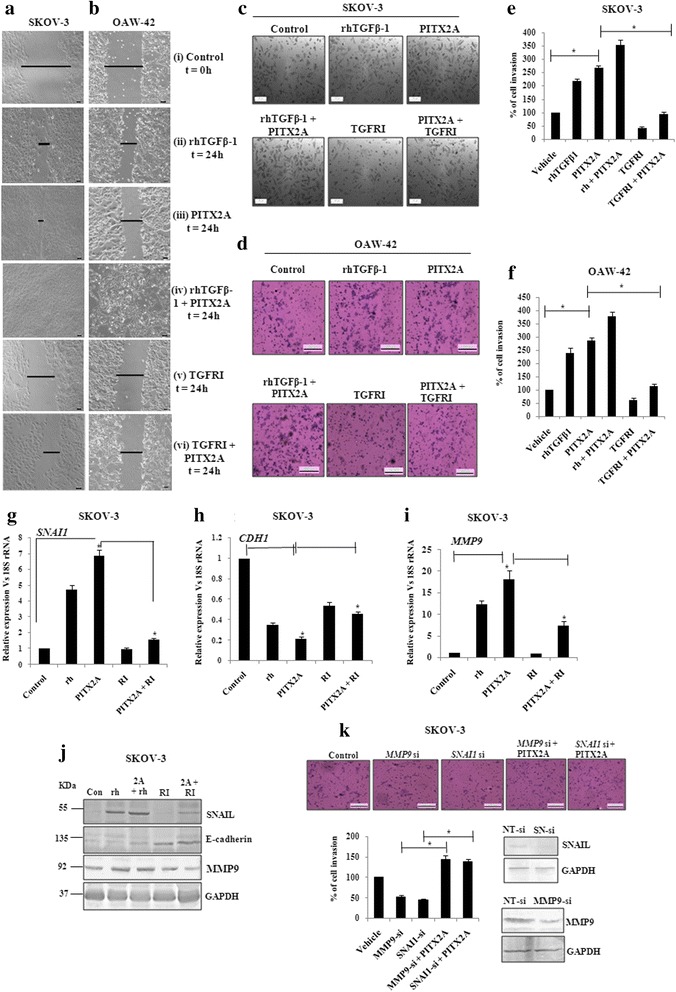
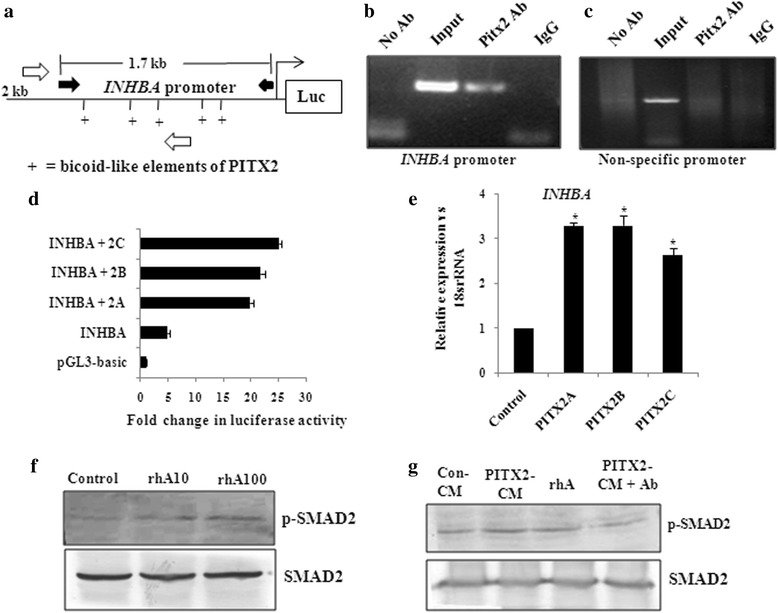
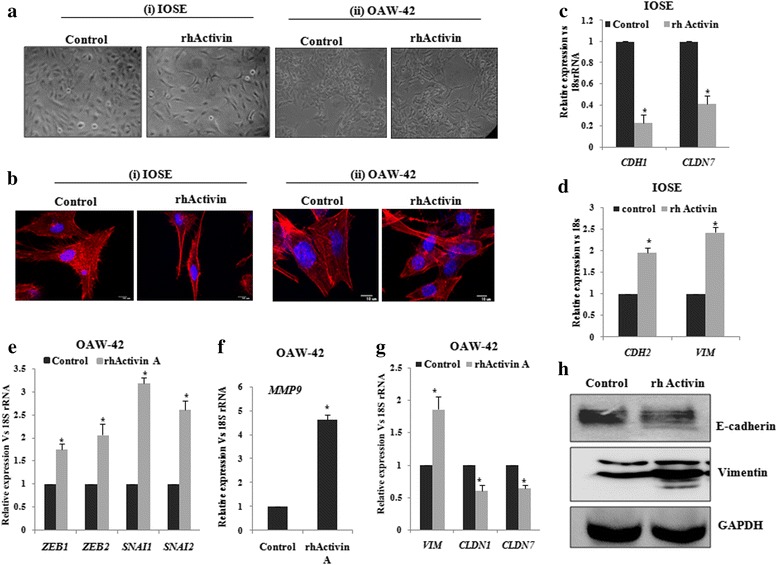
Methods: The status of TGF-β signalling in human ovarian tissues was assessed by immunohistochemistry. The expression level of TGFB/INHBA and other invasion-associated genes was measured by quantitative-PCR (Q-PCR) and Western Blot after transfection/treatments with clones/reagents in normal/cancer cells. The physiological effect of PITX2 on invasion/motility was checked by matrigel invasion and wound healing assay. The PITX2- and activin-induced epithelial-mesenchymal transition (EMT) was evaluated by Q-PCR of respective markers and confocal/phase-contrast imaging of cells.

Results: Human ovarian tumours showed enhanced TGF-β signalling. Our study uncovers the PITX2-induced expression of TGFB1/2/3 as well as INHBA genes (p < 0.01) followed by SMAD2/3-dependent TGF-β signalling pathway. PITX2-induced TGF-β pathway regulated the expression of invasion-associated genes, SNAI1, CDH1 and MMP9 (p < 0.01) that accounted for enhanced motility/invasion of ovarian cancers. Snail and MMP9 acted as important mediators of PITX2-induced invasiveness of ovarian cancer cells. PITX2 over-expression resulted in loss of epithelial markers (p < 0.01) and gain of mesenchymal markers (p < 0.01) that contributed significantly to ovarian oncogenesis. PITX2-induced INHBA expression (p < 0.01) contributed to EMT in both normal and ovarian cancer cells.

Conclusions: Overall, our findings suggest a significant contributory role of PITX2 in promoting invasive behaviour of ovarian cancer cells through up-regulation of TGFB/INHBA. We have also identified the previously unknown involvement of activin-A in promoting EMT. Our work provides novel mechanistic insights into the invasive behavior of ovarian cancer cells. The extension of this study have the potential for therapeutic applications in future.


Figures

Fig. 1
Fig. 1
The expression of p-SMAD2 is up-regulated in human ovarian cancer. a The level of p-SMAD2 was shown by IHC in human ovarian tissue-sections with p-SMAD2 antibody followed by Alexa Fluor-488 (green) of normal (i; n = 20) and ovarian tumor (ii; n = 20), out of which 15 samples are of high grade and 5 samples are benign. The DAPI-stained nuclei and the merged images were also shown. b The negative control images represent the staining in presence of secondary antibody and DAPI but without primary antibody. The images were taken at the same exposure time. Scale bar, 10 μm
Fig. 2
Fig. 2
PITX2 induces TGF-β signalling pathway in ovarian cancer cells. a Western blot was performed with the lysate of OAW-42 cells transiently transfected with PITX2A expression clone. b-c Q-PCR assay of TGF-B1/B2/B3 (for OAW-42 cells; b) and TGF-B2/B3 (for SKOV-3 cells; c) was done with specific primers with RNA isolated from PITX2-overexpressed respective cells. The comparative expression of respective genes is shown as relative ‘fold’ change (mean ± S.E.M). * represents p < 0.05. d-e The conditioned-medium (PITX2-CM) was collected after transient transfection with PITX2A. Freshly plated serum-starved SKOV-3 (d) and OAW-42 (e) cells were incubated for 2 h with PITX2-CM alone or in combination with 20 ng/ml TGFRI (RI) followed by Western blot of the lysates with p-SMAD2 and SMAD2 antibodies. The lysate of the cellstreated with rhTGF-β1 (rh; for 30 min) was blotted with the respective antibodies. Here, GAPDH was used as loading control. f Confocal imaging for p-SMAD2 was performed in SKOV-3 cells treated or transfected as mentioned, where the left panel shows the p-SMAD2 expression, DAPI-stained nuclei in the middle panel and the right panel shows their merged image. The images were taken at the same exposure time. Scale bar, 20 μm. g Lysates were prepared from PITX2A-siRNA trasfected OAW-42 cells for Western blot with PITX2-antibody. Here, α-tubulin was used as loading control. h OAW-42 cells were transfected with p3TP-Lux vector alone or along with expression constructs of PITX2 isoforms or pcDNA3 (empty vector) and treated with TGFRI for 16 h for luciferase assay. The activities are shown as mean fold enhancement compared to the p3TP-construct without PITX2 expression after normalization with renilla luciferase activity
Fig. 3
Fig. 3
Over-expression of PITX2 affects markers for EMT and invasion in ovarian cancer cells. a-d The expression level of SNAI1, SNAI2, MMP9, CLD4, CLD7, DSM and VIM genes were quantified by Q-PCR assay after ectopic over-expression of PITXA/B/C into SKOV-3 (a and c) and OAW-42 (b and d) cells. The expression of CDH1 was assessed in SKOV-3 cells (Fig A-ii) upon transient transfection of PITX2 isoforms. The comparative expression of respective genes is shown as relative ‘fold’ change (mean ± S.E.M). e-f Western blot analysis of the proteins with respective antibodies was performed with the lysates of PITX2-tranfected SKOV-3 (e) and OAW-42 (f) cells. Here, GAPDH was used as internal loading control. g Bright field microscopy images exhibit the epithelial phenotype of the control and mesenchymal phenotype of PITX2A-transfected IOSE (G-i) and SKOV3 (G-ii) cells cells. h Phalloidin staining of IOSE cells (i) and imunofluorescence imaging of E-cadherin was performed for the SKOV-3 cells (ii). i-j Q-PCR assay was performed to check the expression of CLDN1, CLDN7, CDH2 and VIM in PITX2-overexpressed IOSE cells. *represents p < 0.05
Fig. 4
Fig. 4
The regulation of invasion and migration is served by PITX2-mediated activation of TGF-β signalling pathway. Wound healing assay was performed of SKOV-3 (a) and OAW-42 (b) cells after treatment with rhTGFβ1 (ii), transient transfection of PITX2A (iii) and treatment with rhTGFβ1 (iv) or TGFRI (v) of PITX2-transfected cells in the time course of 24 h. T = 0 h at control cells (i) signifies the time of scratching the cells with pipette tips. The arrows indicate the width of wound and the assay was repeated three times independently. Scale bar: 50 μm. Transwell migration and invasion assay was performed in SKOV-3 (c) and OAW-42 (d) cells after treatment and/or transient transfection as mentioned. Scale bar: 200 μm. Cells at three independent fields for each well were counted and plotted with error bar for SKOV-3 (e) and OAW-42 (f) cells. g-i pcDNA3 or PITX2A-transfected SKOV-3 cells were treated with rhTGFβ1 (10 ng/ml) or TGFRI (20 ng/ml) followed by isolation of RNA and Q-PCR with the primers of SNAI1 (g), CDH1 (h) and MMP9 (i). Relative gene expression is indicated as ‘fold’ change in the Y-axis (mean ± SEM). * represents p < 0.01. j Lysates of the cells transiently transfected and/or treated as indicated were immunoblotted with respective antibodies and the representative gel image was shown. k Transwell invasion assay was performed with SKOV-3 cells after transient transfection as mentioned (top). Cells at three independent fields for each well were counted and were plotted with error bar (bottom). The efficiency in knocking down the expression of SNAIL and MMP9 proteins by SNAI-(SN)-si and MMP9-si respectively was verified by Western blot of the transfected cell lysates with respective antibodies. Here, GAPDH was used as loading control (bottom)
Fig. 5
Fig. 5
PITX2-regulated INHBA activates SMAD2 level. a Schematic diagram shows the 2 kb upstream region of INHBA promoter with the PITX2-specific bicoid-like (as +) elements. Here, the location of primers used to clone 1.7 kb region in pGL3 vector has been depicted with black solid arrow, while that used for ChIP-PCR has been shown with hollow arrows. b-c ChIP with SKOV-3 cells followed by the PCR showed the amplification of the INHBA promoter (b) from the chromatin input and from PITX2-IP DNA as indicated in the lanes. The PITX2 antibody used in this assay recognizes all three isoforms of PITX2. Amplification of respective promoters was not observed by PCR performed with IgG-IP and no antibody control sets. c Primers of an unrelated gene did not show amplification from PITX2-IP DNA. (d) The INHBA promoter as shown in Fig A was cloned into pGL3-basic vector. OAW-42 cells were transiently co-transfected with the construct alone or in combination with PITX2 isoforms followed by luciferase assay. The reporter activity of each clone was calculated in terms of fold change in PITX2-overexpressed cells compared with empty vector-transfected cells, after normalization with renilla luciferase activity. e Q-PCR analysis of the INHBA gene with specific primers was performed with the RNA isolated from PITX2A/B/C-transfected OAW-42 cells. Relative gene expression is indicated as ‘fold’ change in the Y-axis (mean ± SEM). The statistical analysis is done as described previously.* represents p < 0.05. f Western blot was performed to check the level of p-SMAD2 in OAW-42 cells after treatment with rhActivin-A (rhA10: 10 ng/ml and rhA100: 100 ng/ml) for 30 mins. g The levels of p-SMAD2 was assessed on treating the cells with PITX2A-conditioned medium (PITX2-CM), rhActivin-A (rhA: 100 ng/ml) or PITX2-CM in presence of activin neutralizing antibody (Pitx2-CM + Ab)
Fig. 6
Fig. 6
Activin-A promotes EMT in ovarian non-cancerous and cancer cells. a-b IOSE and OAW-42 cells were treated with rhActivin-A and their morphological changes were observed through bright field (A i-ii) as well as through confocal microscopy after phalloidin staining (B i-ii). c-d RNA was isolated from the IOSE cells to check the expression of CDH1, CLDN7 (c) and CDH2, VIM (d) by Q-PCR. e-g RNA isolation was done from the OAW-42 cells to quantify ZEB1, ZEB2,SNAI1, SNAI2 (e), MMP9 (f), CLDN1,CLDN7 and VIM (g) by Q-PCR with specific primers. Relative gene expression is indicated as ‘fold’ change in the Y-axis (mean ± SEM). The statistical analysis is done as described previously.*represents p < 0.05. h Western Blot was done with lysates of IOSE cells with respective antibodies as mentioned. GAPDH was used as the loading control
Fig. 7
Fig. 7
PITX2 acts through Activin-A to affect the cellular invasion and EMT. a Matrigel transwell assay was performed in OAW-42 cells which were treated either with rhActivin-A or transfected with INHBA-siRNA in presence or absence of PITX2A-overexpression and the percentage of cell invasion was calculated. Scale bar 100 μm. b Cells at three independent fields for each well were counted and plotted with error bar. c-f RNA was isolated from cells tarnsfected with INHBA-siRNA in presence or absence of PITX2A- overexpression and the expression of MMP9, ZEB1, SNAI1, VIM, CLDN7 was quantified by Q- PCR with specific primers. Relative gene expression is indicated as ‘fold’ change in the Y-axis (mean ± SEM). The statistical analysis is done as described previously.*represents p < 0.05

References

    1. Yap TA, Carden CP, Kaye SB. Beyond chemotherapy: targeted therapies in ovarian cancer. Nat Rev Cancer. 2009;9:167–81. doi: 10.1038/nrc2583. - DOI - PubMed
    1. Scully RE. Pathology of ovarian cancer precursors. J Cell Biochem Suppl. 1995;23:208–18. doi: 10.1002/jcb.240590928. - DOI - PubMed
    1. Gotzmann J, Mikula M, EgerSchulte-Hermann AR, Foisner R, Beug H, Mikulits W. Molecular aspects of epithelial cell plasticity: implications for local tumour invasion and metastasis. Mutat Res. 2004;566:9–20. doi: 10.1016/S1383-5742(03)00033-4. - DOI - PubMed
    1. Akhurst RJ, Derynck R. TGF-beta signaling in cancer-a double-edged sword. Trends Cell Biol. 2001;11:S44–51. - PubMed
    1. Shi Y, Massagué J. Mechanisms of TGF-beta signaling from cell membrane to the nucleus. Cell. 2003;113:685–700. doi: 10.1016/S0092-8674(03)00432-X. - DOI - PubMed

Publication types

MeSH terms