. 2015 Sep 3;97(3):404-18.
doi: 10.1016/j.ajhg.2015.07.012. Epub 2015 Aug 20.

Accurate Non-parametric Estimation of Recent Effective Population Size from Segments of Identity by Descent

Affiliations

Accurate Non-parametric Estimation of Recent Effective Population Size from Segments of Identity by Descent

Sharon R Browning et al. Am J Hum Genet. .

Abstract

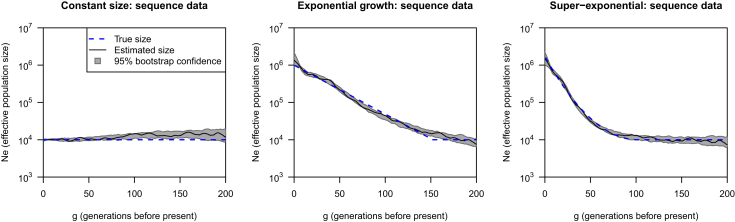
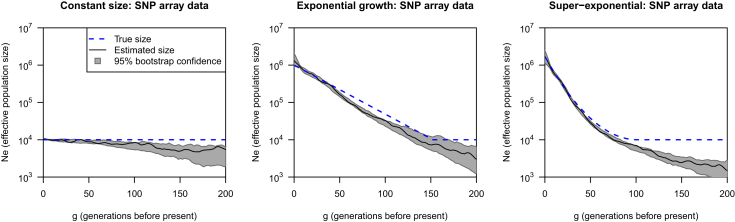
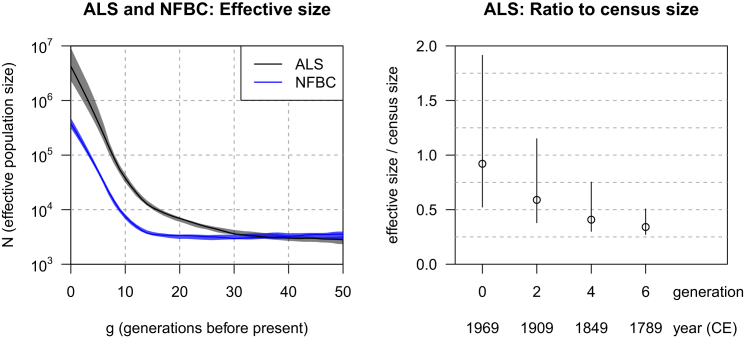
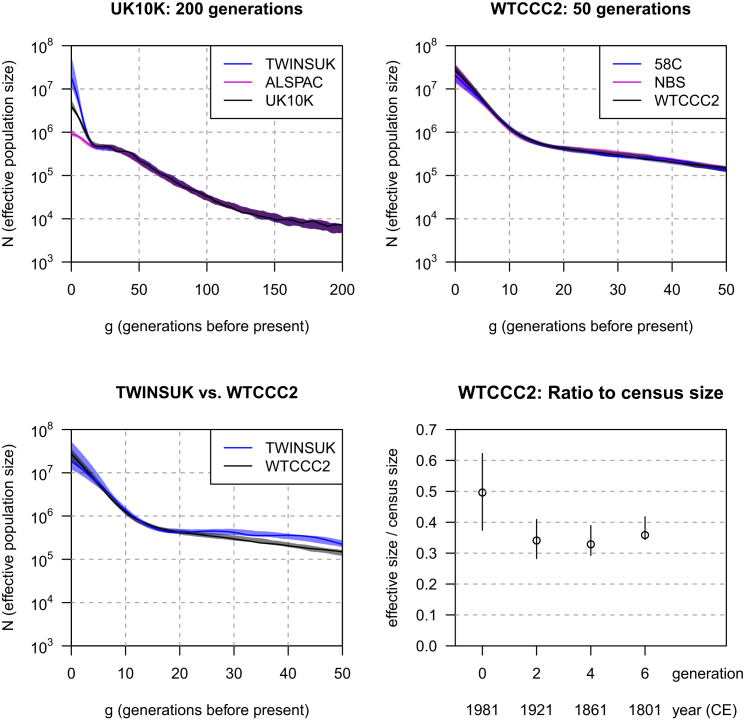
Existing methods for estimating historical effective population size from genetic data have been unable to accurately estimate effective population size during the most recent past. We present a non-parametric method for accurately estimating recent effective population size by using inferred long segments of identity by descent (IBD). We found that inferred segments of IBD contain information about effective population size from around 4 generations to around 50 generations ago for SNP array data and to over 200 generations ago for sequence data. In human populations that we examined, the estimates of effective size were approximately one-third of the census size. We estimate the effective population size of European-ancestry individuals in the UK four generations ago to be eight million and the effective population size of Finland four generations ago to be 0.7 million. Our method is implemented in the open-source IBDNe software package.


Figures

Figure 1
Figure 1
Estimating Effective Population Size by Using IBD Segments Inferred from Simulated Sequence Data by IBDseq The threshold on inferred IBD length is 2 cM. Each plot shows a different simulation scenario (constant size, exponential growth, or super-exponential growth). The blue dashed line in each plot shows the true effective population size, the black line is the estimated effective population size, and the gray regions are bootstrap 95% confidence intervals. The y axes (effective population size) are plotted on a log scale.
Figure 2
Figure 2
Estimating Effective Population Size by Using IBD Segments Inferred from Simulated SNP Array Data by IBDseq The threshold on inferred IBD length is 4 cM. The blue dashed line in each plot shows the true effective population size, the black line is the estimated effective population size, and the gray regions are bootstrap 95% confidence intervals. The y axes (effective population size) are plotted on a log scale.
Figure 3
Figure 3
Effective Population Size of Finland and Northern Finland The left panel shows estimated effective sizes for the Finnish ALS cohort (black line) and the Northern Finnish NFBC (blue line). The threshold on inferred IBD length is 6 cM in both cases. Bootstrap 95% confidence intervals are shown as shaded regions (gray for ALS and blue for NFBC). The y axis is plotted on a log scale. Because the data are SNP data, only generations 0–50 are shown. The right panel shows the ratio of estimated effective size to census size (open circle) and bootstrap 95% confidence intervals (vertical lines). The effective sizes are from the ALS analysis, and the census sizes are for Finland for the years shown under the x axis.
Figure 4
Figure 4
Effective Size of the of UK Population The threshold on IBD length is 2 cM for the UK10K sequence data and 4 cM for the WTCCC2 SNP array data. Estimated effective sizes are shown for 200 generations for the UK10K sequence data (upper left panel), whereas only 50 generations are shown for the WTCCC2 data (upper right panel) because they are derived from SNP array data. Bootstrap 95% confidence intervals are shown as shaded regions. The lower left panel overlays the results for the TWINSUK cohort with the results of the full WTCCC2 data. The lower right panel shows the ratio of estimated effective size to census size (open circle) and bootstrap 95% confidence intervals (vertical lines). The effective sizes are from the WTCCC2 analysis, and the census sizes are for Great Britain (England, Wales, and Scotland) for the years shown under the x axis.

References

    1. Wright S. Evolution in Mendelian Populations. Genetics. 1931;16:97–159. - PMC - PubMed
    1. Charlesworth B. Fundamental concepts in genetics: effective population size and patterns of molecular evolution and variation. Nat. Rev. Genet. 2009;10:195–205. - PubMed
    1. Kere J. Human population genetics: lessons from Finland. Annu. Rev. Genomics Hum. Genet. 2001;2:103–128. - PubMed
    1. Palamara P.F., Lencz T., Darvasi A., Pe’er I. Length distributions of identity by descent reveal fine-scale demographic history. Am. J. Hum. Genet. 2012;91:809–822. - PMC - PubMed
    1. Coventry A., Bull-Otterson L.M., Liu X., Clark A.G., Maxwell T.J., Crosby J., Hixson J.E., Rea T.J., Muzny D.M., Lewis L.R. Deep resequencing reveals excess rare recent variants consistent with explosive population growth. Nat. Commun. 2010;1:131. - PMC - PubMed

Publication types