. 2015 Sep 9;18(3):307-19.
doi: 10.1016/j.chom.2015.07.006. Epub 2015 Aug 20.

Regional Isolation Drives Bacterial Diversification within Cystic Fibrosis Lungs

Affiliations

Regional Isolation Drives Bacterial Diversification within Cystic Fibrosis Lungs

Peter Jorth et al. Cell Host Microbe. .

Abstract

Bacterial lineages that chronically infect cystic fibrosis (CF) patients genetically diversify during infection. However, the mechanisms driving diversification are unknown. By dissecting ten CF lung pairs and studying ∼12,000 regional isolates, we were able to investigate whether clonally related Pseudomonas aeruginosa inhabiting different lung regions evolve independently and differ functionally. Phylogenetic analysis of genome sequences showed that regional isolation of P. aeruginosa drives divergent evolution. We investigated the consequences of regional evolution by studying isolates from mildly and severely diseased lung regions and found evolved differences in bacterial nutritional requirements, host defense and antibiotic resistance, and virulence due to hyperactivity of the type 3 secretion system. These findings suggest that bacterial intermixing is limited in CF lungs and that regional selective pressures may markedly differ. The findings also may explain how specialized bacterial variants arise during infection and raise the possibility that pathogen diversification occurs in other chronic infections characterized by spatially heterogeneous conditions.


Figures

Figure 1
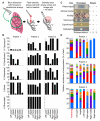
Figure 1. Regional populations vary in infection phenotypes
A. Lung dissection method. Bronchi were isolated by dissection, bronchial walls flash sterilized, and airway lumens lavaged with saline. B. The proportion of regional isolates expressing indicated phenotypes (see Figure S1B-C). C. Heritable differences in phenotypes categorized P. aeruginosa into subpopulations (see Figure S1D). Rhamnolipids were indicated by a colony halo; swimming by the clouding of wells; growth on minimal media and antibiotic resistance by growth on selective plates. Columns show single colonies subjected to different tests. D. The relative abundance of P. aeruginosa subpopulations in regional samples, and in all regions combined (Total lung); colors indicate distinct subpopulations.
Figure 2
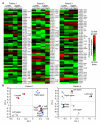
Figure 2. Regional populations have distinct proteomes
A. Expression profiles of the 50 proteins showing the greatest expression differences between regional isolate populations (populations = pools of 200 clonally-related P. aeruginosa collected from lobar airways). Relative protein expression is indicated in comparison to the median abundance protein (black=median, red=high, green=low). Gene and protein names of PAO1 homologs are indicated (see Table S2 and Figure S3). B. Principal component analysis indicates that pools of isolates found together have more similar expression profiles than those found apart.
Figure 3
Figure 3. Regional P. aeruginosa are genetically compartmentalized
Phylogenetic trees were constructed from whole genome sequences of regional P. aeruginosa from patients 1 A., 2 B., and 3 C., and the number of bacterial migrations needed to account for the observed population distributions are indicated with red arrows. Colors of leaves indicate the lung region where each isolate was collected, scale bar indicates number of SNPs per variable position, and “*” indicate most genetically divergent isolates in each lung. Graphs indicate the frequency distributions for the number of migrations needed to account for each of 999,999 randomly-generated trees.
Figure 4
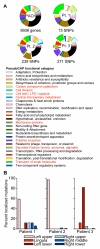
Figure 4. Regional adaptation leads to localized mutations
A. Localized mutations disproportionately affect genes involved in environmental interactions. Functional categories enriched in localized mutations (P<0.05, fisher’s exact test) are shown as offset pie wedges and are highlighted in red. The total number of localized P. aeruginosa mutations in each patient are shown below each pie chart (see Table S3). The PAO1 chart indicates the relative abundance of functional categories and the number of genes. B. The regional distribution of localized mutations in lungs from patients 1-3.
Figure 5
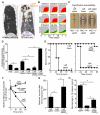
Figure 5. The upper and lower lobe isolates differ in pathogenesis phenotypes
A. Computed tomography scans of a healthy left lung; and the left lung of CF patient 1 showing characteristic severe disease in the upper, and mild disease in the lower lobes. B. Growth over time in media containing indicated carbon and nitrogen sources, as measured by phenotype microarrays (red=upper lobe isolate, green=lower lobe isolate, yellow=overlap; see Figure S5A). C. Ciprofloxacin MIC of the lower lobe, upper lobe, and upper lobe isolate with a corrected parE gene (see Table S4). D-F. The upper lobe isolate is compared to the lower lobe isolate, or the upper lobe isolate in which wild type exsD is restored. Results are representative of 3 or more experiments. D. Cytotoxicity to A549 epithelial cells as measured by LDH release, relative to detergent-treated cells (set at 100%). Also included are PAK (positive control), the PAK exsA mutant (negative control), and the left lower lobe isolate with exsD T188P (mean +/− SEM). E. Mouse mortality following intratracheal infection (upper lobe isolate, circle; lower lobe isolate, square; upper lobe isolate with wild type exsD restored, diamond). F. Bacterial survival after exposure to human neutrophils (upper lobe isolate, circle; lower lobe isolate, square; upper lobe isolate with wild type exsD restored, diamond). G. Bacterial survival after treatment with human serum. H. Macrophage IL-1β release after exposure to bacteria (C-H, *P<0.05, paired Student’s t-test).
Figure 6
Figure 6. The exsD mutation causes type 3 secretion hyperactivity
A. The exsD T188P mutation is found in patient 1 left upper lobe and lingula isolates (indicated by gray box). B. Relative abundance of exsD T188P variant alleles in regional lung secretions from patient 1 as measured by amplicon sequencing (see Figure S6A). C. β-galactosidase activity of the PexsD-lacZ transcriptional reporter (which measures T3S gene expression) in the absence or presence of the T3S inducer EGTA (mean +/− SD, see Figure S6B-C). D. Western blots of T3S proteins expressed under non-inducing and inducing conditions (−/+ EGTA) in the laboratory strain PAK (positive control), a PAK exsA mutant (negative control), the lower lobe isolate, the upper lobe isolate with the exsD T188P mutation, and the upper lobe isolate with a wild-type exsD. “Control” represents a non-specific protein that serves as a loading control, “Sup.” indicates culture supernatants. Data in C-D are representative of 3 experiments. E. Selective reaction monitoring mass spectrometry measurements of T3S and control (AtpD and TufA) proteins in pooled left upper (pink) vs. left lower lobe (burgundy) isolate populations (200 isolates each). Protein abundance was normalized to the summed fragment ion intensity including both upper and lower lobes. Error bar indicates the abundance range from measurements on different peptides for each protein (See Figure S6F).

Comment in

References

    1. Ashish A, Paterson S, Mowat E, Fothergill JL, Walshaw MJ, Winstanley C. Extensive diversification is a common feature of Pseudomonas aeruginosa populations during respiratory infections in cystic fibrosis. J. Cyst. Fibros. 2013;12:790–793. - PMC - PubMed
    1. Burns JL, Gibson RL, McNamara S, Yim D, Emerson J, Rosenfeld M, Hiatt P, McCoy K, Castile R, Smith AL, et al. Longitudinal assessment of Pseudomonas aeruginosa in young children with cystic fibrosis. J. Infect. Dis. 2001;183:444–452. - PubMed
    1. Cingolani P, Platts A, Wang L, Coon M, Nguyen T, Wang L, Land SJ, Ruden DM, Lu X. A program for annotating and predicting the effects of single nucleotide polymorphisms, SnpEff: SNPs in the genome of Drosphila melanogaster strain w1118; iso-2; iso-3. Fly. 2012;6:1–13. - PMC - PubMed
    1. Cramer N, Klockgether J, Wrasman K, Schmidt M, Davenport CF, Tummler B. Microevolution of the major common Pseudomonas aeruginosa clones C and PA14 in cystic fibrosis lungs. Environ. Microbiol. 2011;13:1690–1704. - PubMed
    1. Darch SE, McNally A, Harrison F, Corander J, Barr HL, Paszkiewicz K, Holden S, Fogarty A, Crusz SA, Diggle SP. Recombination is a key driver of genomic and phenotypic diversity in a Pseudomonas aeruginosa population during cystic fibrosis infection. Sci. Rep. 2015;5:7649. - PMC - PubMed

Publication types

MeSH terms

Associated data