. 2015 Sep 1;22(3):485-98.
doi: 10.1016/j.cmet.2015.07.020. Epub 2015 Aug 20.

Mitochondrial Respiration Controls Lysosomal Function during Inflammatory T Cell Responses

Affiliations

Mitochondrial Respiration Controls Lysosomal Function during Inflammatory T Cell Responses

Francesc Baixauli et al. Cell Metab. .

Abstract

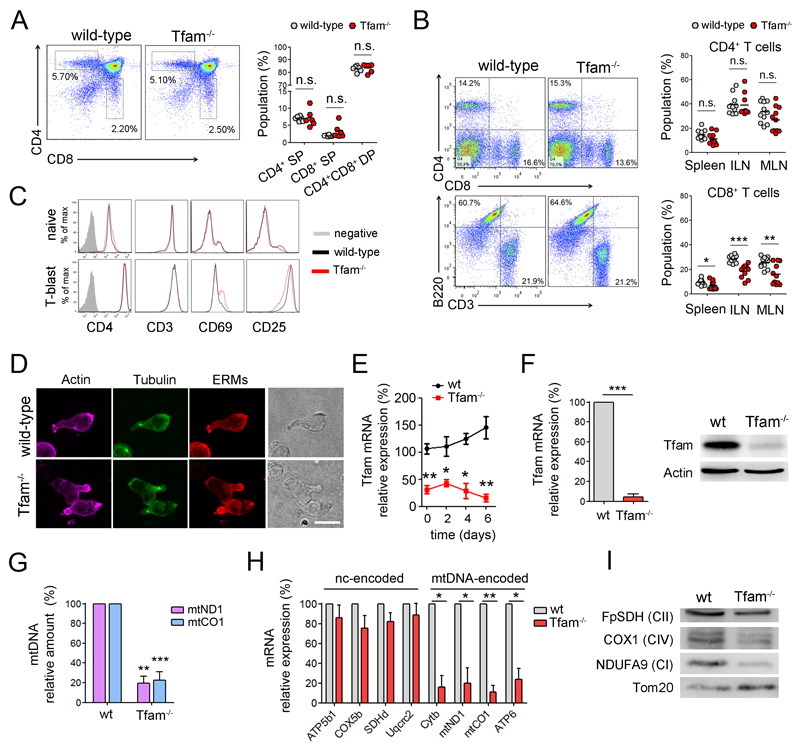
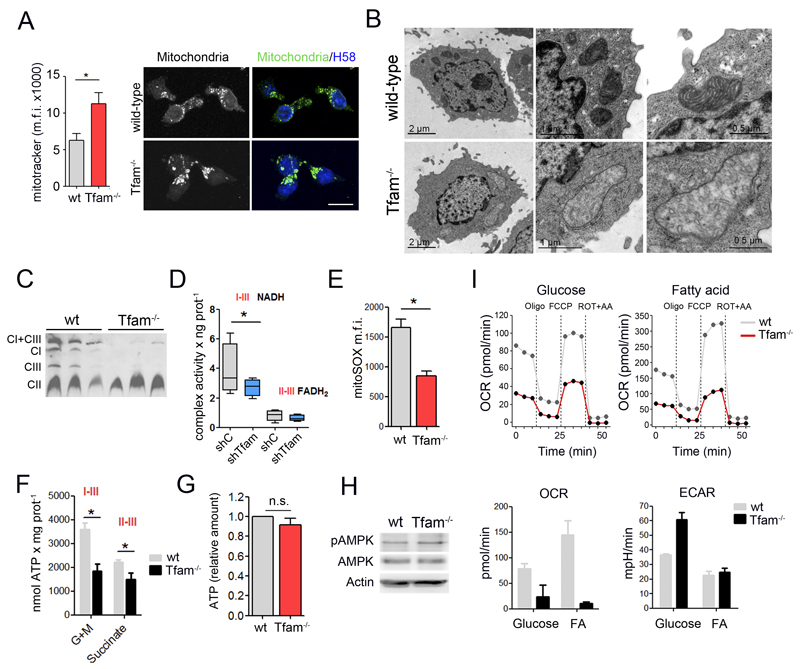
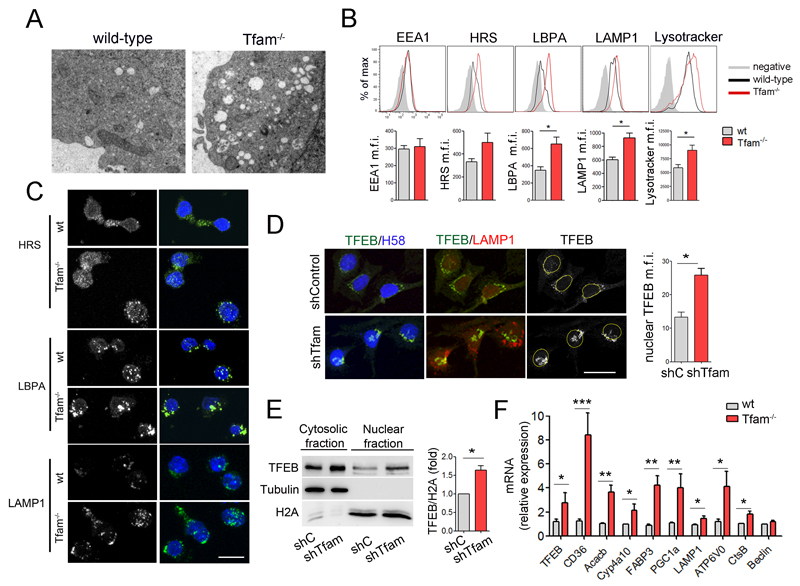
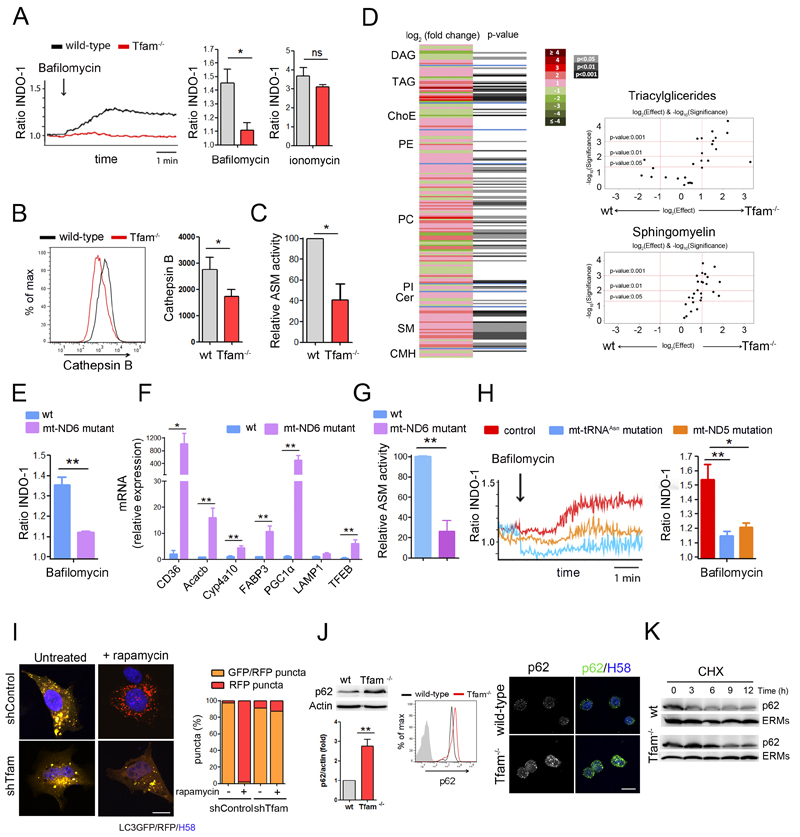
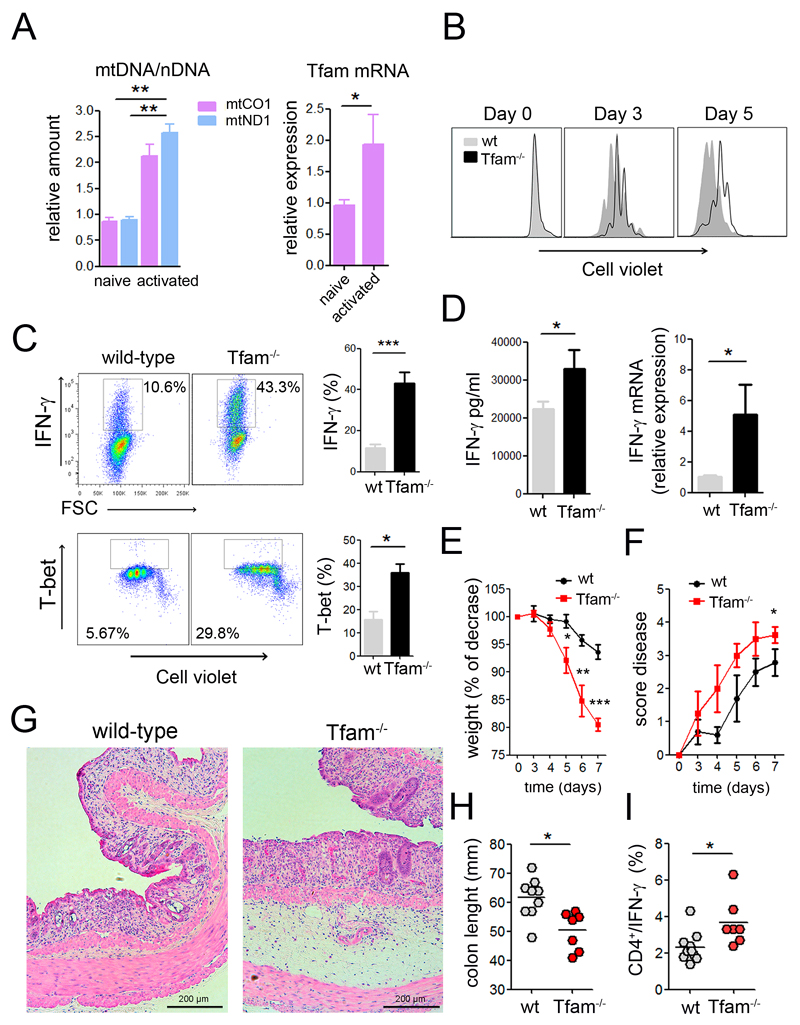
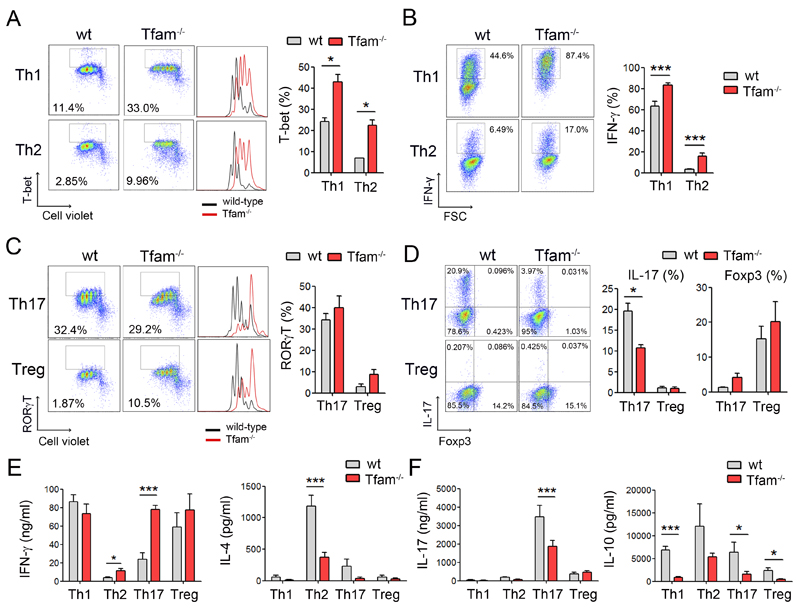
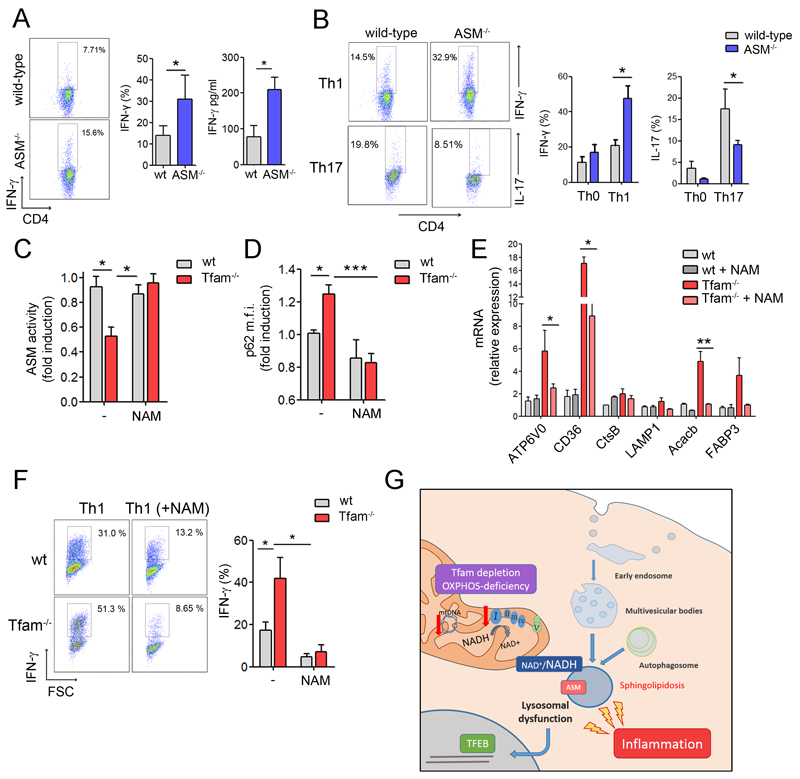
The endolysosomal system is critical for the maintenance of cellular homeostasis. However, how endolysosomal compartment is regulated by mitochondrial function is largely unknown. We have generated a mouse model with defective mitochondrial function in CD4(+) T lymphocytes by genetic deletion of the mitochondrial transcription factor A (Tfam). Mitochondrial respiration deficiency impairs lysosome function, promotes p62 and sphingomyelin accumulation, and disrupts endolysosomal trafficking pathways and autophagy, thus linking a primary mitochondrial dysfunction to a lysosomal storage disorder. The impaired lysosome function in Tfam-deficient cells subverts T cell differentiation toward proinflammatory subsets and exacerbates the in vivo inflammatory response. Restoration of NAD(+) levels improves lysosome function and corrects the inflammatory defects in Tfam-deficient T cells. Our results uncover a mechanism by which mitochondria regulate lysosome function to preserve T cell differentiation and effector functions, and identify strategies for intervention in mitochondrial-related diseases.


Figures

Figure 1
Figure 1. Tfam depletion induces severe mtDNA deficiency in T cells.
(A) Dot plots show CD4 and CD8 expression in thymocytes from wt and Tfam-/- mice. Right, percentage of CD4 and CD8 single positive (SP), and CD4/CD8 double positive (DP) cells. (B) Dot plots show CD4 and CD8 T cells, and CD3 and B220 cells from the spleens. Right, percentages of CD4 and CD8 cells in the spleen, inguinal (ILN) and mesenteric lymph nodes (MLN) (n=11). (C) Expression of cell surface markers in naive CD4 T cells and T-lymphoblasts differentiated with ConA (48 hr) and IL-2 (4 days). (D) Confocal images show the polarization of cytoskeletal components in T lymphoblasts by actin, tubulin and ERM (ezrin-radixin-moesin) staining. Scale bar represents 10μm. (E) Relative Tfam mRNA levels by RT-PCR in naive CD4 T cells (day 0) and during lymphoblast differentiation. (F) Tfam mRNA (left) and protein levels (right) in CD4 T lymphoblasts. (G) mtDNA levels (mtCO1 and mtND1) relative to nuclear DNA (SDH) in CD4 T lymphoblasts. (H) mRNA levels of mtDNA-encoded and genome-encoded mitochondrial subunits. (I) Immunoblot of T lymphoblast mitochondrial proteins. Complex I (CI) was detected with anti-NDUFA9, CII with anti-FpSDH, and CIV with anti-COX1. Tom20 was used as loading control. Data (B, E, F, G, H) are means ± SEM (n > 3); *p<0.05, **p<0.01 and ***p<0.001 (Student’s t-test).
Figure 2
Figure 2. Tfam ablation induces OXPHOS deficiency in T cells
(A) Left, flow cytometry analysis of Mitotracker staining. Right, confocal images of mitochondria (anti-MnSOD), and nuclei HOECHST58 (H58, blue) in T lymphoblasts. Scale bar represents 10μm. (B) Electron microscopy images in T lymphoblasts. (C) Blue-native gel electrophoresis analysis of electron-transport-chain complexes (detection of NDUFA9, FpSDH and Core1 for complexes I, II and III, respectively) from three wt and three Tfam-/- T cell lysates. (D) Combined mitochondrial complex activities in Jurkat T cells. Lines extending from the boxes indicate the variability outside the upper and lower quartiles. (E) Flow cytometry analysis of mROS in T lymphoblasts stained with MitoSOX. Data are presented as the mean fluorescence intensity. (F) Glutamate- and pyruvate-driven ATP-dependent production in Jurkat T cells. (G) Cellular ATP content in wt and Tfam-/- T cells. (H) Immunoblot analysis of AMPK phosphorylation at Thr172 in T lymphoblasts. Actin was used as a loading control. (I) CD3/CD28-activated CD4 T cells fed either with glucose or palmitate (FA) for 2 hr and oxygen consumption rate (OCR) and extracellular acidification rate (ECAR) measured in real time (upper panels). Lower panels show the basal OCR and ECAR from a representative experiment. Data (D, E, F, G) are means ± SEM (n ≥ 3, *p<0.05, Student’s t-test).
Figure 3
Figure 3. Tfam regulates lysosomal biogenesis through TFEB.
(A) Electron microscopy images show the abnormal intracellular accumulation of vesicles in Tfam-/- T lymphoblasts. (B) Flow cytometry analysis of EEA1, HRS, LBPA, LAMP1 and lysotracker content in CD4 T lymphoblasts. Results show mean fluorescence intensity (m.f.i.) (n=3). (C) Confocal images of HRS, LBPA, and LAMP1 in T lymphoblasts. Nuclei were stained with HOECHST58 (H58, blue). Scale bar represents 10μm. (D) Confocal images of TFEB (green), LAMP1 (red), H58 (blue) in Oli-Neu cells. Right, quantification of nuclear TFEB m.f.i. (E) Western blot analysis of TFEB subcellular location. Cytosolic and nuclear fractions of Jurkat cells were blotted for TFEB, tubulin, and histone 2A (H2A). Chart shows densitometry analysis of the ratio of nuclear TFEB to H2A (n=3). (F) Relative mRNA levels of TFEB and target genes in T lymphoblasts by RT-PCR (n=5). Data (B, D, E, F) are means ± SEM; *p<0.05, **p<0.01 and ***p<0.001 (Student’s t-test).
Figure 4
Figure 4. Tfam controls lysosomal function.
(A) Lysosomal calcium mobilization in T lymphoblasts loaded with Indo-1, treated with bafilomycin-A1 and detected by flow cytometry. The 340/380 nm ratio is shown. Right, quantification of Indo-1 signal in bafilomycin-A1- or ionomycin-treated cells relative to the basal level. (B) Histograms and quantification of Cathepsin B activity measured by flow cytometry (MagicRed). (C) Acid sphingomyelinase (ASM) activity in T lymphocytes. (D) Heatmap represents cell lipidomic signatures of T cells (n = 3). More intense colors indicate larger drops (green) or elevations (red) of the metabolite levels in Tfam-/- samples. DAG, diacylglycerides; TAG, triacylglycerides; ChoE, cholesteryl esters; PE, phosphatidylethanolamines; PC, phosphatidylcholines; PI; phosphatidylinositols; Cer, ceramides; SM, sphingomyelins; CMH, monohexosylceramides. Right, volcano plots [log10(p-value) vs. log2(fold change)] for the comparison of Tfam-/- and wt T cells for the indicated metabolites. (E) Lysosomal calcium in mt-ND6 Complex I (CI) mutant and wt fibroblasts treated as in A. Ratio of Indo-1 signal upon bafilomycin-A1 treatment relative to the basal level. (F) Relative mRNA levels of TFEB and selected target genes in wt and mt-ND6 mutant fibroblasts assessed by RT-PCR. (G) ASM activity in wt and mt-ND6 mutant fibroblasts. (H) Lysosomal calcium in fibroblasts from patients with point mutation in CI subunit mt-ND5 gene (m.13513G>A), point mutation in the mt-tRNAAsn gene (m.5658T>C) or control samples assessed as in A. (I) Left, confocal images show Oli-Neu transfected with LC3-GFP-RFP treated or not with rapamycin. Right, graph shows percentage of GFP/RFP puncta (yellow vesicles) and RFP puncta (red vesicles) from at least 100 vesicles in two independent experiments. (J) Analysis of p62 by western blot, flow cytometry and confocal immunofluorescence in T lymphoblasts. Chart shows densitometry analysis of p62 by western blot. (K) Western blot analysis of p62 protein turnover in cells treated with cycloheximide for the indicated times. ERMs are used as loading control. Data (A, B, C, E, F, G, H, J) are means ± SEM, n ≥3; *p<0.05 and **p<0.01 (Student’s t-test). Scala bars represent 10 μm.
Figure 5
Figure 5. Inhibition of OXPHOS exacerbates inflammatory responses in vitro and in vivo.
(A) Relative mtDNA and Tfam mRNA levels in naive and CD3/CD28 activated CD4 T cells. (B) Cell proliferation analysis by Cell Violet dilution of CD4 T cells activated with CD3/CD28. (C, D) CD4 T cells were activated with CD3/CD28 (6 days), and IFN-γ and T-bet intracellular levels were measured by flow cytometry (C), IFN-γ secretion by ELISA and relative IFN-γ mRNA levels by RT-PCR (D). (E) Weight and (F) disease score were monitored for the indicated times in mice fed with 3% dextran sulfate sodium (DSS) in the drinking water. H&E staining of colon sections (G) and colon length (H) on day 7 after DSS treatment. (I) IFN-γproducing CD4 T cells in the mesenteric lymph nodes. Data are means ± SEM, (A, C, D, n≥3), (E-I, at least seven mice in two independent experiments); *p<0.05 and **p<0.01, ***p<0.001 (Student’s t-test).
Figure 6
Figure 6. Mitochondrial dysfunction subverts T cell differentiation toward Th1 cell subsets.
(A) Cell Violet dilution and T-bet expression in CD4 T cells cultured under Th1 and Th2 conditions over 3 days. Chart shows percentage of T-bet expressing cells (n=3). (B) Intracellular flow cytometry analysis of IFN-γ-producing cells under Th1 and Th2 conditions over 6 days. Graph, quantification of IFN-γ-producing cells (n=6). (C) Naive CD4 T cells were cultured under Th17 and Treg conditions over 3 days. Dot plots show RORγT-expressing cells and histograms show cell proliferation assessed by Cell Violet dilution. Chart shows percentage of RORγT-expressing cells (n=3). (D) Intracellular flow cytometry analysis of CD4 T cells producing IL-17 and Foxp3. Chart shows percentage of IL-17 and Foxp3-producing cells (n=6). (E, F) Polarized CD4 T cells at day 6 were cultured in equal numbers in fresh medium followed by activation with PMA/ionomycin for 16 hr. Cytokines were measured by ELISA in the supernatants. Data are means ± SEM (n ≥ 3); *p<0.05, **p<0.01 and ***p<0.001 (Student’s t-test).
Figure 7
Figure 7. Increasing NAD+ levels improves lysosome function and reduces inflammatory responses in Tfam-deficient cells.
(A) Dot plots show intracellular IFN-γ levels by flow cytometry in CD4 T cells activated with CD3/CD28 (6 days). Graphs show percentage of IFN-γ-producing cells and IFN-γ levels in the supernatant by ELISA. (B) CD4 T lymphocytes cultured under Th0, Th1 and Th17 condition for 6 days. Flow cytometry analysis of the frequency of CD4 T cells producing IFN-γ and IL-17. (C) ASM activity and (D) flow cytometry analysis of p62 levels in T-lymphoblasts treated with NAM (10mM) for 2 days. (E) Relative mRNA levels of TFEB target genes in wt and Tfam-/- T cells incubated or not with NAM. (F) CD4 T cells cultured towards Th1 in the presence or absence of NAM for 3 days. Flow cytometry analysis of the frequency of CD4 T cells producing IFN-γ. (G) Diagram representing the proposed mechanism. Data are means ± SEM (n≥3); *p<0.05, **p<0.01 and ***p<0.001 (Student’s t-test).

References

    1. Acin-Perez R, Carrascoso I, Baixauli F, Roche-Molina M, Latorre-Pellicer A, Fernandez-Silva P, Mittelbrunn M, Sanchez-Madrid F, Perez-Martos A, Lowell CA, et al. ROS-Triggered Phosphorylation of Complex II by Fgr Kinase Regulates Cellular Adaptation to Fuel Use. Cell Metab. 2014;19:1020–1033. - PMC - PubMed
    1. Arruda AP, Pers BM, Parlakgul G, Guney E, Inouye K, Hotamisligil GS. Chronic enrichment of hepatic endoplasmic reticulum-mitochondria contact leads to mitochondrial dysfunction in obesity. Nat Med. 2014;20:1427–1435. - PMC - PubMed
    1. Cerutti R, Pirinen E, Lamperti C, Marchet S, Sauve AA, Li W, Leoni V, Schon EA, Dantzer F, Auwerx J, et al. NAD(+)-dependent activation of Sirt1 corrects the phenotype in a mouse model of mitochondrial disease. Cell Metab. 2014;19:1042–1049. - PMC - PubMed
    1. Chang CH, Curtis JD, Maggi LB, Jr, Faubert B, Villarino AV, O'Sullivan D, Huang SC, van der Windt GJ, Blagih J, Qiu J, et al. Posttranscriptional control of T cell effector function by aerobic glycolysis. Cell. 2013;153:1239–1251. - PMC - PubMed
    1. Daniele T, Hurbain I, Vago R, Casari G, Raposo G, Tacchetti C, Schiaffino MV. Mitochondria and melanosomes establish physical contacts modulated by Mfn2 and involved in organelle biogenesis. Curr Biol. 2014;24:393–403. - PubMed

Publication types

MeSH terms

Substances