. 2015 Sep 1;12(9):1430-44.
doi: 10.1016/j.celrep.2015.07.050. Epub 2015 Aug 20.

Presenilin 1 Maintains Lysosomal Ca(2+) Homeostasis via TRPML1 by Regulating vATPase-Mediated Lysosome Acidification

Affiliations

Presenilin 1 Maintains Lysosomal Ca(2+) Homeostasis via TRPML1 by Regulating vATPase-Mediated Lysosome Acidification

Ju-Hyun Lee et al. Cell Rep. .

Abstract

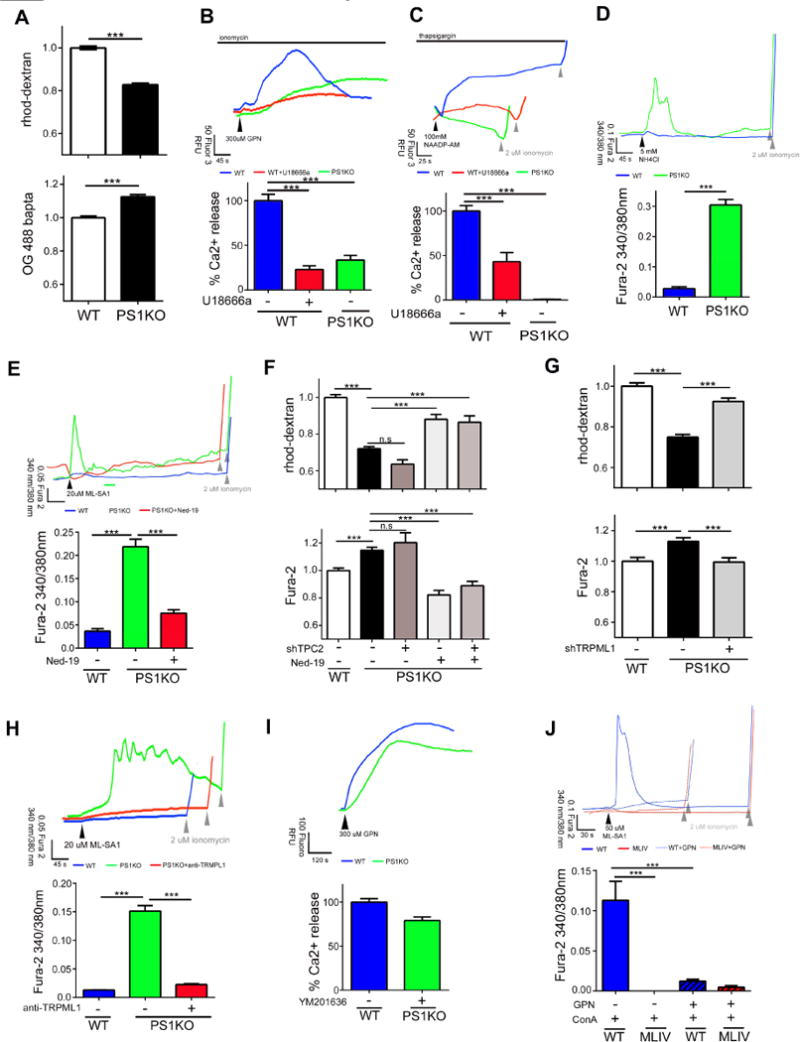
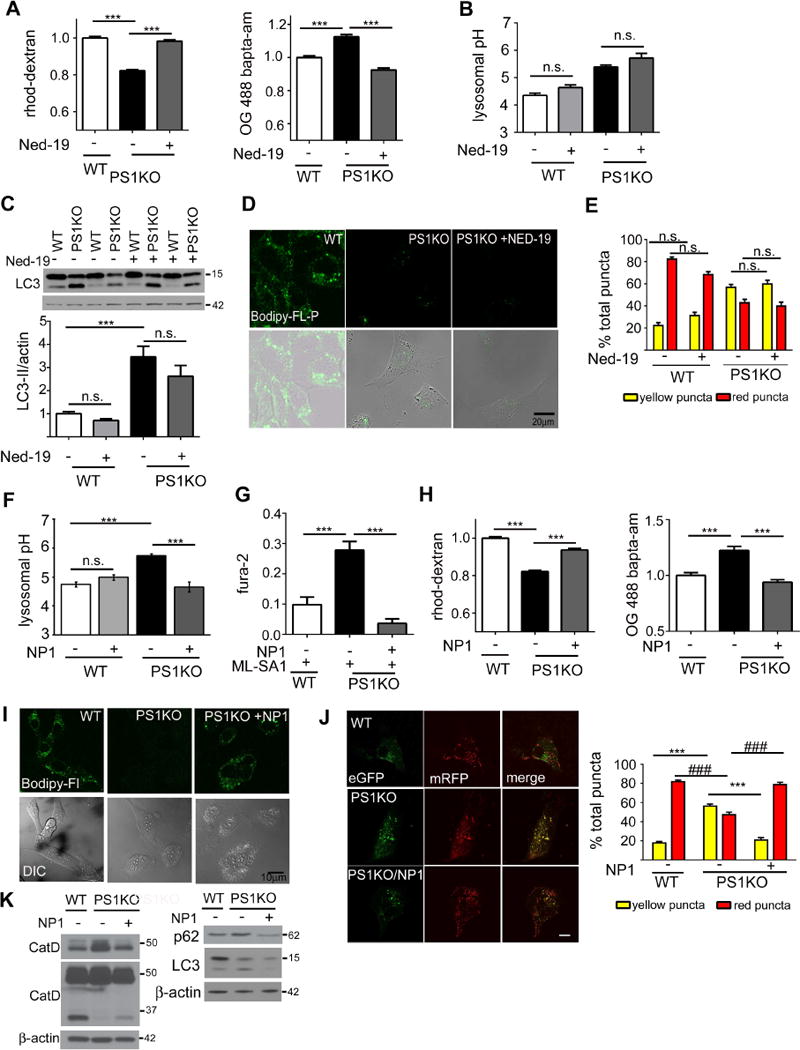
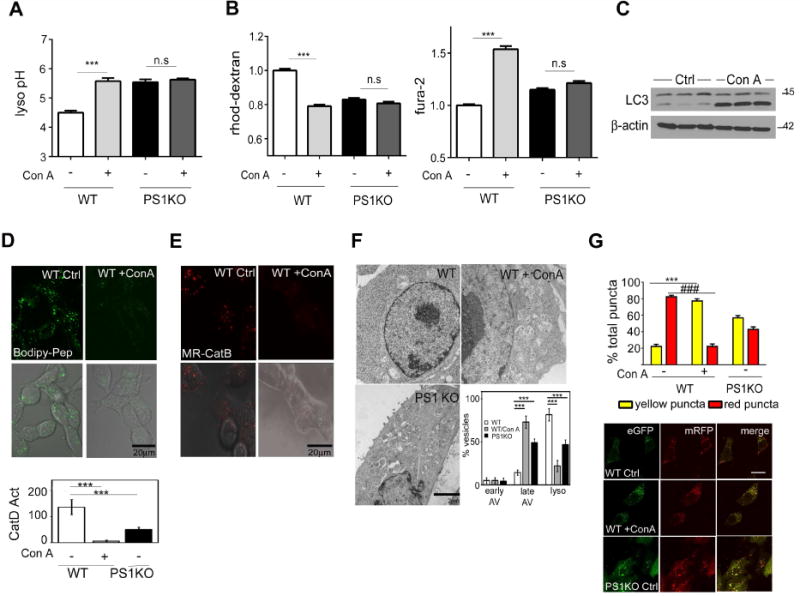
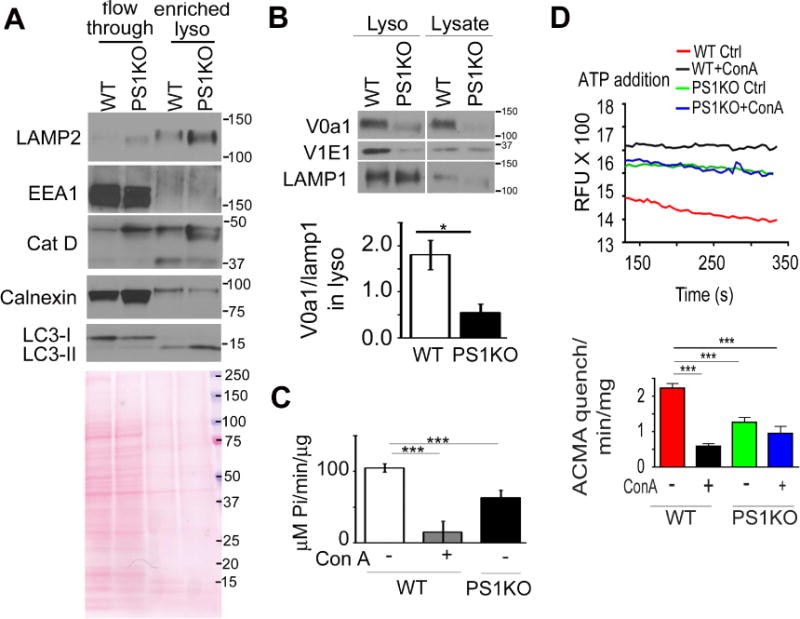
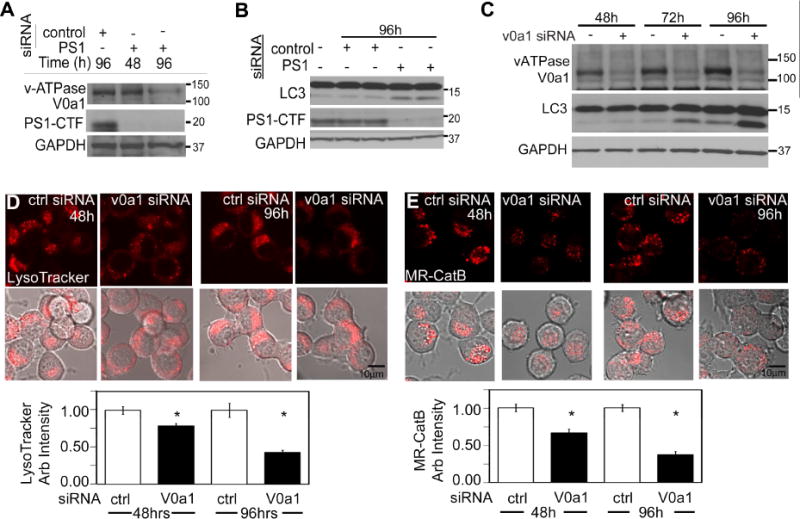
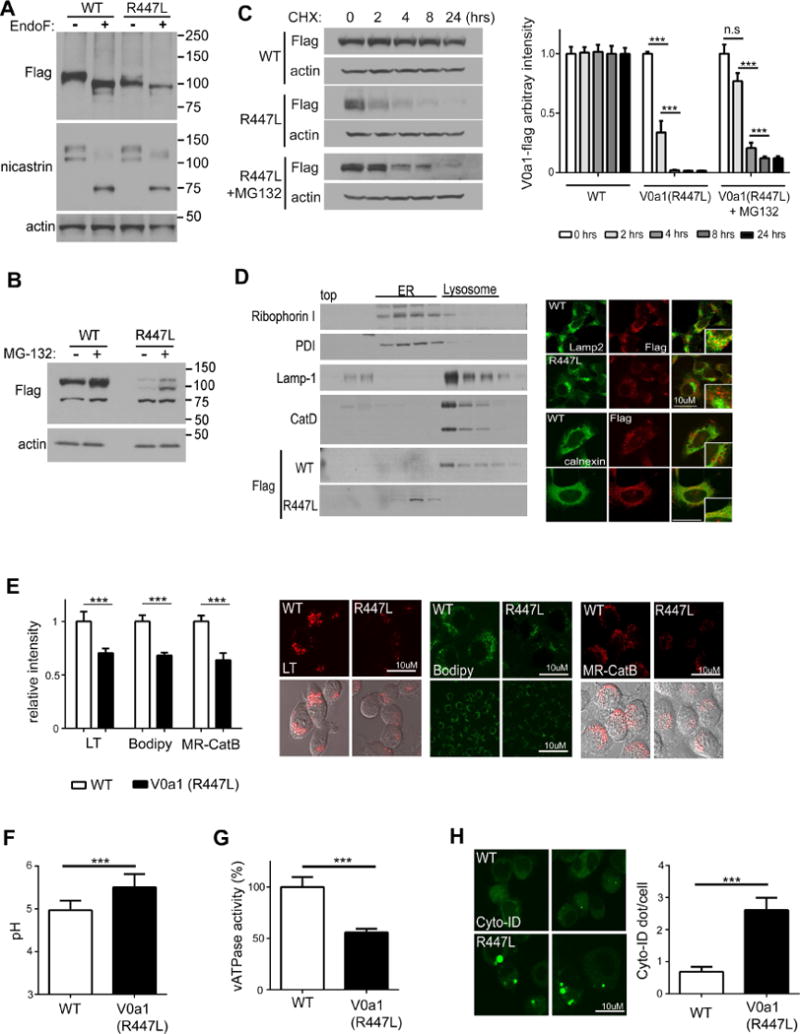
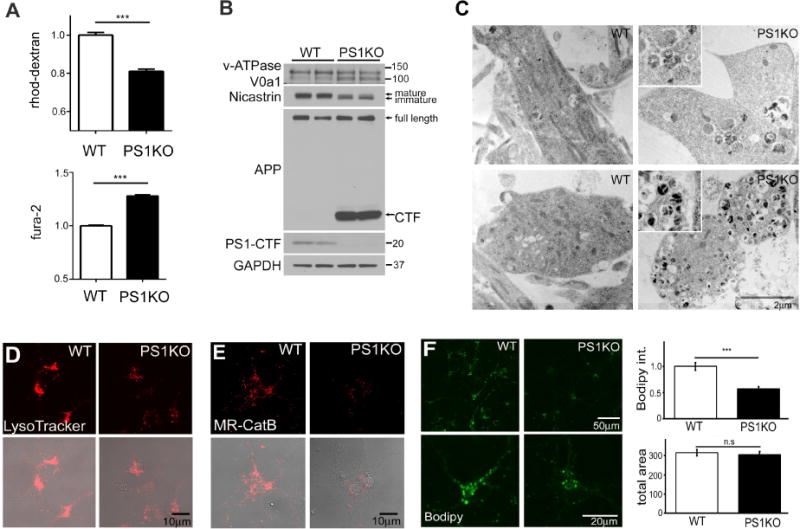
Presenilin 1 (PS1) deletion or Alzheimer's disease (AD)-linked mutations disrupt lysosomal acidification and proteolysis, which inhibits autophagy. Here, we establish that this phenotype stems from impaired glycosylation and instability of vATPase V0a1 subunit, causing deficient lysosomal vATPase assembly and function. We further demonstrate that elevated lysosomal pH in Presenilin 1 knockout (PS1KO) cells induces abnormal Ca(2+) efflux from lysosomes mediated by TRPML1 and elevates cytosolic Ca(2+). In WT cells, blocking vATPase activity or knockdown of either PS1 or the V0a1 subunit of vATPase reproduces all of these abnormalities. Normalizing lysosomal pH in PS1KO cells using acidic nanoparticles restores normal lysosomal proteolysis, autophagy, and Ca(2+) homeostasis, but correcting lysosomal Ca(2+) deficits alone neither re-acidifies lysosomes nor reverses proteolytic and autophagic deficits. Our results indicate that vATPase deficiency in PS1 loss-of-function states causes lysosomal/autophagy deficits and contributes to abnormal cellular Ca(2+) homeostasis, thus linking two AD-related pathogenic processes through a common molecular mechanism.


Figures

Figure 1
Figure 1. TRMPL1 mediates lysosomal Ca2+ efflux in PS1 KO cells
(A) Lysosomal Ca2+ is reduced (WT: n=336; PS1KO n=338) and cytosolic Ca2+ is elevated in PS1KO cells (WT: n=148; PS1KO n=150). (B) Cells were treated with 5μM ionomycin followed by GPN (300 μM) to measure lysosomal Ca2+ levels Less Ca2+ is released from PS1KO (n=18) cells WT cells treated for 24 hrs with 2μg/ml U18666a (n=33) release less lysosomal Ca2+. (C) Compared to WT (n=67), PS1KO cells (n=93) released minimal Ca2+ after 1 μM thapsigargin followed by NAADP-AM (100 nM) (arrowhead). Ca2+ release was significantly lowered in WT cells treated with U18666a (n=25). (D) Addition of 5mM NH4Cl increased cytosolic Ca2+ in PS1KO (n=64) but not WT cells (n=125). (E) 20μM ML-SA1 (black arrowhead) elevated cytosolic Ca2+ levels in PS1KO (n=151) but not WT cells (n=206) and this elevation was diminished by Ned-19 (0.5μM, 24hrs; n=167) (Gray arrowheads indicate ionomycin addition). (F) 72 hr shRNA TPC2KD had no discernible effect on lysosomal or cytosolic Ca2+ levels in PS1KO cells (n>90). 0.5μM Ned-19 (24hrs) restored lysosomal and cytosolic Ca2+ levels even when TPC2 was knocked down (G) 72hr knockdown of TRPML1 significantly elevated lysosomal Ca2+ and decreased cytosolic Ca2+ in PS1KO cells (H) Anti-TRMPL1 antibody (16h, 5μg/ml) inhibited ML-SA1 mediated lysosomal Ca2+ release in PS1KO cells (n=60). (I) Lysosomal Ca2+ levels determined using GPN are almost normalized in PS1KO cells after 10μM YM201636 for 1hr via reduced Ca2+ flux through TRPML1 (n=100). (J) ConA followed by ML-SA1 induced a rise in cytosolic Ca2+ in WT (n=33) but not MLIV fibroblasts (n=29) imaged in a Ca2+ free buffer Osmotic lysis of lysosomes with GPN prior to ML-SA1 abolished Ca2+ release in WT (n=11) and MLIV cells (n=17). ***p<0.0001. Error bars: ±S.E.M
Figure 2
Figure 2. Restoring normal lysosomal pH, but not lysosomal Ca2+ homeostasis alone, rescues lysosomal deficits and autophagy
(A) Ned-19 (0.5μM, 24hrs) elevated lysosomal Ca2+ (WT n=453; PS1KO n=461; PS1KO/Ned-19 n=522) and decreased cytosolic Ca2+ levels in PS1KO cells (WT n=148; PS1KO n=150; PS1KO/Ned-19 n=150). (B) Ned-19 does not alter lysosomal pH in WT or PS1KO cells (n=9 each). (C) Ned-19 does not reduce elevated LC3-II levels in PS1KO cells (n=11) or (D) increase in situ CatD activity (n=3). Scale bars 20μm (E) PS1KO and WT cells transiently transfected for 48 hrs with EGFP-mRFP LC3, showed no change in percentages of yellow or red puncta after 0.5 μM Ned-19 for 24hrs (F) Uptake of lysosome-targeted NP-1 acidic nanoparticles (24 hrs, 1mg/ml) in PS1KO cells restored normal lysosomal pH (n=6) and (G) lowered ability of ML-SA1 to elevate cytosolic Ca2+ (WT n=180; PS1KO n=186; PS1KO/NP1 n=237). (H) NP-1 also elevated lysosomal Ca2+ levels (WT n=318; PS1KO n=305; PS1KO/NP1 n=313) and lowered cytosolic Ca2+ in PS1KO cells (WT n=148; PS1KO n=150; PS1KO/NP1 n=150). (I) NP-1 normalized levels of Cat D activity, (J) NP-1 reduced yellow puncta, and increased red puncta, in PS1KO cells, indicating restored autophagic flux Scale bars 10μM * p <0.05, ***/### p<0.0001. (K) NP-1 increased mature CatD levels and reduced elevated LC3-II/p62 levels in PS1KO cells Error bars: ±S.E.M
Figure 3
Figure 3. Inhibition of VATPase function induces a PS1KO-like defective autophagy phenotype
(A) ConA (50nM, 24hrs) elevated lysosomal pH in WT (n=6 each), but had no effect on PS1KO cells (B) ConA decreased lysosomal Ca2+ (WT n=155; WT/ConA n=153) and elevated cytosolic Ca2+ (WT n=154; WT/ConA n=152) in WT but had no significant effect on Ca2+ levels in PS1KO cells (PS1 n=153 and 164; PS1/ConA n=161 and 151, lyso and cyto). (C) Con A elevated LC3-II levels, decreased in vivo and in vitro CatD enzyme activities and CatB activity (D, E respectively), and (F) increased late autophagic vacuole accumulation while decreasing lysosome number (n=25). (G) ConA (50nM) elevated yellow puncta, and markedly decreased red puncta in EGFP-mRFP-LC3 cells Scale bars 10μm * p<0.05, ***/### p<0.0001. Error bars: ±S.E.M
Figure 4
Figure 4. PS1KO lysosomes are markedly deficient in vATPase V0al subunit and vATPase activity
(A) In highly enriched lysosomes from PS1KO cells, (B) V0al subunit levels were decreased (n=3), (C) ATP hydrolysis activity was reduced and (D) proton translocation ability of vATPase was decreased ConA treatment of WT cells for 24 hr prior to lysosomal enrichment decreased proton translocation, but had no effect in PS1KO cells* p<0.05, *** p<0.0001. Error bars: S.E.M
Figure 5
Figure 5. vATPase V0a1 knockdown inhibits lysosomal acidification
PS1 siRNA in WT cells decreased V0a1 levels (A) and increased LC3-II (B). (C) Levels of LC3-II were increased after V0a1 subunit siRNA treatment LysoTracker intensity (n=55) (D) and CatB activity (n=30) (E) decreased after V0a1 siRNA Scale bars 10 μm * p<0.05. Error bars: S.E.M
Figure 6
Figure 6. The mutant protein construct V0a1R447L-flag is not glycosylated and is degraded in N2a cells
(A) Cell lysates were immunoblotted with anti-flag antibody followed by PNGase F treatment Nicastrin blots provided as a positive control for PNGase treatments (B) Cell lysates were immunoblotted with anti-flag antibody followed by proteasome inhibitor (MG-132) treatment for 24 hrs (C). Cell lysates were immunoblotted with anti-flag antibody followed by CHX treatment for the indicated time Cell lysates form V0a1R447L-flag were pre-incubated with MG-132 for 24 hrs then treated with CHX for the indicated time Levels of V0a1-flag were quantified Results were plotted as ratios normalized to the non-treated sample per each cell line (D) Immunoblot of V0a1-flag distribution in subcellular fractions of V0a1WT-flag and V0a1R447L-flag ER marker proteins (Ribophorin-I and PDI) primary localized infractions 5–11 and lysosomal marker proteins (LAMP-1 and mature CatD) mainly in fractions 13–17. Double-immunostaining showed strong colocalization of V0a1-flag and LAMP-2 in V0a1WT -flag cells, whereas V0a1R447L-flag strongly colocalized with ER marker calnexin Scale bar 10 μm (E) Cells were incubated with LysoTracker for lysosomal acidification assay To access the in vivo lysosomal enzyme activity, cells were incubated with Bodipy-FL-pepstatin A and MR-CatB for CatD and CatB activity, respectively Scale bar 10 μm Intensity of signal was quantified (LT: n=60, Bodipy: n=50, MR-CatB: n=55). Results were plotted as ratios normalized to V0a1WT-flag (F) Lysosomal pH values were measured ratiometrically using LysoSensor Yellow/Blue-dextran (n=10, at least 6 × 10³ cells/n). (G) v-ATPase activity was reduced in V0a1R447Lcells (H) Autophagosomes were immunolabeled with Cyto-ID autophagy detection kit Results were plotted as mean of AV (Cyto-ID) puncta number per cells (n=80). Scale bar 10 μm * denotes p<0.05, ** denotes p<0.001, *** denotes p<0.0001. Error bars: ±S.E.M
Figure 7
Figure 7. Lysosomal Ca2+, acidification, and enzyme activities are reduced in PS1KO neurons
(A) Lysosomal Ca2+ (WT n=180; PS1KO n=181) was reduced and cytosolic Ca2+ (n=20) was elevated in PS1KO neurons In PS1KO neurons, (B) maturation of V0a1 and nicastrin was decreased and APP-CTF levels were increased; (C) AVs accumulate in both cell bodies and axons; (D) LysoTracker signal and in vivo CatB (E) and CatD (n=28) (F) activities were decreased Scale bars 10μm *** p<0.0001. Error bars: S.E.M

References

    1. Avrahami L, Farfara D, Shaham-Kol M, Vassar R, Frenkel D, Eldar-Finkelman H. Inhibition of glycogen synthase kinase-3 ameliorates beta-amyloid pathology and restores lysosomal acidification and mammalian target of rapamycin activity in the Alzheimer disease mouse model: in vivo and in vitro studies. J Biol Chem. 2013;288:1295–1306. - PMC - PubMed
    1. Baltazar GC, Guha S, Lu W, Lim J, Boesze-Battaglia K, Laties AM, Tyagi P, Kompella UB, Mitchell CH. Acidic nanoparticles are trafficked to lysosomes and restore an acidic lysosomal pH and degradative function to compromised ARPE-19 cells. PLoS One. 2012;7:e49635. - PMC - PubMed
    1. Bhargava A, Voronov I, Wang Y, Glogauer M, Kartner N, Manolson MF. Osteopetrosis mutation R444L causes endoplasmic reticulum retention and misprocessing of vacuolar H+-ATPase a3 subunit. J Biol Chem. 2012;287:26829–26839. - PMC - PubMed
    1. Butler D, Hwang J, Estick C, Nishiyama A, Kumar SS, Baveghems C, Young-Oxendine HB, Wisniewski ML, Charalambides A, Bahr BA. Protective effects of positive lysosomal modulation in Alzheimer’s disease transgenic mouse models. PLoS One. 2011;6:e20501. - PMC - PubMed
    1. Calcraft PJ, Ruas M, Pan Z, Cheng X, Arredouani A, Hao X, Tang J, Rietdorf K, Teboul L, Chuang KT, et al. NAADP mobilizes calcium from acidic organelles through two-pore channels. Nature. 2009;459:596–600. - PMC - PubMed

Publication types