. 2015 Aug 6:9:290.
doi: 10.3389/fncel.2015.00290. eCollection 2015.

GABAA receptor activity shapes the formation of inhibitory synapses between developing medium spiny neurons

Affiliations

GABAA receptor activity shapes the formation of inhibitory synapses between developing medium spiny neurons

Jessica Arama et al. Front Cell Neurosci. .

Abstract

Basal ganglia play an essential role in motor coordination and cognitive functions. The GABAergic medium spiny neurons (MSNs) account for ~95% of all the neurons in this brain region. Central to the normal functioning of MSNs is integration of synaptic activity arriving from the glutamatergic corticostriatal and thalamostriatal afferents, with synaptic inhibition mediated by local interneurons and MSN axon collaterals. In this study we have investigated how the specific types of GABAergic synapses between the MSNs develop over time, and how the activity of GABAA receptors (GABAARs) influences this development. Isolated embryonic (E17) MSNs form a homogenous population in vitro and display spontaneous synaptic activity and functional properties similar to their in vivo counterparts. In dual whole-cell recordings of synaptically connected pairs of MSNs, action potential (AP)-activated synaptic events were detected between 7 and 14 days in vitro (DIV), which coincided with the shift in GABAAR operation from depolarization to hyperpolarization, as detected indirectly by intracellular calcium imaging. In parallel, the predominant subtypes of inhibitory synapses, which innervate dendrites of MSNs and contain GABAAR α1 or α2 subunits, underwent distinct changes in the size of postsynaptic clusters, with α1 becoming smaller and α2 larger over time, while both the percentage and the size of mixed α1/α2-postsynaptic clusters were increased. When activity of GABAARs was under chronic blockade between 4-7 DIV, the structural properties of these synapses remained unchanged. In contrast, chronic inhibition of GABAARs between 7-14 DIV led to reduction in size of α1- and α1/α2-postsynaptic clusters and a concomitant increase in number and size of α2-postsynaptic clusters. Thus, the main subtypes of GABAergic synapses formed by MSNs are regulated by GABAAR activity, but in opposite directions, and thus appear to be driven by different molecular mechanisms.

Keywords: GABAA receptor depolarization; GABAA receptors; GABAergic synapses; hyperpolarizing shift; striatal medium spiny neuron.


Figures

Figure 1
Figure 1
Embryonic (E17) medium spiny neurons (MSNs) form a homogenous population of GABAergic neurons in vitro. (A) Cultures are almost 100% immunoreactive for the neurotransmitter GABA (green; DIC image was overlaid on top. Scale bar = 50 μm). (B) Glial fibrillary acidic protein (GFAP)-positive astrocytes (red) are present in cultures but only in small numbers compared to total number of cells assessed by the nuclear stain TO-PRO (blue). Scale bar = 50 μm. (C) Image of a MSN showing the intracellular staining for GABA (green) and the cell surface staining for GABAA receptor β2/3 subunits (red). Scale bar = 10 μm. Representative images from two independent experiments.
Figure 2
Figure 2
Developmental changes in embryonic MSNs from 7 to 14 days in vitro (DIV). (A) Expression of Dopamine- and cAMP-regulated phosphoprotein, Mr 32 kDa (DARPP-32, red), detected in MSNs labeled with MAP2-specific antibody (green) and nuclear stain TO-PRO, is prominently increased from 7 (left) to 14 (right) DIV. Scale bar = 20 μm. (B) Increase in the number of synaptic contacts (yellow, small right panel) received by MSNs cultured from 7 (left) to 14 (right) DIV, as detected by colocalization of immunolabeled postsynaptic GABAA receptor β2/3 subunit clusters (red, small middle panel), and presynaptic vesicular inhibitory amino acid transporter (VIAAT)-1 terminals (green, small left panel). Representative images from three independent experiments. Scale bar = 20 μm (upper panels).
Figure 3
Figure 3
Dual whole-cell recordings and firing characteristics of synaptically connected MSNs. The MSNs recordings were carried out at 14 DIV. (A) Single sweep inhibitory postsynaptic currents (IPSCs; lower traces; Vm = −70 mV) elicited by single spikes in the presynaptic MSN (upper trace). (B) Average IPSCs elicited by single spikes at 0.3 Hz, or 2 Hz (red), with standard deviation time course (SDTC, gray). The 0.3 Hz and 2 Hz average scaled and superimposed (lower traces; scale bar 8 pA for the 0.3 Hz). The similar time course of average and SDTC, and of averages obtained at different firing rates, indicates that all events included had a similar shape. (C) Average IPSCs elicited by two spike pairs. Average spontaneous IPSCs (sIPSCS, blue) with SDTC (gray) scaled and superimposed (5 pA scale bar; lower traces). (D) A near tonically firing MSN responding to sequential depolarizing current pulses, recorded at 14 DIV. Single sweeps of the responses of the simultaneously recorded postsynaptic MSN are shown below. (E) A MSN recorded at 16 DIV, displays more mature burst-firing behavior than the cell recorded at 14 DIV. Longer depolarizing current pulses elicit repetitive bursts (lower two records). (F) Response to 150 pA current injection in 7 DIV MSN.
Figure 4
Figure 4
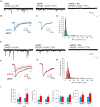
(A–C,E–G) IPSCs in developing MSNs. (A) Representative recordings of sIPSCs in 7–8 DIV MSNs (left trace) in the presence of DNQX/D-AP5, and, following tetrodotoxin (TTX) application (1 μM), of mIPSCs, in the absence (middle trace) or presence (right trace) of bicuculline (Bic; 10 μM). The sensitivity to Bic (10 μM, right trace) of the mIPSCs confirms that these currents were mediated by GABAA receptors. (B,C) Superimposed ensemble averages of IPSCs and mIPSCs in (B) and scaled averages in (C) to compare time course demonstrate that all sIPSCs and mIPSCs in 7–8 DIV MSNs were similar in shape. (D) Histogram showing amplitude distributions for mIPSCs (blue) and sIPSCs (white bars). (E) Recordings of sIPSCs in 12–14 DIV MSNs (left trace) in the presence of DNQX/D-AP5, and, following TTX application (1 μM), of mIPSCs, in the absence (middle trace) or presence (right trace) of Bic (10 μM). (F,G) Superimposed ensemble averages of spontaneous (black) and miniature (red) IPSCs in (F) and scaled averages in (G) to compare time course demonstrate that all sIPSCs and mIPSCs in 12–17 DIV MSNs were similar in shape. (H) IPSC amplitude distributions for mIPSCs (red) and sIPSCs (white bars). For averaged records (B,C,F,G) only those events that did not overlap with other incoming events caused by repetitive firing properties of MSNs were selected, while histograms (D,H) represent distributions of mIPSC and sIPSC amplitudes of all the events recorded from a representative cell. (I) Bar graphs representing amplitudes (far left), frequencies (left), rise times (right) and half-width measurements (far right) of responses. sIPCSs and mIPSCs amplitudes were increased from 7–8 DIV (n = 6) to 12–17 DIV (n = 5; *p < 0.05, Two sample t-test).
Figure 5
Figure 5
Developmental changes in GABAergic MSN synapses. (A,B) Immunolabeling of GABAA receptor α1- (i,ii,vii; pink), α2-(iii,iv,vii; green), α1/α2- (v,vi,vii; white) subunit-containing GABAA receptor clusters, and presynaptic GABAergic terminals (ii,iv,vi,vii; red) along the primary dendrites of 7 and 14 DIV MSNs, respectively. (i–vi) Scale bar = 5 μm. (vii) Scale bar = 10 μm. (C) Increase in the number of GABAergic terminals making connections with primary dendrites of MSNs from 7 to 14 DIV (n = 23 dendrites at 7 DIV, n = 18 dendrites at 14 DIV). (D–F) Changes in the number (left panel), percentage (middle panel) and size (right panel) of synaptic α1-, α2-, and α1/α2-clusters, respectively, along the primary dendrites of MSNs from 7 to 14 DIV. The box plots display the median and IQRs of indicated synaptic parameters measured along the first 20 μm of primary dendrites (n = 45 dendrites at 7 DIV, n = 48 dendrites at 14 DIV) of total of n = 16 neurons from two independent experiments. Statistical analysis was performed using Mann Whitney test, *p < 0.05.
Figure 6
Figure 6
Developmental changes in gephyrin clustering at GABAergic synapses of MSNs. (A,B) Immunolabeling of gephyrin clusters (i–iv; red) and α1- (ii; pink), α2- (iii; green) and α1/α2- (iv; white) subunit-containing clusters along the primary dendrites of 7 and 14 DIV MSNs, respectively. (i) Scale bar = 10 μm. (ii–iv) Scale bar = 5 μm. (C,D) Increase in the number and size, respectively, of gephyrin clusters along the primary dendrites of MSNs from 7 to 14 DIV. (E,F,G) Increase in the percentage of gephyrin clusters colocalized with GABAAR α1-, α2- and α1/α2- clusters, respectively, along the primary dendrites of MSNs from 7 to 14 DIV. The box plots display the median and IQRs of indicated synaptic parameters measured along the first 20 μm of primary dendrites (n = 78 dendrites at 7 DIV, n = 70 dendrites at 14 DIV) of total of n = 16 neurons from two independent experiments. Statistical analysis was performed using Mann Whitney test, *p < 0.05.
Figure 7
Figure 7
Developmental switch in GABAA receptor signaling in MSNs. (A,B) Changes in intracellular Ca2+ in response to muscimol (50 μM), KCl (60 mM), ionomycin (5 μM) and EGTA (1 mM) in 5–7 DIV and 12–14 DIV MSNs, respectively, measured by fluorescent microscopy. (C) The histogram shows the maximum increase in ΔF for control and muscimol alone or in the presence of bicuculline (+ Bic) or picrotoxin (+ Pic), normalized to the peak response to KCl application. Bars represent mean ± s.e.m. Statistical analysis was performed using ANOVA, *p < 0.01, **p < 0.001.
Figure 8
Figure 8
GABAA receptor activity has no influence on synapse formation between immature MSNs. (A,B) Immunolabeling of GABAA receptor α1- (i,ii; pink), α2- (iii,iv; green), α1/α2- (v,vi; white) subunit-containing clusters, and presynaptic GABAergic terminals (ii, iv, vi; red) along the primary dendrites of 7 DIV MSNs in the presence of vehicle control dimethy sulfoxide (DMSO) or Bic (25 μM), respectively. (i–vi) Scale bar = 5 μm. (C) The number of GABAergic terminals forming connections with primary dendrites of MSNs (n = 43 dendrites in DMSO/controls, n = 50 dendrites in Bic-treated cultures). (D–F) The number, percentage and size of synaptic α1-, α2- and α1/α2-clusters, respectively, along the primary dendrites of MSNs. The box plots display the median and IQRs of indicated synaptic parameters measured along the first 20 μm of primary dendrites (n = 49 dendrites in DMSO/controls, n = 46 dendrites in Bic-treated cultures) of total of n = 16 neurons from two independent experiments. Statistical analysis was performed using Mann Whitney test, *p < 0.05.
Figure 9
Figure 9
GABAA receptor activity regulates synapse formation between mature MSNs. (A, B) Immunolabeling of GABAA receptors α1- (i,ii; pink), α2- (iii,iv; green), α1/α2- (v,vi; white) subunit-containing clusters, and presynaptic GABAergic terminals (ii,iv,vi; red) along the primary dendrites of 14 DIV MSNs in the presence of vehicle control dimethy sulfoxide (DMSO) or Bic (25 μM), respectively. (i–vi) Scale bar = 5 μm. (C) The number of GABAergic terminals forming connections with primary dendrites of MSNs (n = 74 dendrites in DMSO/controls, n = 82 dendrites in Bic-treated cultures). (D–F) The number, percentage and size of synaptic α1-, α2- and α1/α2-clusters, respectively, along the primary dendrites of MSNs. The box plots display the median and IQRs of indicated synaptic parameters measured along the first 20 μm of primary dendrites (n = 84 dendrites in DMSO/controls, n = 80 dendrites in α1 and α1/α2-cluster analysis and n = 79 in α2 cluster analysis) of total of n = 16 neurons from two independent experiments. Statistical analysis was performed using Mann Whitney test, *p < 0.05.

References

    1. Akerman C. J., Cline H. T. (2007). Refining the roles of GABAergic signaling during neural circuit formation. Trends Neurosci. 30, 382–389. 10.1016/j.tins.2007.06.002 - DOI - PubMed
    1. Anderson S. A., Qiu M., Bulfone A., Eisenstat D. D., Meneses J., Pedersen R., et al. . (1997). Mutations of the homeobox genes Dlx-1 and Dlx-2 disrupt the striatal subventricular zone and differentiation of late born striatal neurons. Neuron 19, 27–37. 10.1016/s0896-6273(00)80345-1 - DOI - PubMed
    1. Aznavour N., Mechawar N., Watkins K. C., Descarries L. (2003). Fine structural features of the acetylcholine innervation in the developing neostriatum of rat. J. Comp. Neurol. 460, 280–291. 10.1002/cne.10660 - DOI - PubMed
    1. Banker G., Goslin K. (1988). Developments in neuronal cell culture. Nature 336, 185–186. 10.1038/336185a0 - DOI - PubMed
    1. Ben-Ari Y., Khalilov I., Kahle K. T., Cherubini E. (2012). The GABA excitatory/inhibitory shift in brain maturation and neurological disorders. Neuroscientist 18, 467–486. 10.1177/1073858412438697 - DOI - PubMed