. 2015 Aug 5:9:301.
doi: 10.3389/fncel.2015.00301. eCollection 2015.

Maternal immune activation evoked by polyinosinic:polycytidylic acid does not evoke microglial cell activation in the embryo

Affiliations

Maternal immune activation evoked by polyinosinic:polycytidylic acid does not evoke microglial cell activation in the embryo

Silke Smolders et al. Front Cell Neurosci. .

Abstract

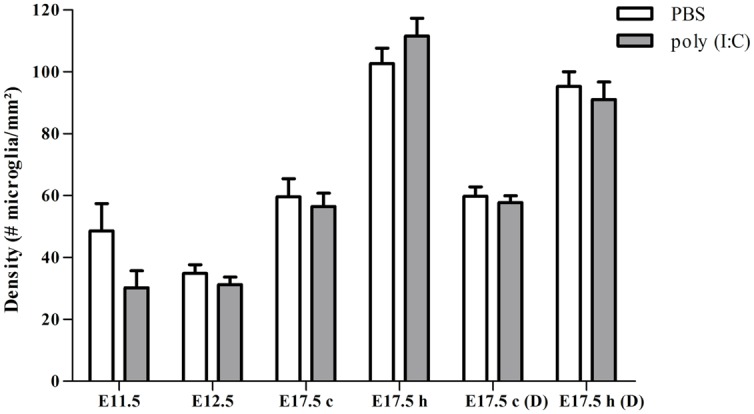
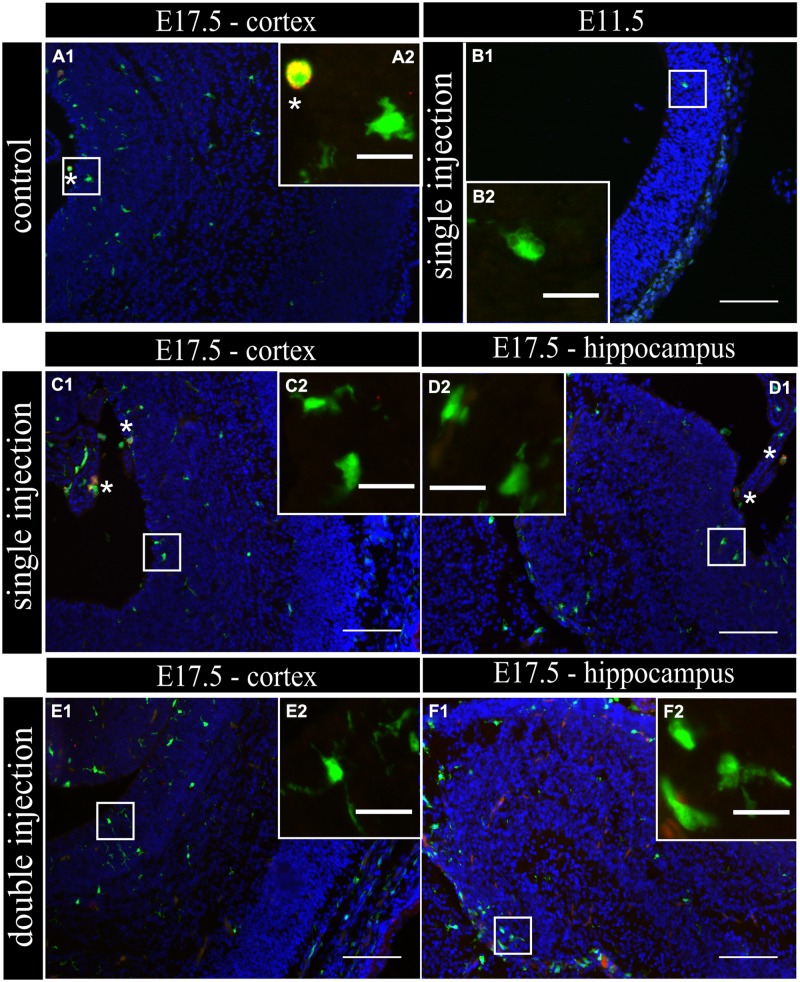
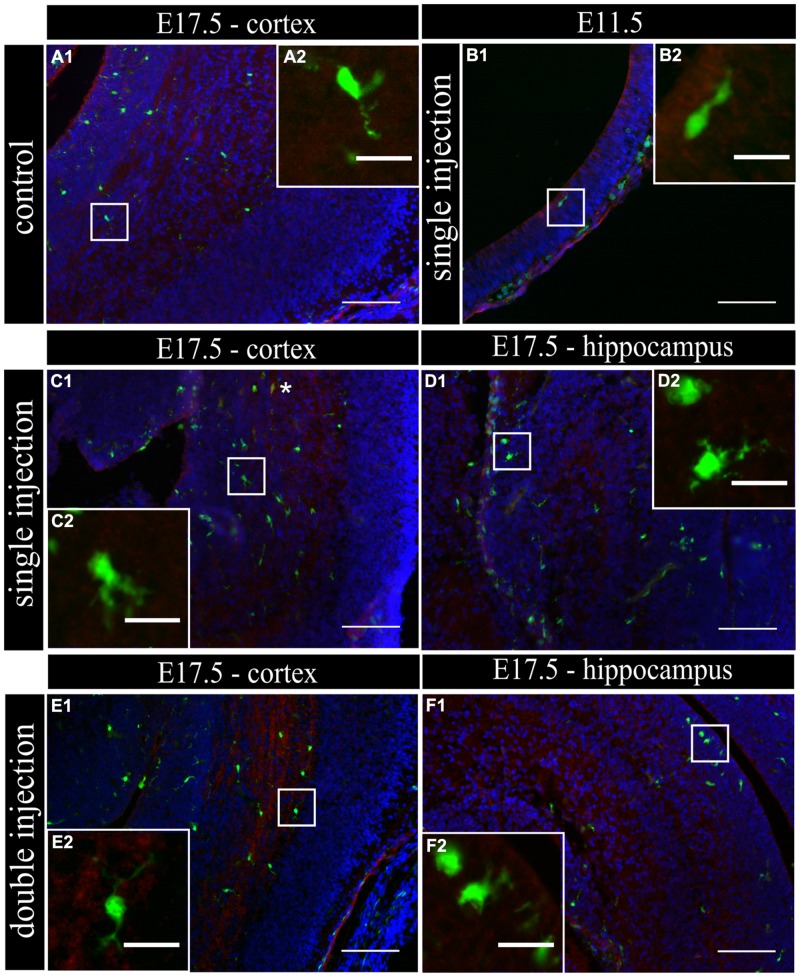
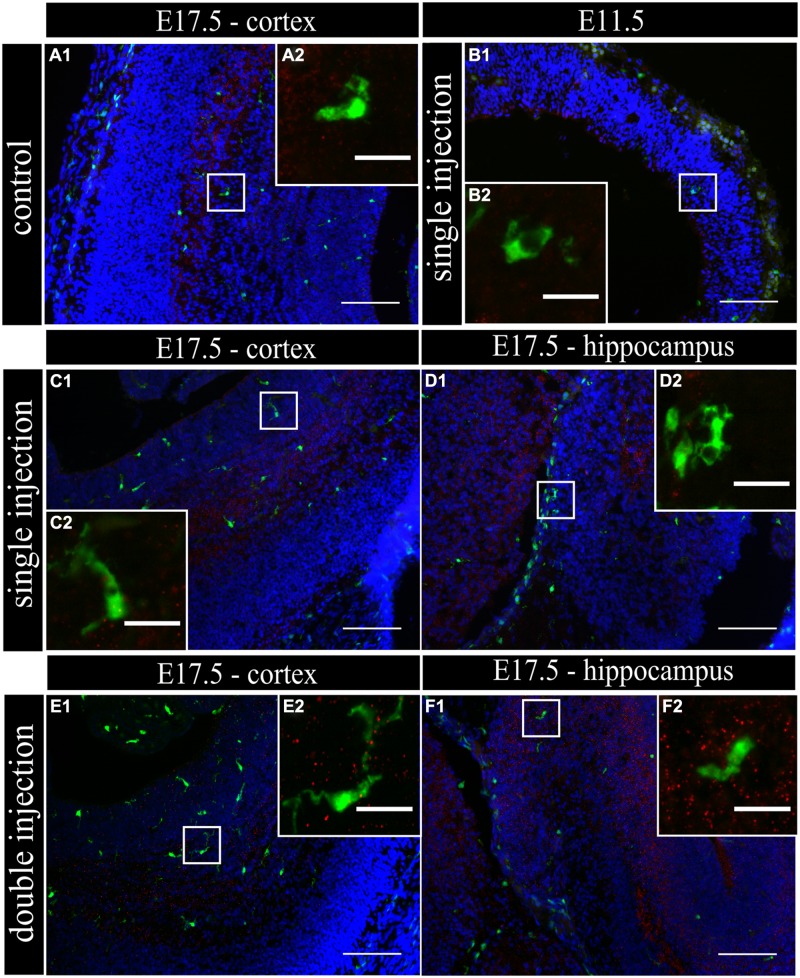
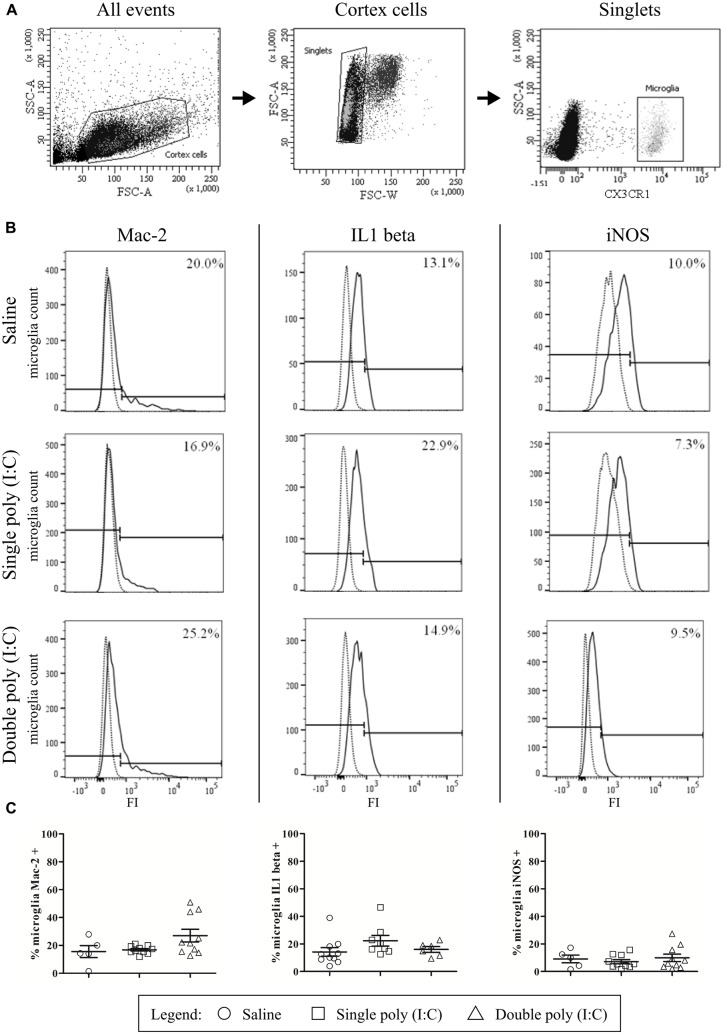
Several studies have indicated that inflammation during pregnancy increases the risk for the development of neuropsychiatric disorders in the offspring. Morphological brain abnormalities combined with deviations in the inflammatory status of the brain can be observed in patients of both autism and schizophrenia. It was shown that acute infection can induce changes in maternal cytokine levels which in turn are suggested to affect fetal brain development and increase the risk on the development of neuropsychiatric disorders in the offspring. Animal models of maternal immune activation reproduce the etiology of neurodevelopmental disorders such as schizophrenia and autism. In this study the poly (I:C) model was used to mimic viral immune activation in pregnant mice in order to assess the activation status of fetal microglia in these developmental disorders. Because microglia are the resident immune cells of the brain they were expected to be activated due to the inflammatory stimulus. Microglial cell density and activation level in the fetal cortex and hippocampus were determined. Despite the presence of a systemic inflammation in the pregnant mice, there was no significant difference in fetal microglial cell density or immunohistochemically determined activation level between the control and inflammation group. These data indicate that activation of the fetal microglial cells is not likely to be responsible for the inflammation induced deficits in the offspring in this model.

Keywords: cortex; embryo; maternal immune activation; microglia; neuropsychiatric disorders.


Figures

FIGURE 1
FIGURE 1
Embryonic microglial cell density is not increased after single and double injection of poly (I:C). Microglial cell density in the cortex and hippocampal area was not affected after poly (I:C)-induced MIA. Values are mean ± SEM of the number of microglial cells per mm2, Mann–Whitney test was used for statistical analysis. When injected at E11.5 the numbers of embryonic brains in the saline and poly (I:C) group were, respectively: E11.5 = 4/5; E12.5 = 12/7; E17.5 cortex = 6/8; E17.5 hippocampus = 5/8. When injected at E11.5 and E15.5 numbers of embryonic brains in the saline and poly (I:C) group were, respectively: E17.5 cortex = 5/6; E17.5 hippocampus = 6/6. c, cortex; h, hippocampal area; D, double injection.
FIGURE 2
FIGURE 2
Embryonic microglial cell population is poorly immunoreactive to the Mac-2/Galectin-3 antibody after single and double injection of poly (I:C). (A–F1) Coronal sections of embryonic brains, with cell nucleus staining in blue (DAPI) and microglial (CX3CR1-eGFP) cells in green. Immunohistochemical staining using a Mac-2 antibody (red) showed that at E17.5 almost no microglial cells in the cortex were immunoreactive for Mac-2 (A2) after injection with saline. At E11.5 (B2) and E17.5 (C2,E2) in the cortex and E17.5 hippocampal area (D2,F2) there was no increased percentage of microglial cells expressing the activation marker after poly (I:C) challenge compared to control. White square indicates the location of the cells in the tissue showed in the inset; indicates a Mac-2 positive eGFP cell. Examples of one control brain area and poly (I:C) group only as they were not significantly different. Scale bar = 100 μm and for insets = 20 μm.
FIGURE 3
FIGURE 3
Embryonic microglia show no increased expression of IL1β after single and double injection of poly (I:C). (A–F1) Coronal sections of embryonic brains, with cell nucleus staining in blue (DAPI) and microglial (CX3CR1-eGFP) cells in green. Immunohistochemical staining using an IL1β antibody (red) showed that at E17.5 almost no microglial cells in the cortex were immunoreactive for IL1β (A2) after injection with saline. At E11.5 (B2) and E17.5 (C2,E2) in the cortex and E17.5 hippocampal area (D2,F2) there was no increased percentage of microglial cells expressing the activation marker after poly (I:C) challenge compared to control. White square indicates the location of the cells in the tissue showed in the inset; indicates an IL1β positive eGFP cell. Examples of one control brain area and poly (I:C) group only as they were not significantly different. Scale bar = 100 μm and for insets = 20 μm.
FIGURE 4
FIGURE 4
Embryonic microglia cell population is poorly immunoreactive to the iNOS antibody after single and double injection of poly (I:C). (A–F1) Coronal sections of embryonic brains, with cell nucleus staining in blue (DAPI) and microglial (CX3CR1-eGFP) cells in green. Immunohistochemical staining using an iNOS antibody (red) showed that at E17.5 almost no microglial cells in the cortex were immunoreactive for iNOS (A2) after injection with saline. At E11.5 (B2) and E17.5 (C2,E2) in the cortex and E17.5 hippocampal area (D2,F2) there was no increased percentage of microglial cells expressing the activation marker after poly (I:C) challenge compared to control. White square indicates the location of the cells in the tissue showed in the inset. Examples of one control brain area and poly (I:C) group only as they were not significantly different. Scale bar = 100 μm and for insets = 20 μm.
FIGURE 5
FIGURE 5
Flow cytometry reveals that embryonic microglial cells show a poor expression of activation markers Mac-2, IL1β and iNOS. (A) Gating strategies for the microglial cells. In the whole embryonic cortex cell suspension, a gate was created on the non-debris population (left). Inside this population, single cells were selected (middle) and within this population, the microglial cells were gated based on CX3CR1-eGFP intensity (right). SSC, Side scatter; FSC, Forward scatter. (B) Gating strategies for positive Mac-2, iNOS and IL1β populations. Microglial cell count of representative samples is shown for Mac-2 (left), IL1β (middle) and iNOS (right; full lines) for embryos derived from saline, single poly (I:C) and double poly (I:C) injected mothers. Gates for positive populations were drawn based on the isotype fluorescence intensity (dotted lines). FI, fluorescence intensity. (C) Left panels: at E17.5 only a small percentage of microglial cells shows reactivity for Mac-2. There is no significant effect of poly (I:C) injection on this percentage. Number of embryos tested: Saline N = 5; single poly (I:C) N = 10 and double poly (I:C) N = 10. Middle panels: in control conditions, less than 15% of the microglial cells is positive for IL1β. There is no significant effect of poly (I:C) injection on this proportion. Number of embryos tested: Saline N = 10; single poly (I:C) N = 8 and double poly (I:C) N = 6. Right panels: at E17.5 less than 10% of the microglial cells is positive for iNOS. Poly (I:C) challenge has no significant effect on this percentage. Number of embryos tested: saline N = 5; single poly (I:C) N = 10 and double poly (I:C) N = 10.
FIGURE 6
FIGURE 6
Microglial activation in acute brain slices. Example of activation marker stainings on acute slices treated with LPS. (A) Immunohistochemical staining for Mac-2/Galectin-3 (red), nuclei were visualized with DAPI (blue; A1). Microglia (green) positive (A1 white square, A2) for Mac-2/Galectin-3 (red) and microglia that do not express the marker (white triangle, A3) were present in the slice. (B) Immunohistochemical staining for iNOS (red), nuclei were visualized with DAPI (blue; B1). Microglial cells that were positive (white square B1,B2) and negative (white triangle B1,B3) for iNOS (red) were observed in the slice after LPS treatment. (C) Immunohistochemical staining for IL1β (red), nuclei were visualized with DAPI (blue; C1). Microglial cells that were positive (white square C1,C2) and negative (white triangle C1,C3) for IL1β (red) were observed in the slice after LPS treatment. Examples of the different immunostainings were taken from slices treated for 24 h with 1 μg/ml LPS. Scale bar = 50 μm and for inserts = 20 μm. White squares indicate the microglia positive for the marker and shown in higher magnification (A–C2), white triangles indicate microglia negative for the marker and shown in higher magnification (A–C3). (D) Quantification of the expression of three activation markers (Mac-2, iNOS, and IL1β) by microglia in E15.5 brain slices cultured for 24 h with IL-6 (10 ng/ml), poly (I:C) (50 μg/ml), or LPS (1 μg/ml). Kruskal–Wallis test was used for statistical analysis. Number of treated slices in control and IL-6 group N = 4; LPS and poly (I:C) group N = 5. Number of cryosections for Mac-2/iNOS/IL1β in: saline group n = 23/23/27; IL-6 group n = 22/19/16; poly (I:C) group n = 18/25/19; LPS group n = 21/21/22 (all derived from three different embryos). (p < 0.05).

Similar articles

Cited by

References

    1. Aarum J., Sandberg K., Haeberlein S. L., Persson M. A. (2003). Migration and differentiation of neural precursor cells can be directed by microglia. Proc. Natl. Acad. Sci. U.S.A. 100 15983–15988. 10.1073/pnas.2237050100 - DOI - PMC - PubMed
    1. Anderson S. A., Marin O., Horn C., Jennings K., Rubenstein J. L. (2001). Distinct cortical migrations from the medial and lateral ganglionic eminences. Development 128 353–363. - PubMed
    1. Antony J. M., Paquin A., Nutt S. L., Kaplan D. R., Miller F. D. (2011). Endogenous microglia regulate development of embryonic cortical precursor cells. J. Neurosci. Res. 89 286–298. 10.1002/jnr.22533 - DOI - PubMed
    1. Ashdown H., Dumont Y., Ng M., Poole S., Boksa P., Luheshi G. N. (2006). The role of cytokines in mediating effects of prenatal infection on the fetus: implications for schizophrenia. Mol. Psychiatry 11 47–55. 10.1038/sj.mp.4001748 - DOI - PubMed
    1. Bauer S., Kerr B. J., Patterson P. H. (2007). The neuropoietic cytokine family in development, plasticity, disease and injury. Nat. Rev. Neurosci. 8 221–232. 10.1038/nrn2054 - DOI - PubMed

LinkOut - more resources