. 2015 Aug 10;3(7):e468.
doi: 10.1097/GOX.0000000000000426. eCollection 2015 Jul.

Autologous Graft Thickness Affects Scar Contraction and Quality in a Porcine Excisional Wound Model

Affiliations

Autologous Graft Thickness Affects Scar Contraction and Quality in a Porcine Excisional Wound Model

Rodney K Chan et al. Plast Reconstr Surg Glob Open. .

Abstract

Background: Texture, color, and durability are important characteristics to consider for skin replacement in conspicuous and/or mobile regions of the body such as the face, neck, and hands. Although autograft thickness is a known determinant of skin quality, few studies have correlated the subjective and objective characters of skin graft healing with their associated morphologic and cellular profiles. Defining these relationships may help guide development and evaluation of future skin replacement strategies.

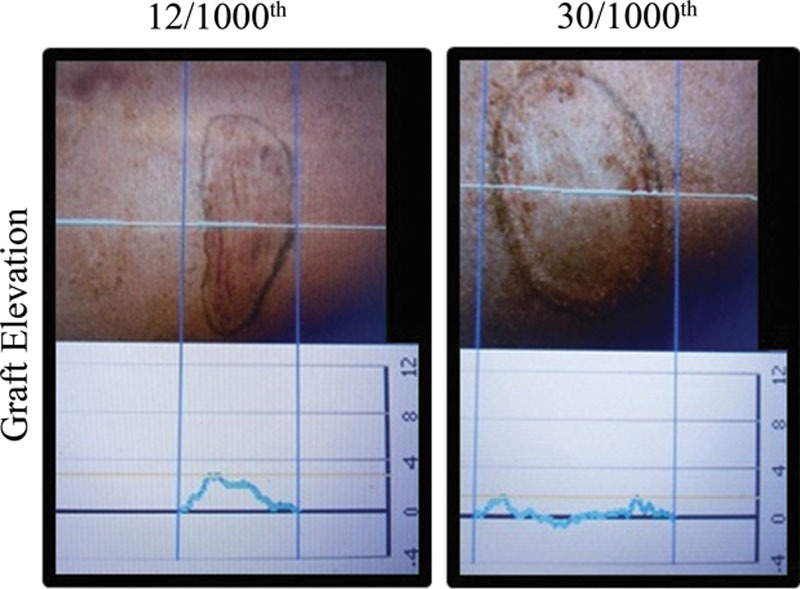
Methods: Six-centimeter-diameter full-thickness wounds were created on the back of female Yorkshire pigs and covered by autografts of variable thicknesses. Skin quality was assessed on day 120 using an observer scar assessment score and objective determinations for scar contraction, erythema, pigmentation, and surface irregularities. Histological, histochemical, and immunohistochemical assessments were performed.

Results: Thick grafts demonstrated lower observer scar assessment score (better quality) and decreased erythema, pigmentation, and surface irregularities. Histologically, thin grafts resulted in scar-like collagen proliferation while thick grafts preserves the dermal architecture. Increased vascularity and prolonged and increased cellular infiltration were observed among thin grafts. In addition, thin grafts contained predominately dense collagen fibers, whereas thick grafts had loosely arranged collagen. α-Smooth muscle actin staining for myofibroblasts was observed earlier and persisted longer among thinner grafts.

Conclusions: Graft thickness is an important determinant of skin quality. High-quality skin replacements are associated with preserved collagen architecture, decreased neovascularization, and decreased inflammatory cellular infiltration. This model, using autologous skin as a metric of quality, may give a more informative analysis of emerging skin replacement strategies.


Conflict of interest statement

Disclosure: The authors have no financial interest to declare in relation to the content of this article. This study is funded by the Department of Defense. The opinions or assertions contained herein are the private views of the authors and are not to be construed as official or as reflecting the views of the Department of the Army or the Department of Defense. The Article Processing Charge was paid for by the US Army Medical Research and Material Command.

Figures

Fig. 1.
Fig. 1.
Summary of graft contraction, graft elevation, erythema, melanin, and Patient and Observer Scar Assessment Scale (POSAS) measurements of various thickness skin grafts on day 120 postgrafting. The 2-letter combinations under “P-value” refer to comparisons between the designated columns. Thus, “AE: <0.0001” indicates that the calculated P value between contraction of a 6/1000th (150 μm) graft (column A) and a full-thickness skin graft (FTSG; column E) is 0.0010.
Fig. 2.
Fig. 2.
Graft size of various thickness skin grafts monitored over 120 days. Thinner grafts have contracted significantly over time while thicker grafts have closely preserved their original size. FTSG indicates full-thickness skin graft.
Fig. 3.
Fig. 3.
Size of various thickness skin grafts on day 120 postgrafting. Thin grafts have contracted significantly as measured by the percentage of their original size compared with thicker grafts. Statistical analysis is shown in Figure 1. FTSG indicates full-thickness skin graft.
Fig. 4.
Fig. 4.
A graphical representation of graft elevation measurements by SilhouetteMobile. The thin graft shows more contraction (top picture) and higher elevation (bottom graph) compared with the thick graft.
Fig. 5.
Fig. 5.
Histological comparison between thin (A) (6/1000th of an inch, 150 μm) and thick (B) (full-thickness skin graft) grafts. H&E: Hematoxylin and eosin stain on day 7 postgrafting. The green line depicts the junction between graft and host tissue (×20). VEMT: Verhoeff’s Elastic Masson’s Trichrome stain for collagen on day 120 (×40). Picrosirius Red: Collagen stain on day 120 (×100). Thick graft consists of large, interwoven, and loosely spaced collagen bundles, whereas thin graft contains densely packed thin collagen fibers. CD45: On day 7, leukocyte infiltration is dense (×400) and pervasive (×20) in the thin graft compared with the thick graft. α-SMA (myofibroblasts): Myofibroblast infiltration in host tissue on day 14 postgrafting (×20). The brown myofibroblast layer is present below the graft-host junction (green line). α-SMA (pericytes): Vascular network is noted primarily at the superficial dermis (day 120, ×40). Alcian Blue: Mast cells stain blue (yellow arrowheads) and are located primarily at the superficial dermis (day 120, ×400).
Fig. 6.
Fig. 6.
The number of mast cells was counted for each group on day 120. The thicker graft, especially the full-thickness skin graft (FTSG), has fewer mast cells compared with the thinner graft.
Fig. 7.
Fig. 7.
Histological comparison of graft, scar, and total thickness between each autograft group on day 120. A, The graph shows an inverse relationship between graft thickness and scar thickness. B, Histological comparison between a thin (12/1000th of an inch, 300 μm) and a thick (30/1000th of an inch, 760 μm) graft. The blue line marks the original autograft, red line marks the scar, and the green dashed line marks the total dermal thickness. Thinner grafts have a thicker scar compared with thicker grafts. FTSG indicates full-thickness skin graft.
Fig. 8.
Fig. 8.
The merit of current and emerging treatments or treatment strategies can be compared with the standards established by this model. The y axis can be any of the measures we have used for determining skin quality (ie, contraction and erythema). For example, if the standard contraction for a 12/1000th inch (300 μm) graft is 40%, then a skin substitute that yields 20% contraction would be an overperformer compared with the standard (green). If the same product has 50% contraction, then the product is an underperformer (red). FTSG indicates full-thickness skin graft.

References

    1. Nitzschke SL, et al. Wound healing trajectories in burn patients and their impact on mortality. J Burn Care Res. 2014;35:474–9. - PubMed
    1. Padgett EC. Indications for determination of the thickness of split skin grafts. Am J Surg. 1946;72:683–693. - PubMed
    1. Engrav LH, Heimbach DM, Walkinshaw MD, et al. Excision of burns of the face. Plast Reconstr Surg. 1986;77:744–751. - PubMed
    1. Draaijers LJ, Tempelman FR, Botman YA, et al. The patient and observer scar assessment scale: a reliable and feasible tool for scar evaluation. Plast Reconstr Surg. 2004;113:1960–1965; discussion 1966–1967. - PubMed
    1. Rich L, Whittaker P. Collagen and Picrosirius Red staining: a polarized light assessment of fibrillar hue and spatial distribution. Braz J Morphol Sci. 2005;22:97–104.