. 2015 Oct;47(10):1212-9.
doi: 10.1038/ng.3391. Epub 2015 Aug 24.

In situ single-cell analysis identifies heterogeneity for PIK3CA mutation and HER2 amplification in HER2-positive breast cancer

Affiliations

In situ single-cell analysis identifies heterogeneity for PIK3CA mutation and HER2 amplification in HER2-positive breast cancer

Michalina Janiszewska et al. Nat Genet. 2015 Oct.

Abstract

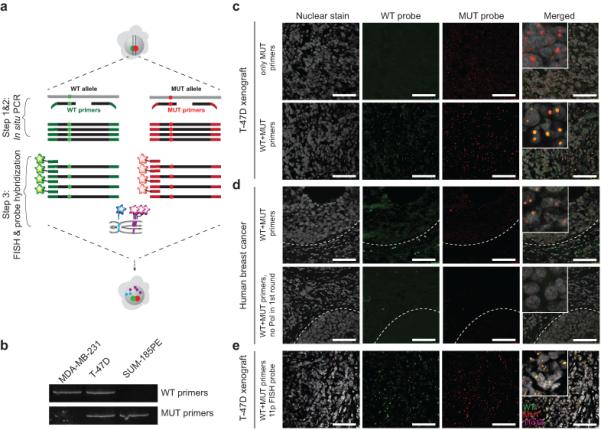
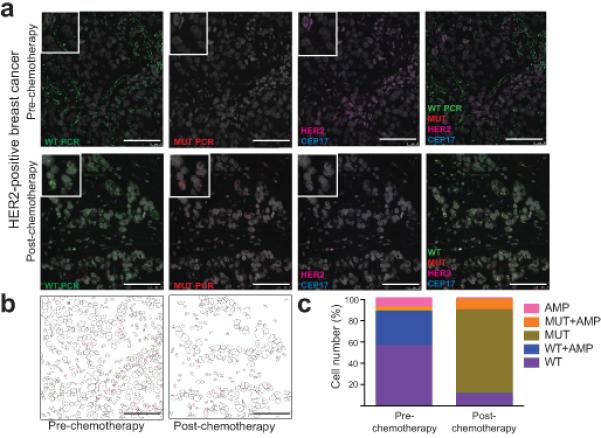
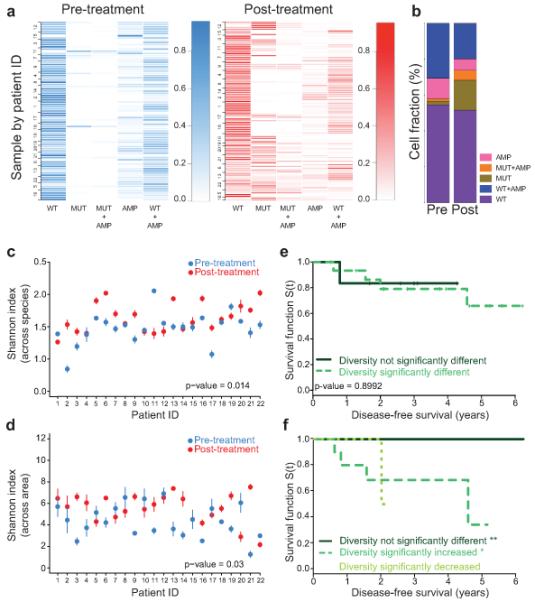
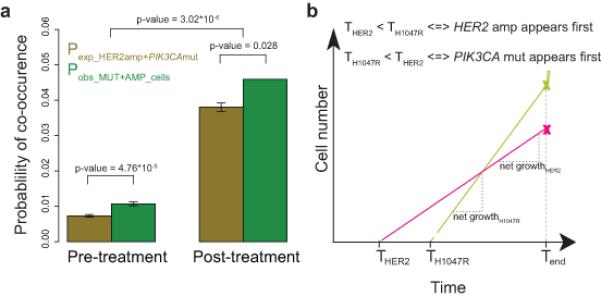
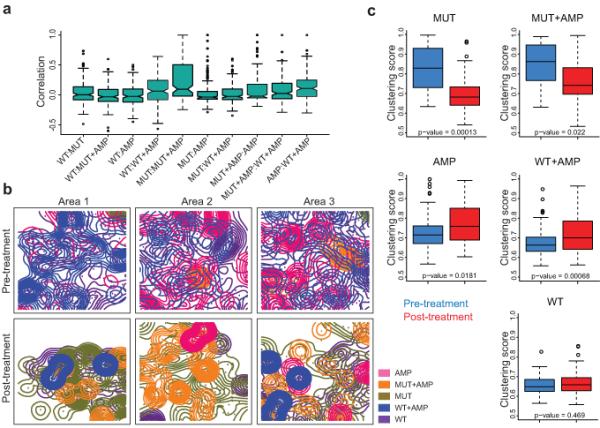
Detection of minor, genetically distinct subpopulations within tumors is a key challenge in cancer genomics. Here we report STAR-FISH (specific-to-allele PCR-FISH), a novel method for the combined detection of single-nucleotide and copy number alterations in single cells in intact archived tissues. Using this method, we assessed the clinical impact of changes in the frequency and topology of PIK3CA mutation and HER2 (ERBB2) amplification within HER2-positive breast cancer during neoadjuvant therapy. We found that these two genetic events are not always present in the same cells. Chemotherapy selects for PIK3CA-mutant cells, a minor subpopulation in nearly all treatment-naive samples, and modulates genetic diversity within tumors. Treatment-associated changes in the spatial distribution of cellular genetic diversity correlated with poor long-term outcome following adjuvant therapy with trastuzumab. Our findings support the use of in situ single cell-based methods in cancer genomics and imply that chemotherapy before HER2-targeted therapy may promote treatment resistance.


Figures

Figure 1
Figure 1
Outline of the STAR-FISH method and its validation. Scale bars represent 75 μm. (a) Schematic of the STAR-FISH protocol on a cell with heterozygous mutation. In step 1 & 2 in situ PCR with a mixture of wild-type (green) and mutant (red) primers is performed. Red and green dots represent the mutation site. In step 3, hybridization of fluorescent probe specific for WT and MUT PCR product is combined with hybridization of BAC (magenta) and CEP (blue) probes for genomic copy number variation detection. (b) PCR to test the specificity of PIK3CA H1047 primers using genomic DNA from breast cancer cell lines with known mutation status. MDA-MB-231 – PIK3CA WT, T-47D – heterozygous PIK3CA His1047Arg, and SUM185PE – homozygous PIK3CA His1047Arg mutation. (c) In situ PCR testing the specificity of primers for WT and His1047Arg MUT PIK3CA on T-47D breast cancer cell line xenografts. Upper panel – only mutant (MUT) primers were used in the first round of PCR and both primers were used in second round of PCR. Lower panel – both WT and MUT primers were used in both round of PCR. (d) In situ PCR for WT and His1047Arg MUT PIK3CA on a human primary breast tumor sample with known PIK3CA His1047Arg mutation. Upper panel – complete in situ PCR reaction. Dashed line – tumor-stroma border. Lower panel – in situ PCR without the polymerase in the first round of PCR. (e) STAR-FISH for WT (green) and His1047Arg MUT (red) PIK3CA in combination with FISH for 11q13x BAC probe (magenta) on T-47D xenografts.
Figure 2
Figure 2
STAR-FISH analysis of breast cancer. Scale bars represent 75 μm. (a) STAR-FISH performed on a HER2+ tumor before and after neoadjuvant chemotherapy. WT PIK3CA - green, MUT PIK3CA – red, CEP17 – blue, HER2 – magenta, nuclear stain (To-Pro-3) – gray. (b) Automated quantification of STAR-FISH signal in single cells. Images represent tumor topology before and after chemotherapy based on computational segmentation of confocal images of the nuclei. Each nuclear outline present in the picture was used as a region of interest (single nucleus) in which STAR-FISH signals were quantified. (c) Graphs depict the frequencies of cells within each of the five defined cell categories (“species”) before and after treatment.
Figure 3
Figure 3
Changes in intratumor heterogeneity and patient outcomes. (a) Frequency of each cell type before and after treatment. Rows - single areas of a tumor (numbers are patient IDs). Columns - cell types (Supplementary Table 3). Samples clustered based on the frequency of cell types. Scale bar represents color intensity gradient indicating frequency. (b) Summary of cell type frequencies in all patients combined before (Pre) and after (Post) therapy. Graph depicts the mean percentage of each cell type in all areas and samples combined. (c, d) Shannon index of diversity based on counts of five cell types combining all areas in each sample - across species comparison (c) and across different areas of the same tumor - across area comparison (d). Confidence intervals defined by nonparametric bootstrap resampling. Global difference in diversity before and after treatment for all patients was calculated using the paired Wilcox signed-rank sum test. Error bars represent two times the standard error obtained from 1,000 bootstrap samples. (e, f) Changes in diversity and clinical outcomes. Associations between changes in cellular diversity after chemotherapy across species (e) and across area (f). Patients grouped based on changes in diversity after treatment: (e) solid line – no significant change (n = 6), dashed line – significant change (n = 16); log-rank test p-value 0.8992 and (f) solid line – no significant change (n = 9), dashed line – significant increase (n = 11); dotted line - significant decrease (n = 2); log-rank test p-values: 0.0178 (**), 0.0596 (*), and 0.359 (ns), respectively.
Figure 4
Figure 4
Probable course of tumor evolution based on the co-occurrence of PIK3CA mutation and HER2 amplification. (a) Co-occurrence of PIK3CA His1047Arg mutation and HER2 amplification in the same cell. Expected probability (Pexp) of co-occurrence of the two genetic events is compared with observed probability (Pobs) based on the frequency of MUT+AMP cells. Error bars are defined as the standard deviation of expected or observed values divided by the square root of the total number of samples. (b) Mathematical model of probable tumor evolution. Prediction of the time at which each event arises (THER2 and THis1047Arg) based on STAR-FISH counts for both events (x marks) at observation time (Tend) and the net growth rates attributed to these events based on published data.
Figure 5
Figure 5
Intratumor topology. (a) Co-occurrence of the indicated cell type combinations. None of the correlations are significant. The median value is the horizontal bar in the middle of each box. IQR (interquartile ranges) is defined by the upper and lower edge of each box. Notches are the 95% confidence interval of the median. The lower whisker is defined as the maximum between 25 percentile - 1.5 × IQR and the minimum value of the data, whereas the upper whisker is defined as the minimum between 75% percentile + 1.5 × IQR and the maximum value of the data. (b) Kernel plots depicting the two-dimensional spatial distribution of the indicated cell types in three different regions of the same case before and after treatment. Scale bar represents 75 μm. (c) Spatial dispersion of different cell types within tumors. Formation of larger clusters in 2D space is indicated by an increase in clustering score, the ratio of between and within-cluster variation of Kernel means – a higher ratio means more clustering, while lower ratio signifies more random distribution.

References

    1. Marusyk A, Almendro V, Polyak K. Intra-tumour heterogeneity: a looking glass for cancer? Nat Rev Cancer. 2012;12:323–334. - PubMed
    1. Yap TA, Gerlinger M, Futreal PA, Pusztai L, Swanton C. Intratumor heterogeneity: seeing the wood for the trees. Sci Transl Med. 2012;4:127ps10. - PubMed
    1. Navin N, et al. Tumour evolution inferred by single-cell sequencing. Nature. 2011;472:90–94. - PMC - PubMed
    1. Navin NE. Cancer genomics: one cell at a time. Genome Biol. 2014;15:452–464. - PMC - PubMed
    1. Bagasra O. Protocols for the in situ PCR-amplification and detection of mRNA and DNA sequences. Nat Protoc. 2007;2:2782–2795. - PubMed

ONLINE METHODS REFERENCES

    1. Hammond ME, et al. American Society of Clinical Oncology/College of American Pathologists guideline recommendations for immunohistochemical testing of estrogen and progesterone receptors in breast cancer. Arch Pathol Lab Med. 2010;134:907–922. - PMC - PubMed
    1. Wolff AC, et al. Recommendations for human epidermal growth factor receptor 2 testing in breast cancer: American Society of Clinical Oncology/College of American Pathologists clinical practice guideline update. Arch Pathol Lab Med. 2014;138:241–256. - PMC - PubMed
    1. Marusyk A, et al. Non-cell-autonomous driving of tumour growth supports sub-clonal heterogeneity. Nature. 2014;514:54–58. - PMC - PubMed
    1. Frey UH, Bachmann HS, Peters J, Siffert W. PCR-amplification of GC-rich regions: 'slowdown PCR'. Nat Protoc. 2008;3:1312–1317. - PubMed
    1. Duprez R, et al. Immunophenotypic and genomic characterization of papillary carcinomas of the breast. J Pathol. 2012;226:427–441. - PMC - PubMed

Publication types

Substances

LinkOut - more resources