. 2015 Oct;47(10):1149-57.
doi: 10.1038/ng.3385. Epub 2015 Aug 24.

Broad H3K4me3 is associated with increased transcription elongation and enhancer activity at tumor-suppressor genes

Affiliations

Broad H3K4me3 is associated with increased transcription elongation and enhancer activity at tumor-suppressor genes

Kaifu Chen et al. Nat Genet. 2015 Oct.

Abstract

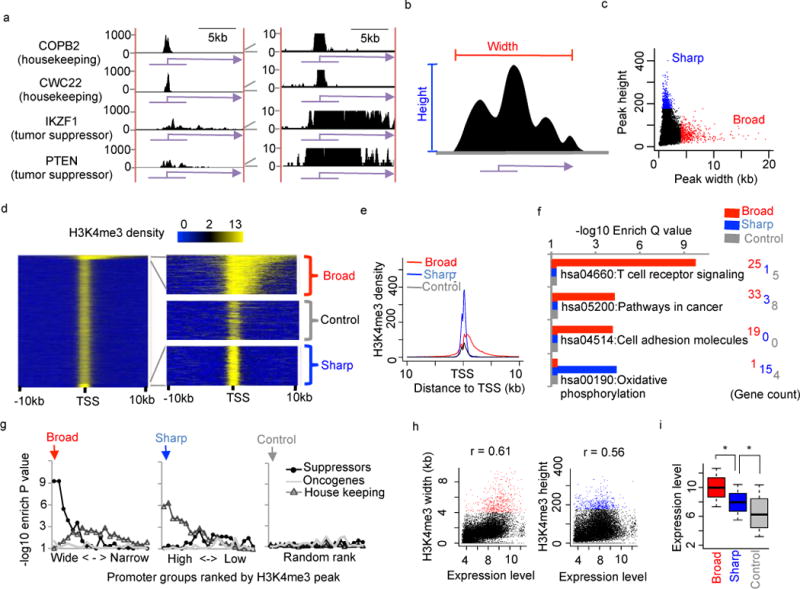
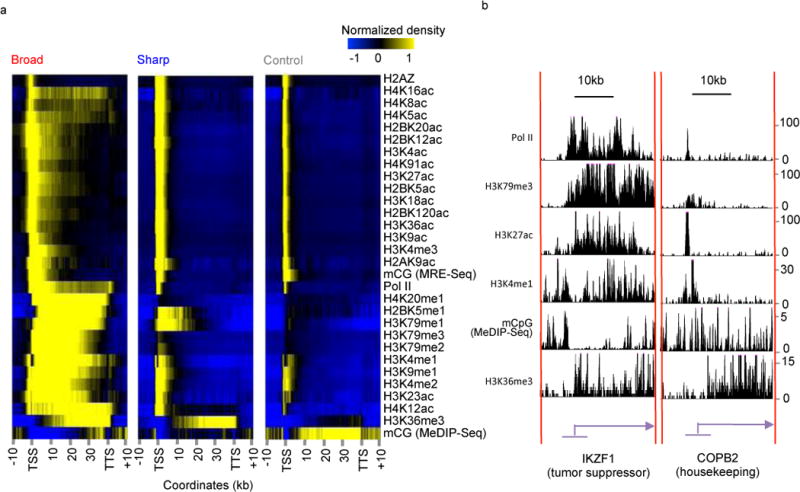
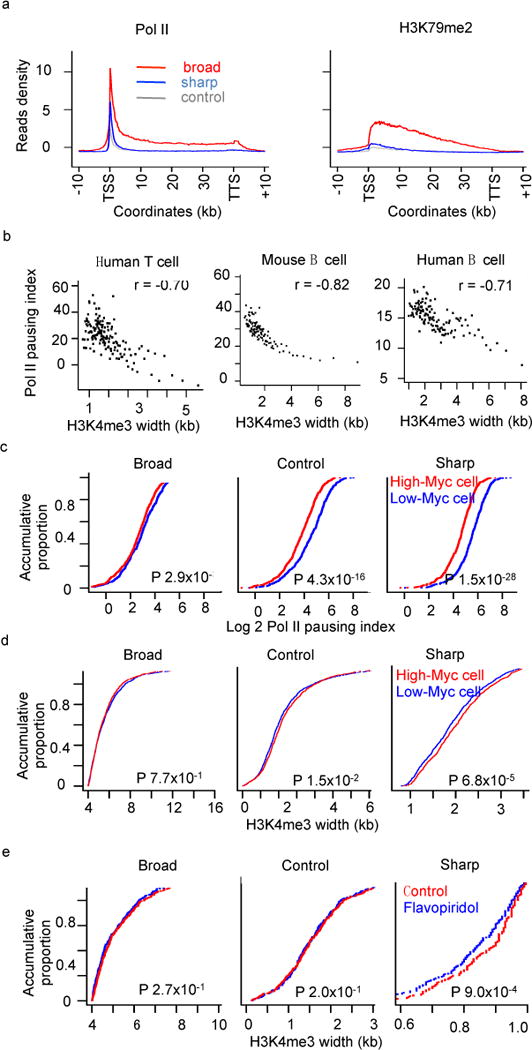
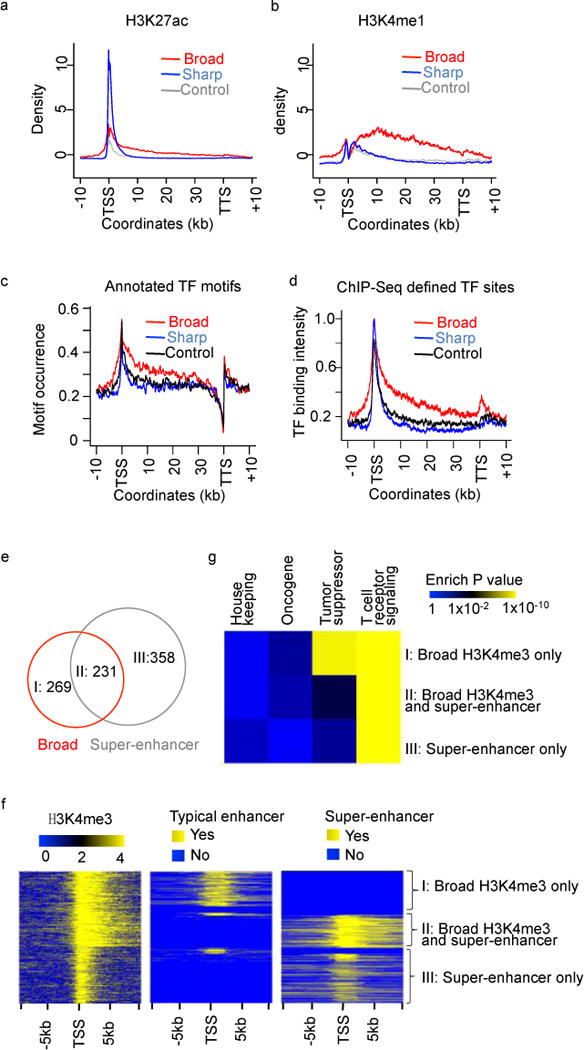
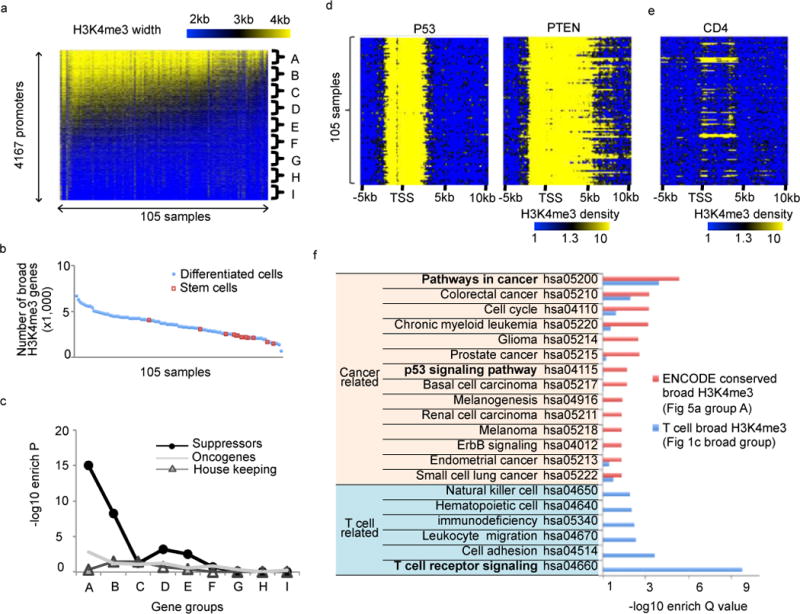
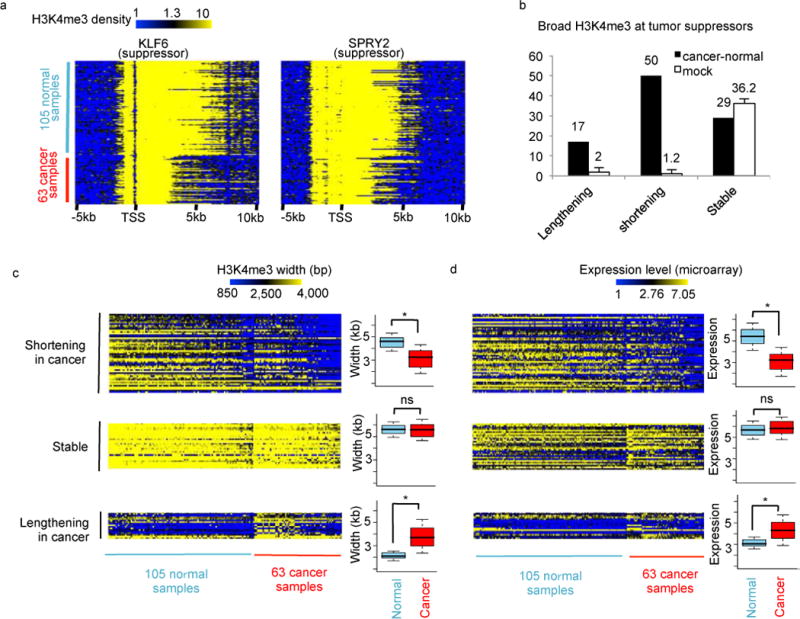
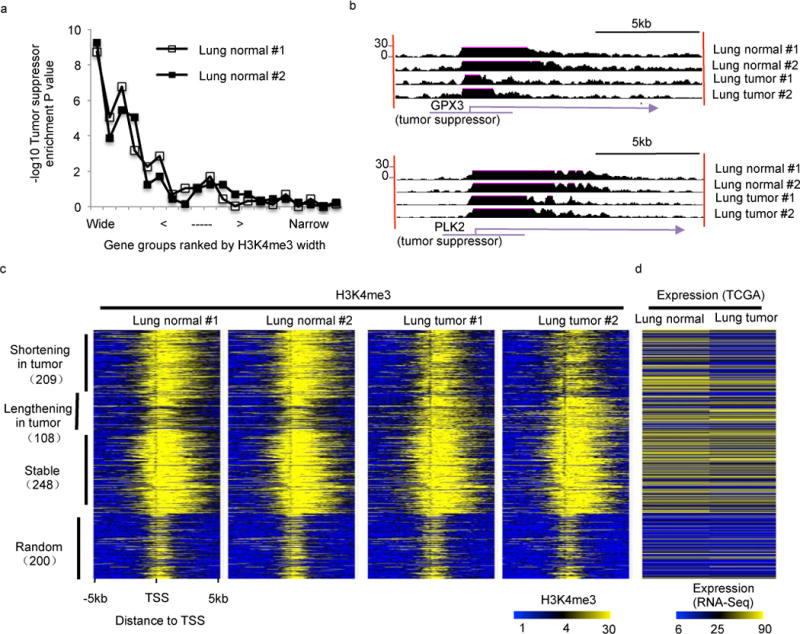
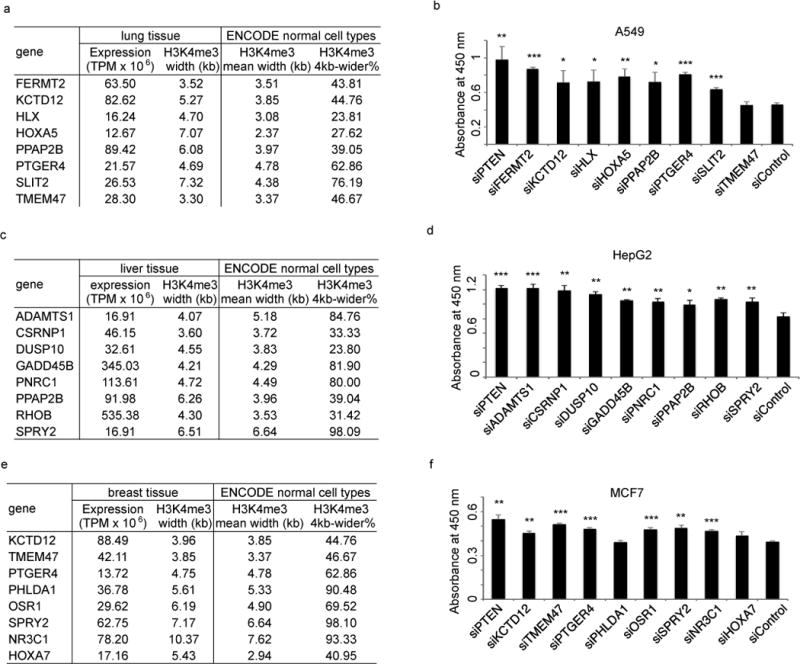
Tumor suppressors are mostly defined by inactivating mutations in tumors, yet little is known about their epigenetic features in normal cells. Through integrative analysis of 1,134 genome-wide epigenetic profiles, mutations from >8,200 tumor-normal pairs and our experimental data from clinical samples, we discovered broad peaks for trimethylation of histone H3 at lysine 4 (H3K4me3; wider than 4 kb) as the first epigenetic signature for tumor suppressors in normal cells. Broad H3K4me3 is associated with increased transcription elongation and enhancer activity, which together lead to exceptionally high gene expression, and is distinct from other broad epigenetic features, such as super-enhancers. Genes with broad H3K4me3 peaks conserved across normal cells may represent pan-cancer tumor suppressors, such as TP53 and PTEN, whereas genes with cell type-specific broad H3K4me3 peaks may represent cell identity genes and cell type-specific tumor suppressors. Furthermore, widespread shortening of broad H3K4me3 peaks in cancers is associated with repression of tumor suppressors. Thus, the broad H3K4me3 epigenetic signature provides mutation-independent information for the discovery and characterization of new tumor suppressors.


Conflict of interest statement

COMPETING FINANCIAL INTERESTS

The authors have no competing financial interest that might influence the performance or presentation of the work described in this manuscript.

Figures

Figure 1
Figure 1. Broad H3K4me3 in human CD4+ T cells marks tumor suppressors and cell identity genes
(a) H3K4me3 density at housekeeping genes COPB2 and CWC22 and tumor suppressors IKZF1 and PTEN. (b) Definition of H3K4me3 peak height and width. (c) H3K4me3 peak height (y-axis) plotted against width (x-axis). Blue and red dots indicate top 500 sharp and broad H3K4me3 peaks. (d) Heatmap of promoter H3K4me3. Each row represents a promoter region from −10kb to +10kb. The left panel contains all promoters. The right 3 panels are enlarged view of 500 broad (top), sharp (bottom), and random control H3K4me3 peaks (middle). Average density plots around TSS (e) and KEGG pathway enrichment (f) for the same broad, sharp and random control H3K4me3 peaks as in (d). (g) Enrichment P values (y-axis) of tumor suppressors, oncogenes, and housekeeping genes in different promoter groups (x-axis) ranked by H3k4me3 peaks from wide to narrow (left), high to low (middle), or randomly (right). Each group contains 500 genes. The left most groups in each panel contain the broad, sharp and random control H3K4me3 peaks. Enrichment P value was calculated using Fisher’s exact test. (h) H3K4me3 peak widths (left) and heights (right) plotted against gene expression levels. Red and blue dots indicate broad and sharp H3K4me3 peaks, respectively. (i) Boxplot showing gene expression levels associated with H3K4me3 peaks. The bottom, middle, and top lines indicate the first, second, and third quartiles, with whisker range defined as 0.5. *P < 1×10⁻²⁰ by KS test.
Figure 2
Figure 2. Most promoter epigenetic marks coincide with broad H3K4me3 in human CD4+ T cells
(a) Heatmap showing average density of 30 epigenetic marks at promoters associated with broad (left), sharp (middle) and random control (right) H3K4me3 peaks. Columns represent the region from 10 kb upstream of TSS to 10 kb downstream of TTS. All genes are scaled to be 40 kb long. Each row represents one epigenetic mark. (b) Genome browser tracks of 6 selected epigenetic marks at tumor suppressor TGFBR2 (left) and housekeeping gene ASL2 (right).
Figure 3
Figure 3. Broad H3K4me3 is associated with increased transcription elongation
(a) Average density plots of Pol II and H3K79me2 at genes associated with broad, sharp and random H3K4me3 peaks. (b) Pol II pausing index plotted against promoter H3K4me3 width in human T cell (left), mouse B cells (middle) and human B cell (right). Spearman correlation coefficients are indicated on top of each panel. Expressed genes whose promoter Pol II ChIP-seq intensity 50% higher than the mean value of all genes were used for the analysis. Genes were binned into groups (50 genes per group). (c) Accumulative plots of gene proportion against Pol II pausing index in mouse B cells with high (red) or low (blue) c-Myc expression. (d) Accumulative plots of gene proportion against H3K4me3 peak width in human B cells with high (red) or low (blue) c-Myc expression. (e) Accumulative plots of gene proportion against H3K4me3 peak width in cells under normal condition (red) or flavopiridol treatment (blue). P values were calculated based on K-S test.
Figure 4
Figure 4. Broad H3K4me3 has strong enhancer activity in human CD4+ T cells
Average density plots of enhancer mark H3K27ac (a) and H3K4me1 (b) at genes associated with broad, sharp and random H3K4me3 peaks. Occurrence of annotated TF binding motifs (c) and ChIP-Seq TF binding sites (d) plotted at genes associated with broad, sharp and random H3K4me3 peaks. (e) Venn diagrams showing the overlap between genes associated with super-enhancers and broad H3K4me3 peaks. (f) The distribution of H3K4me3 peaks, typical enhancers, and super-enhancers flanking TSS, which were divided into 3 groups as indicated in (e). (g) Enrichment levels of the 3 gene groups as indicated in (e) in housekeeping genes, oncogenes, tumor suppressors, and KEGG T cell receptor signaling pathway.
Figure 5
Figure 5. Broad H3K4me3 at tumor suppressors is conserved across ENCODE normal cell types
(a) Heatmap for H3K4me3 peak widths of 4,167 promoters (rows) across 105 ENCODE normal samples (columns). Promoters were further divided into 9 groups (A–I) based on the conservation level of H3K4me3 peak width (% samples with H3K4me3 peak longer than 4kb) from high to low. (b) Number (y-axis) of genes with H3K4me3 peak wider than 4kb in each sample (x-axis). (c) The enrichment levels of 9 promoter groups as indicted in (a) in tumor suppressors, oncogenes, and housekeeping genes. Enrichment P value was calculated based on Fisher’s exact test. (d) H3K4me3 density on two well-known tumor suppressor genes P53 (left) and PTEN (right) across 105 ENCODE normal samples. Each row is the H3K4me3 density in the region from 5kb upstream to 10kb downstream of TSS in one sample. (e) H3K4me3 density on cell-identity gene CD4 across 105 ENCODE normal samples. (f) KEGG pathways enrichment analysis of promoters associated with conserved broad H3K4me3 from ENCODE samples and broad H3K4me3 from human CD4+ T cells alone.
Figure 6
Figure 6. Widespread shortening of broad H3K4me3 at tumor suppressors
(a) H3K4me3 density on two tumor suppressors KLF16 (left) and SPRY2 (right) across 105 normal and 63 cancer ENCODE samples. (b) Broad H3K4me3 peaks at tumor suppressors that are shortened, lengthened, or stable between 105 normal and 63 cancer samples or through 1,000 mock comparisons. Heatmap of H3K4me3 peak widths (c) or expression levels (d) at each tumor suppressor (row) in each sample (column). The same 3 groups of genes with broad H3K4me3 peaks shortening, lengthening, or stable as indicated in (b) were plotted. Genes were ranked in the same order in the two heatmaps. A boxplot was plotted at the right side of each heatmap to show quantitative difference between cancer and normal samples. *P<1x−20 by Wilcoxon test; NS represents P>0.05.
Figure 7
Figure 7. Shortening of broad H3K4me3 peaks in lung tumors
(a) Enrichment P values (y-axis) of tumor suppressors in different promoter groups (symbols along the curves) ranked by H3k4me3 peaks from wide to narrow. Each promoter group contains 500 genes. The left most promoter group contains the broad H3K4me3 peaks. Enrichment P value was calculated using Fisher’s exact test. (b) Snapshots of broad H3K4me3 shortening in two tumor suppressor genes GPX3 (top) and PLK2 (bottom). (c) Heatmaps for H3K4me3 density flanking TSS in lung normal tissues (left 2 panels) and lung tumors (right 2 panels). In each panel, each row represents a 10kb region flanking TSS. (d) Gene expression levels in lung normal tissues and lung tumors. Genes were ranked as in (c).
Figure 8
Figure 8. Functional characterization of putative novel tumor suppressors defined by conserved broad H3K4me3
A549 (a, b), HepG2 (c, d) or MCF-7 (e, f) cells were transfected with indicated siRNAs, and cell proliferation was measured using the WST-1 assay. Error bar indicates standard variation calculated from three replicates. ***P <0.001, **P< 0.01, *P<0.05 compared to siControl based on T test.

References

    1. Weinstein JN, et al. The Cancer Genome Atlas Pan-Cancer analysis project. Nat Genet. 2013;45:1113–20. - PMC - PubMed
    1. Davoli T, et al. Cumulative haploinsufficiency and triplosensitivity drive aneuploidy patterns and shape the cancer genome. Cell. 2013;155:948–962. - PMC - PubMed
    1. Vogelstein B, et al. Cancer Genome Landscapes. Science (New York, NY) 2013;339:1546–1558. - PMC - PubMed
    1. De S, Michor F. DNA replication timing and long-range DNA interactions predict mutational landscapes of cancer genomes. Nat Biotechnol. 2011;29:1103–1108. - PMC - PubMed
    1. Schuster-Böckler B, Lehner B. Chromatin organization is a major influence on regional mutation rates in human cancer cells. Nature. 2012:1–5. - PubMed

Publication types

Associated data