. 2015 Aug 24;10(8):e0135257.
doi: 10.1371/journal.pone.0135257. eCollection 2015.

Cancer Cell Growth Is Differentially Affected by Constitutive Activation of NRF2 by KEAP1 Deletion and Pharmacological Activation of NRF2 by the Synthetic Triterpenoid, RTA 405

Affiliations

Cancer Cell Growth Is Differentially Affected by Constitutive Activation of NRF2 by KEAP1 Deletion and Pharmacological Activation of NRF2 by the Synthetic Triterpenoid, RTA 405

Brandon L Probst et al. PLoS One. .

Abstract

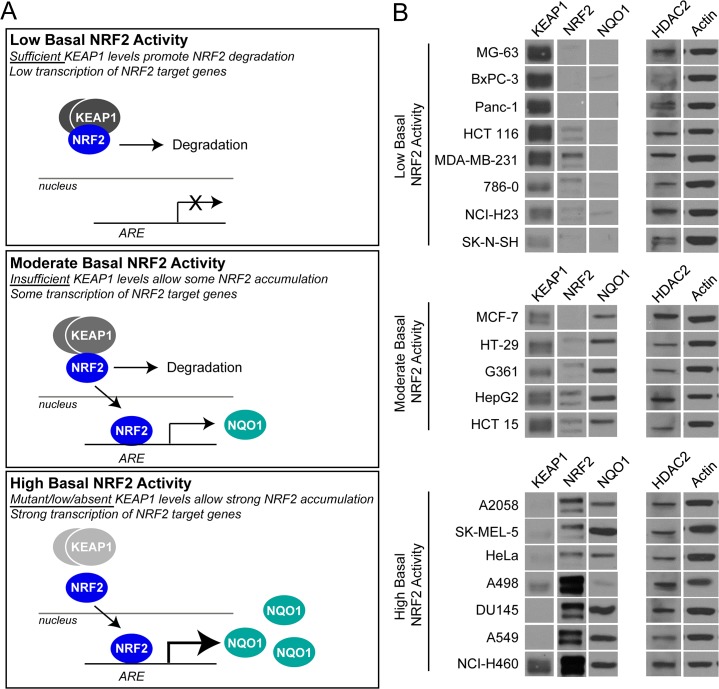
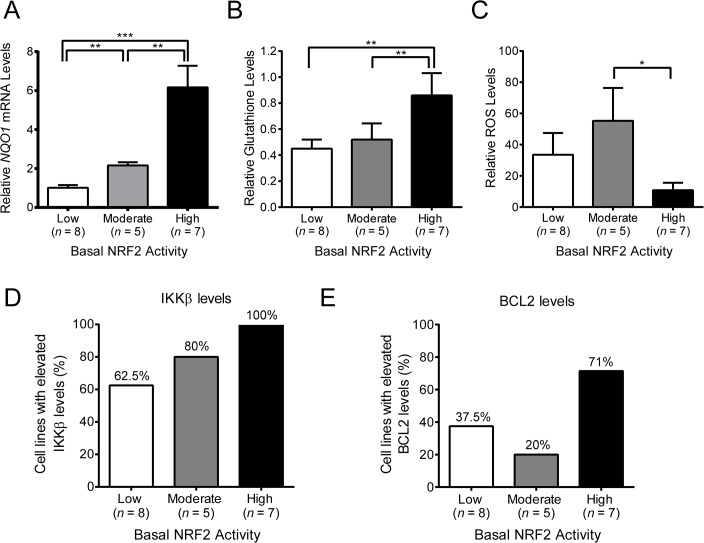
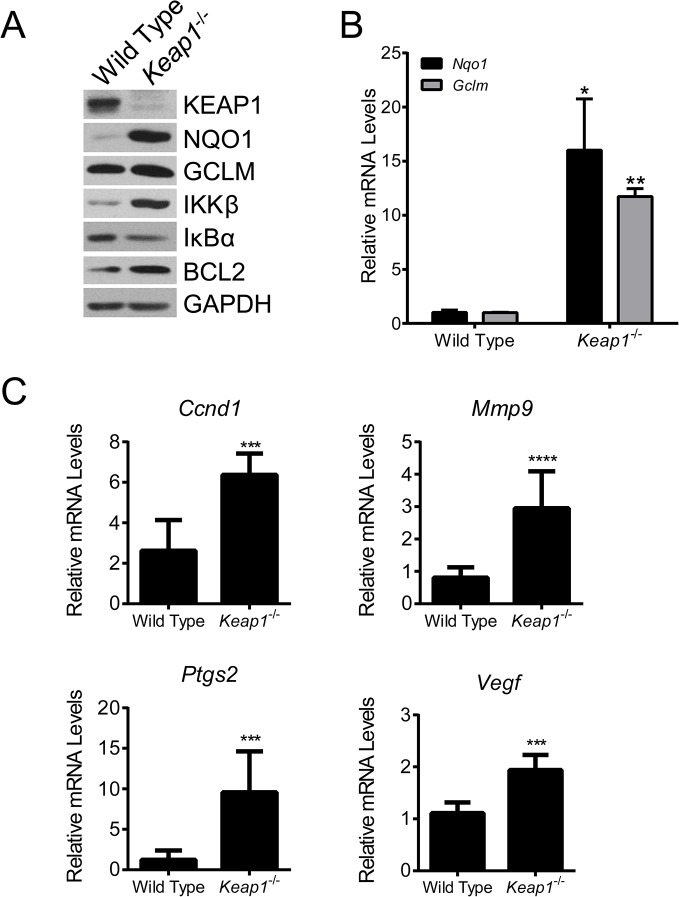
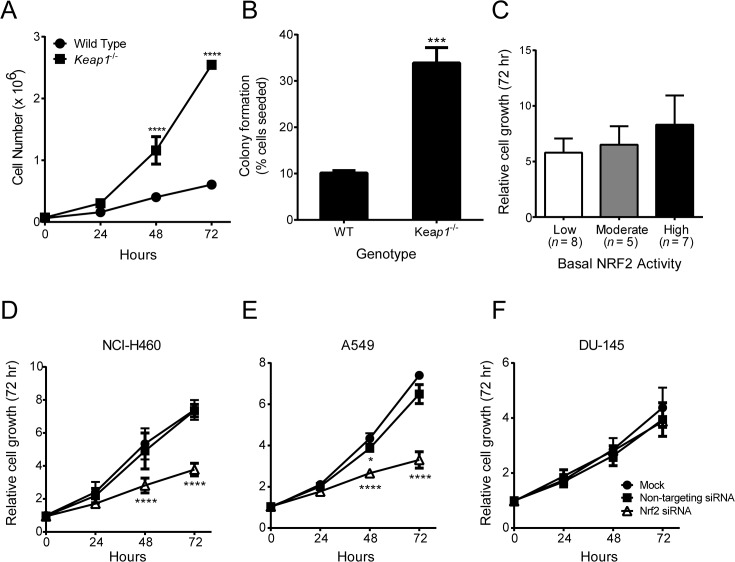
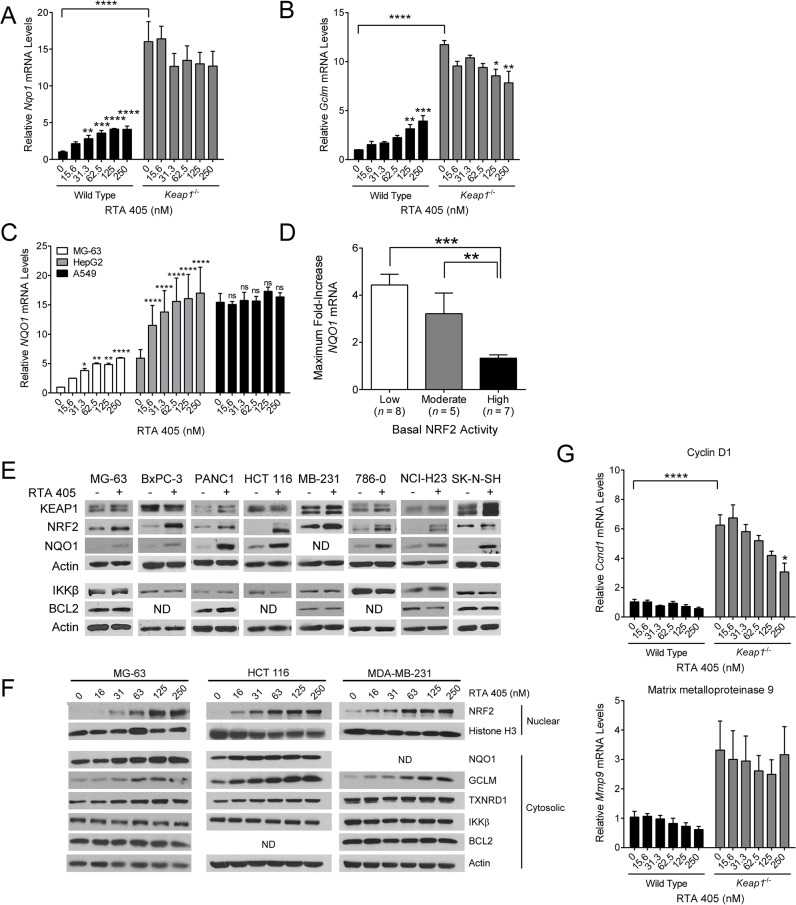
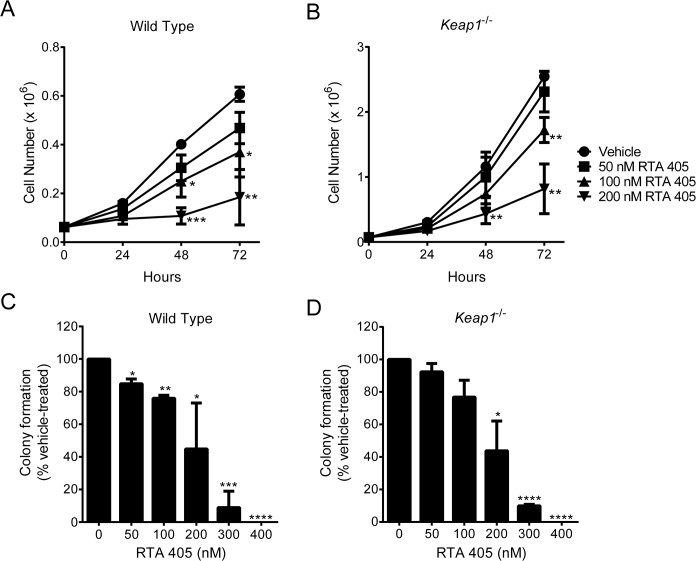
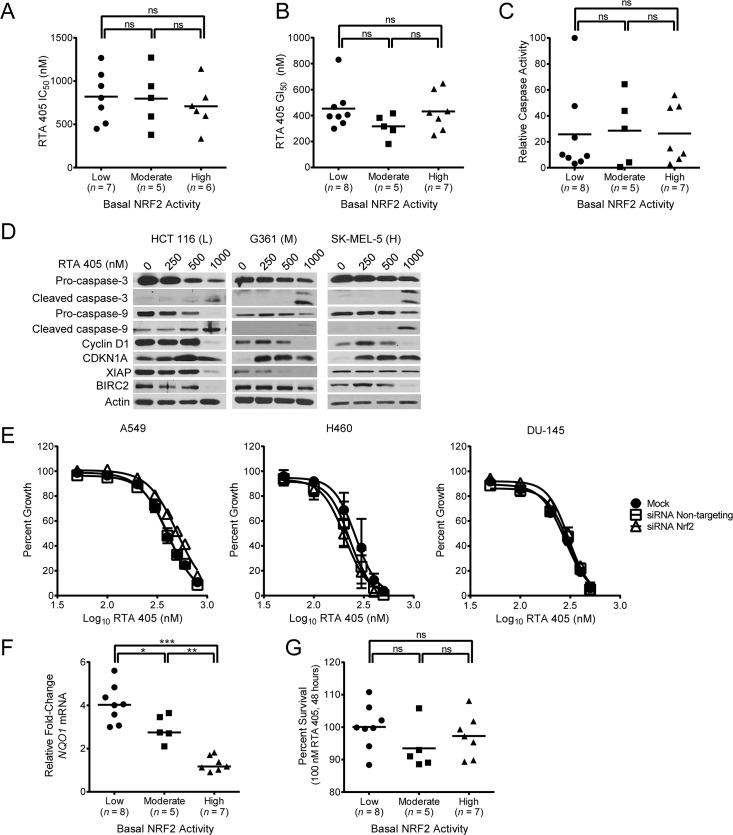
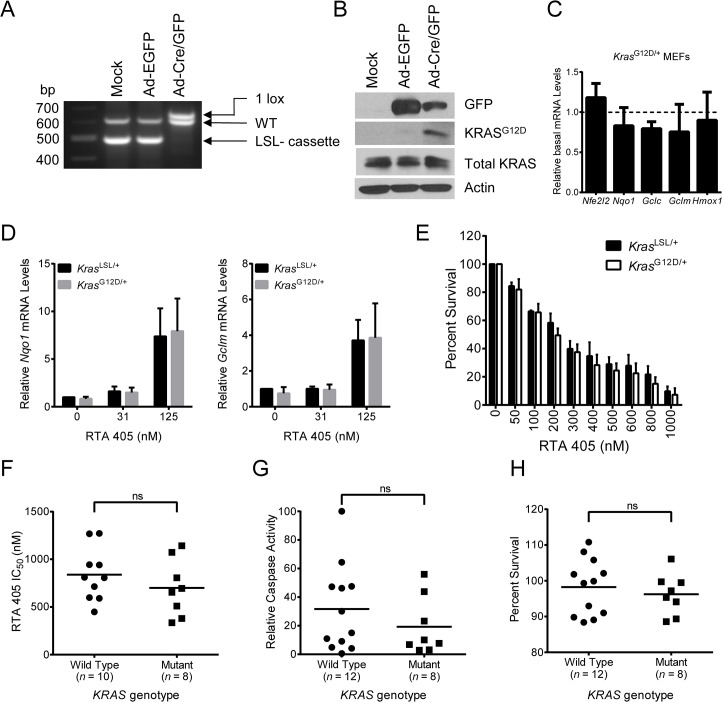
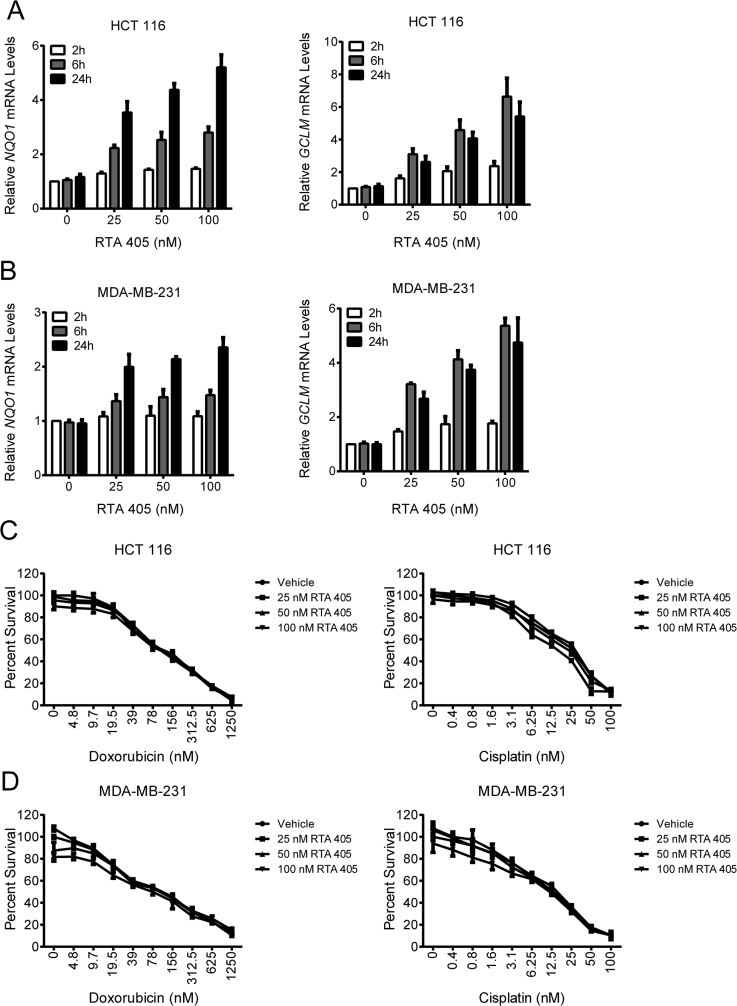
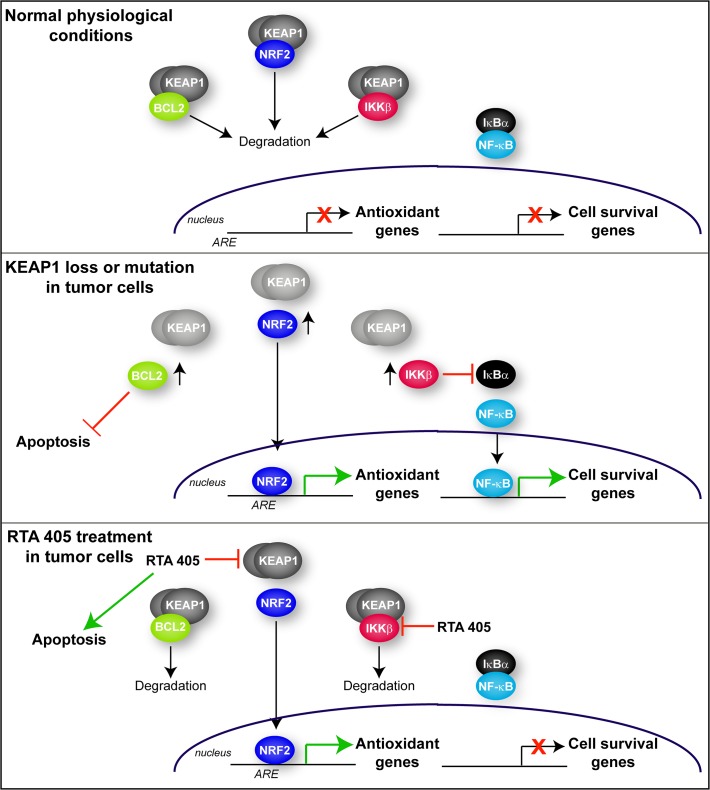
Synthetic triterpenoids are antioxidant inflammation modulators (AIMs) that exhibit broad anticancer activity. AIMs bind to KEAP1 and inhibit its ability to promote NRF2 degradation. As a result, NRF2 increases transcription of genes that restore redox balance and reduce inflammation. AIMs inhibit tumor growth and metastasis by increasing NRF2 activity in the tumor microenvironment and by modulating the activity of oncogenic signaling pathways, including NF-κB, in tumor cells. Accumulating evidence suggests that KEAP1 loss or mutation--which results in high levels of sustained NRF2 activity--may promote cancer growth and increase chemoresistance. Loss of KEAP1 also increases the levels of other oncogenic proteins, including IKKβ and BCL2. The apparent survival advantage provided to some tumor cells by loss of functional KEAP1 raises the question of whether pharmacological inhibition of KEAP1 could promote tumor growth. To address this issue, we characterized the basal levels of KEAP1 and NRF2 in a panel of human tumor cell lines and profiled the activity of an AIM, RTA 405. We found that in tumor cell lines with low or mutant KEAP1, and in Keap1-/- murine embryonic fibroblasts, multiple KEAP1 targets including NRF2, IKKβ, and BCL2 were elevated. Keap1-/- murine embryonic fibroblasts also had higher rates of proliferation and colony formation than their wild-type counterparts. In cells with functional KEAP1, RTA 405 increased NRF2 levels, but not IKKβ or BCL2 levels, and did not increase cell proliferation or survival. Moreover, RTA 405 inhibited growth at similar concentrations in cells with different basal NRF2 activity levels and in cells with wild-type or mutant KRAS. Finally, pre-treatment with RTA 405 did not protect tumor cells from doxorubicin- or cisplatin-mediated growth inhibition. Collectively, these data demonstrate that pharmacological activation of NRF2 by AIMs is distinct from genetic activation and does not provide a growth or survival advantage to tumor cells.


Conflict of interest statement

Competing Interests: The authors have read the journal's policy and have the following conflicts: All authors are current or former employees of Reata Pharmaceuticals. This does not alter the authors' adherence to all the PLOS ONE policies on sharing data and materials.

Figures

Fig 1
Fig 1. Assessment of basal NRF2 activity in a panel of human tumor cell lines.
A. Schematic diagram showing characteristics of cell lines with low (upper panel), moderate (middle panel), or high (lower panel) basal NRF2 activity. B. Protein levels of KEAP1 and NQO1 (whole-cell lysate), and NRF2 (nuclear fraction), were evaluated by western blot. Actin (whole-cell lysate) and HDAC2 (nuclear fraction) served as loading controls. Based on KEAP1, NRF2, and NQO1 protein levels, cell lines were categorized according to their basal NRF2 activity.
Fig 2
Fig 2. Basal levels of NRF2 and KEAP1 targets in a panel of human tumor cell lines.
A. NQO1 mRNA levels for individual cell lines were measured by qPCR and normalized to the average basal NQO1 level for all cell lines with low basal NRF2 activity. B. Total glutathione levels for individual cell lines were normalized to NCI-H460 (set to a value of 1), which was run as a reference in each experiment. Values shown were normalized to the average basal glutathione level for all cell lines with low basal NRF2 activity. C. Reactive oxygen species (ROS) levels for individual cell lines were normalized to NCI-H460 (set to a value of 1), which was run as a reference in each experiment. Values shown were normalized to the average basal ROS level for all cell lines with low basal NRF2 activity. D-E. Basal IKKβ (D) and BCL2 (E) protein levels in human tumor cell lines with low, moderate, or high basal NRF2 activity. Error bars in A-C are SEM. Statistical significance was determined by Mann-Whitney test. *, P < .05; **, P < .01; ***, P < .001.
Fig 3
Fig 3. IKKβ and BCL2 levels in Keap1 -/- murine embryonic fibroblasts.
A. Basal levels of KEAP1-interacting proteins and downstream targets were evaluated in WT and Keap1 -/- MEFs by western blot. GAPDH served as a loading control. B. Basal mRNA levels of Nqo1 and Gclm in WT and Keap1 -/- MEFs measured by qPCR. mRNA levels in Keap1 -/- cells were normalized to WT cells. *, P < .05; **, P < .01 vs. WT by paired t-test. C. Basal mRNA levels of Ccnd1, Mmp9, Ptgs2, and Vegf in WT and Keap1 -/- MEFs measured by qPCR. mRNA levels in Keap1 -/- cells were normalized to WT cells. ***, P < .001; ****, P < .0001 vs. WT by t-test. For all panels, data points are the mean of three independent experiments. Error bars are SD.
Fig 4
Fig 4. Growth rate of cells with different levels of basal NRF2 activity.
A. Growth of WT and Keap1 -/- MEFs over a 72-hour period. ****, P < .0001 vs. WT by t-test. B. Colonies formed by WT and Keap1 -/- MEFs. Percentage of seeded cells that formed colonies is shown. ***, P < .001 vs. WT by t-test. C. Growth of human tumor cell lines with low, moderate, or high basal NRF2 activity over a 72-hour period. Relative growth was determined by dividing SRB absorbance at 72 hours by SRB absorbance at 0 hours. D-F. Effect of NRF2 siRNA on growth of human tumor cell lines. Growth was assessed in NCI-H460 (D), A549 (E), and DU 145 (F) cells using the SRB assay 24, 48, and 72 hours after transfection with non-targeting siRNA or NRF2 siRNA. Mock transfected cells served as a control. *, P < .05; ****, P < .0001 vs. Mock by repeated measures two-way ANOVA and Dunnett’s multiple comparison test. For all panels, data points are the mean of three independent experiments. Error bars in (C) are SEM. All other error bars are SD.
Fig 5
Fig 5. Effect of RTA 405 treatment on the levels and activities of NRF2, IKKβ, and BCL2.
A-B. Effect of 18-hour RTA 405 treatment on mRNA levels of Nqo1 (A) and Gclm (B) assessed by qPCR in MEFs. mRNA levels were normalized to vehicle-treated WT cells. Data points are the mean of three experiments. Error bars are SEM. Statistical significance was determined by one-way ANOVA and Dunnett’s multiple comparisons test. **, P < 0.01; ****, P < 0.0001. C. MG-63, Hep-G2, and A549 cells were treated with the indicated concentrations of RTA 405 for 18 hours and NQO1 mRNA levels were assessed by qPCR. NQO1 mRNA levels were normalized to vehicle-treated MG-63 cells. Data points are mean of three experiments. Error bars are SD. Statistical significance was determined by one-way ANOVA and Dunnett’s multiple comparisons test. Comparisons were made between each concentration of RTA 405 and the vehicle control for each cell line. *, P < 0.05; **, P < 0.01; ****, P < 0.0001; ns, not significant. D. Mean maximum observed fold-increase in NQO1 mRNA levels following treatment with RTA 405 for 18 hours. Error bars are SEM. Statistical significance was determined by Mann-Whitney test. **, P < 0.01; ***, P < 0.001. E. Protein levels of KEAP1-interacting proteins and downstream targets were evaluated by western blot in 8 human tumor cell lines with low basal NRF2 activity following treatment with vehicle or 250 nM RTA 405 for 24 hours. Actin served as a loading control. ND, none detected. F. Protein levels of NRF2 (nuclear fraction) and NQO1, GCLM, TXNRD1, IKKβ, and BCL2 (cytosolic fraction) were evaluated by western blot in the MG-63 osteosarcoma, HCT 116 colon carcinoma, and MDA-MB-231 mammary carcinoma cell lines following treatment with vehicle or RTA 405 for 24 hours. Actin (whole-cell lysate) and Histone H3 (nuclear fraction) served as loading controls. G. Effect of 18-hour RTA 405 treatment on mRNA levels of Ccnd1 (top panel) and Mmp9 (bottom panel) assessed by qPCR. mRNA levels were normalized to those in vehicle-treated WT cells. Data points are the mean of three independent experiments. Error bars are SEM. Statistical significance was determined by one-way ANOVA and Dunnett’s multiple comparisons test. *, P < 0.05; ****, P < 0.0001.
Fig 6
Fig 6. RTA 405 inhibits growth and colony formation in wild type and Keap1 -/- murine embryonic fibroblasts.
A-B. Effect of RTA 405 on growth of WT (A) and Keap1 -/- (B) MEFs over a 72-hour period. C-D. Effect of RTA 405 on colony formation in WT (C) and Keap1 -/- (D) MEFs. In all panels, data points are the mean of three independent experiments and error bars are SD. Statistical significance was determined by t-test. *, P < 0.05; **, P <0.01; ***, P < 0.001; ****, P < 0.0001 vs. vehicle-treated cells.
Fig 7
Fig 7. Effect of RTA 405 on survival in cell lines with low, moderate, or high basal NRF2 activity.
A. IC50 values for cell lines treated with RTA 405 for 48 hours. IC50 values for 2 cell lines (SK-MEL-5 and SK-N-SH) could not be determined using the tested concentration range and are excluded from the graph. B. GI50 values for cell lines treated with RTA 405 for 72 hours. C. Maximum RTA 405-induced caspase-3/7 activity observed in cells treated with 1600 nM RTA 405 for 24 hours. Caspase-3/7 activity was normalized to activity in 786–0 cells (value, 100). D. Cells with low (L), moderate (M), or high (H) basal NRF2 activity were treated with RTA 405 for 24 hours and levels of caspase-3, caspase-9, cyclin D1, CDKN1A (p21), XIAP, and BIRC2 were evaluated by western blot in whole-cell lysates. Actin served as a loading control. E. Cells were mock transfected or transfected with non-targeting or NRF2 siRNA and then treated with RTA 405 for 72 hours. Growth was assessed using the SRB assay. F. Effect of 125 nM RTA 405 on NQO1 mRNA levels. Cells were treated with RTA 405 for 18 hours and NQO1 mRNA levels were assessed by qPCR. G. Cells were treated with 100 nM RTA 405 for 48 hours and cell viability was determined. Percent of vehicle-treated cell survival is shown. For (A, B, G) cell viability was determined using the SRB assay. For (A-C, F, G) data points for individual cell lines are the mean of three individual experiments and horizontal lines are the mean of all cell lines in each group. Statistical significance was determined by Mann-Whitney test. ns, not significant; *, P < 0.05; **, P < 0.01; ***, P < 0.001.
Fig 8
Fig 8. Effect of RTA 405 on survival of WT and KRAS mutant cell lines.
A-B. LSL-Kras G12D MEFs were mock-infected or infected with adenoviral-Cre or adenoviral-EGFP for 72 hours. A. PCR was performed using genomic DNA to assess recombination efficiency and excision of the STOP cassette. B. Levels of total Kras and KrasG12D proteins were assessed by western blot. GFP and actin served as controls. C. Basal mRNA levels of Nrf2 and NRF2 target genes in Cre-infected LSL-KrasG12D/+ MEFs. Target gene mRNA levels in Cre-infected LSL-KrasG12D/+ MEFs were normalized to those in mock-infected LSL- KrasG12D/+ cells. D. Effect of 18-hour RTA 405 treatment on mRNA levels of Nqo1 (left panel) and Gclm (right panel) assessed by qPCR in mock-infected and Cre-infected LSL-Kras G12D/+ MEFs. mRNA levels were normalized to vehicle-treated, mock-infected LSL-Kras G12D/+ cells. E. Percent survival of mock-infected and Cre-infected LSL-Kras G12D/+ MEFs treated with RTA 405. Cell viability was determined using the SRB assay 48 hours after treatment. Percent of vehicle-treated cell survival is shown. For (C-E), data points are the mean of three experiments and error bars are SD. F. IC50 values for cell lines treated with RTA 405 for 48 hours. IC50 values for 2 cell lines (SK-MEL-5 and SK-N-SH) could not be determined using the tested concentration range and are excluded from the graph. G. Maximum RTA 405-induced caspase-3/7 activity observed in cells treated with 1600 nM RTA 405 for 24 hours. Caspase-3/7 activity was normalized to activity in 786–0 cells (value, 100). H. Cells were treated with 100 nM RTA 405 for 48 hours and cell viability was determined. Percent of vehicle-treated cell survival is shown. For (F-H) data points for individual cell lines are the mean of three individual experiments and horizontal lines are the mean of all cell lines in each group. Statistical significance was determined by the Mann-Whitney test. ns, not significant.
Fig 9
Fig 9. Effect of RTA 405 on doxorubicin- and cisplatin-mediated growth inhibition.
A-B. Effect of RTA 405 treatment on NQO1 (left panel) and GCLM (right panel) mRNA levels in HCT 116 (A) and MDA-MB-231 (B) cells. Cells were treated with the indicated concentrations of RTA 405 for 2, 6, or 24 hours and mRNA levels were assessed by qPCR. Data points are the mean of three independent experiments. Error bars are SD. C-D. Effect of RTA 405 treatment on the growth inhibitory activity of doxorubicin (left panel) or cisplatin (right panel) in HCT 116 (C) and MDA-MB-231 (D) cells. Cells were treated with the indicated concentrations of RTA 405 for 24 hours and then treated with doxorubicin or cisplatin for an additional 72 hours. Cell viability was determined using the SRB assay. Data points, mean percent survival of triplicates; error bars, SD. Data is representative of three individual experiments.
Fig 10
Fig 10. Schematic diagram of the different consequences of genetic loss or mutation of KEAP1 and pharmacological inhibition of KEAP1 by RTA 405.
Upper panel. Under normal physiological conditions, KEAP1 promotes the degradation of its target proteins: NRF2, BCL2, and IKKβ. NRF2 target antioxidant genes and NF-κB target cell survival genes are not expressed. Middle panel. When KEAP1 is mutated or KEAP1 levels are reduced, it is no longer able to promote degradation of its target proteins. Therefore NRF2, IKKβ, and BCL2 levels are elevated. As a result, NRF2 accumulates, translocates to the nucleus and increases expression of antioxidant genes. IKKβ levels also accumulate and phosphorylate IκBα, resulting in its degradation. When IκBα is degraded, NF-κB is able to translocate to the nucleus and increase expression of cell survival genes. Elevated BCL2 levels inhibit apoptosis. Lower panel. RTA 405 binds to KEAP1 and blocks its ability to promote NRF2 degradation. NRF2 then translocates to the nucleus where it is transcriptionally active. However, RTA 405 does not inhibit the ability of KEAP1 to promote BCL2 or IKKβ degradation; therefore, the levels of these proteins are not elevated. Furthermore, RTA 405 also directly inhibits the activity of IKKβ, further reducing downstream NF-κB activity and inhibiting NF-κB target gene expression. RTA 405 also increases apoptosis independently of KEAP1/NRF2.

References

    1. Liby KT, Sporn MB. Synthetic oleanane triterpenoids: multifunctional drugs with a broad range of applications for prevention and treatment of chronic disease. Pharmacol Rev 2012. October;64(4):972–1003. 10.1124/pr.111.004846 - DOI - PMC - PubMed
    1. Probst BL, Trevino I, McCauley L, Bumeister R, Dulubova I, Wigley WC, et al. RTA 408, A Novel Synthetic Triterpenoid with Broad Anticancer and Anti-Inflammatory Activity. PLoS ONE 2015;10(4):e0122942 10.1371/journal.pone.0122942 - DOI - PMC - PubMed
    1. Hong DS, Kurzrock R, Supko JG, He X, Naing A, Wheler J, et al. A Phase I First-in-Human Trial of Bardoxolone Methyl in Patients with Advanced Solid Tumors and Lymphomas. Clin Cancer Res 2012. May 25. - PMC - PubMed
    1. Itoh K, Wakabayashi N, Katoh Y, Ishii T, Igarashi K, Engel JD, et al. Keap1 represses nuclear activation of antioxidant responsive elements by Nrf2 through binding to the amino-terminal Neh2 domain. Genes Dev 1999. January 1;13(1):76–86. - PMC - PubMed
    1. Cleasby A, Yon J, Day PJ, Richardson C, Tickle IJ, Williams PA, et al. Structure of the BTB Domain of Keap1 and Its Interaction with the Triterpenoid Antagonist CDDO. PLoS ONE 2014;9(6):e98896 10.1371/journal.pone.0098896 - DOI - PMC - PubMed

Publication types

MeSH terms

Substances