. 2015 Sep;21(9):1038-47.
doi: 10.1038/nm.3930. Epub 2015 Aug 24.

RAS-MAPK dependence underlies a rational polytherapy strategy in EML4-ALK-positive lung cancer

Affiliations

RAS-MAPK dependence underlies a rational polytherapy strategy in EML4-ALK-positive lung cancer

Gorjan Hrustanovic et al. Nat Med. 2015 Sep.

Abstract

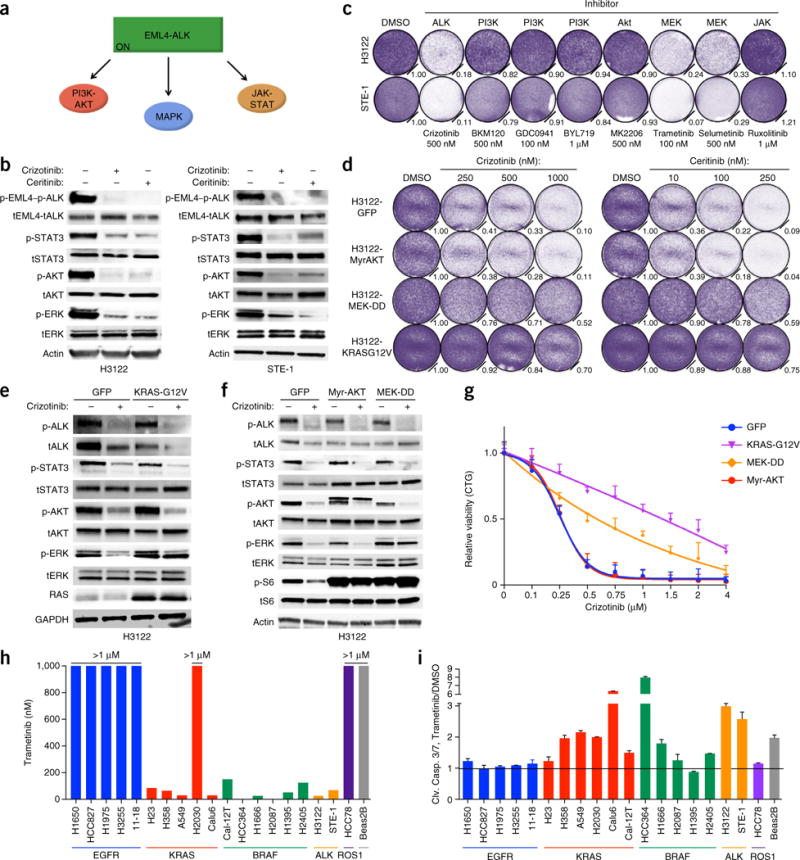
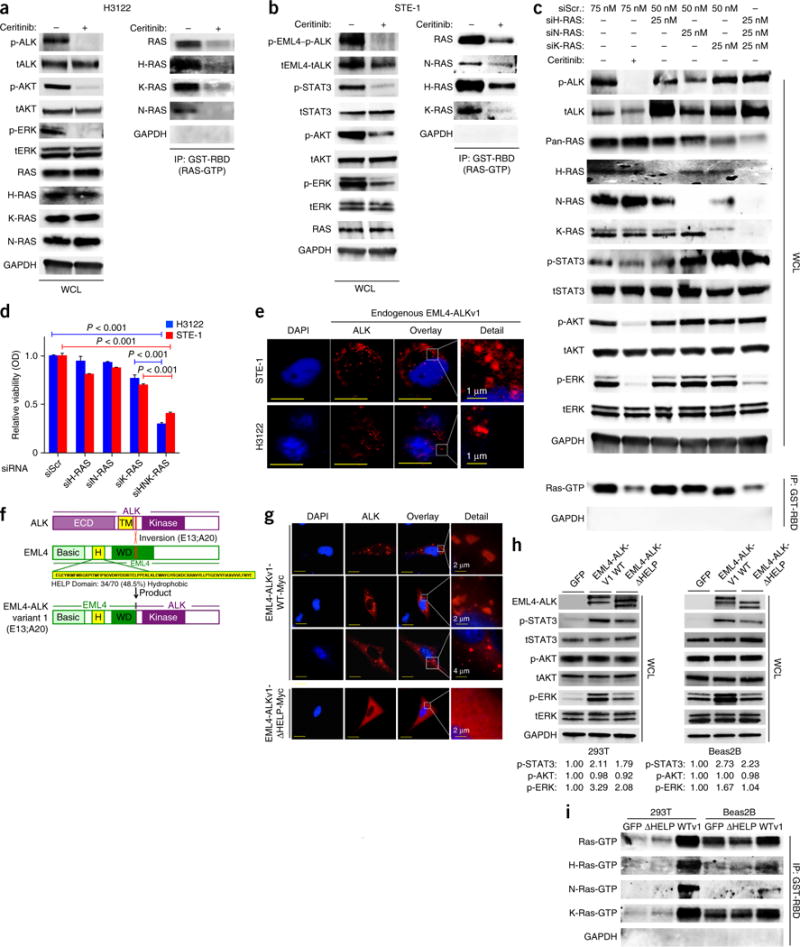
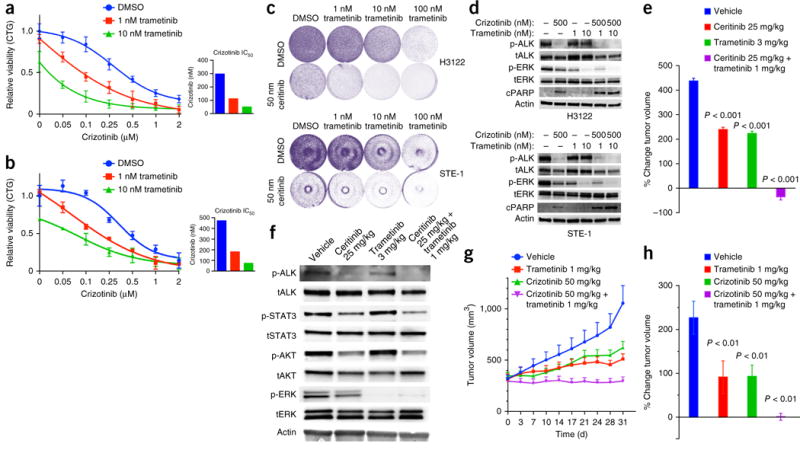
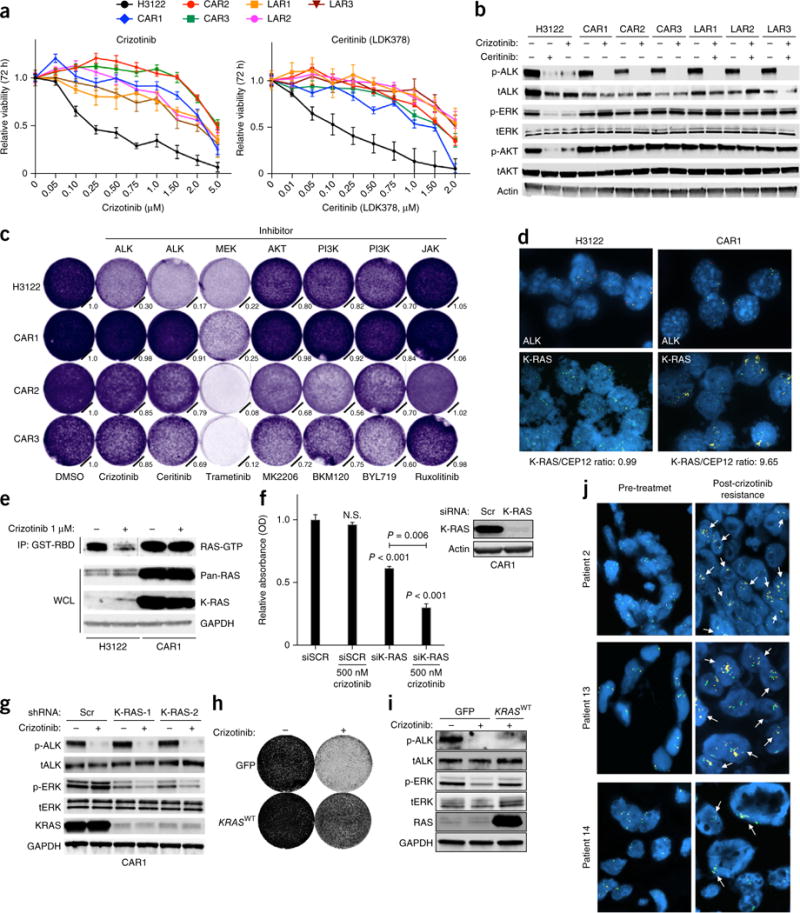
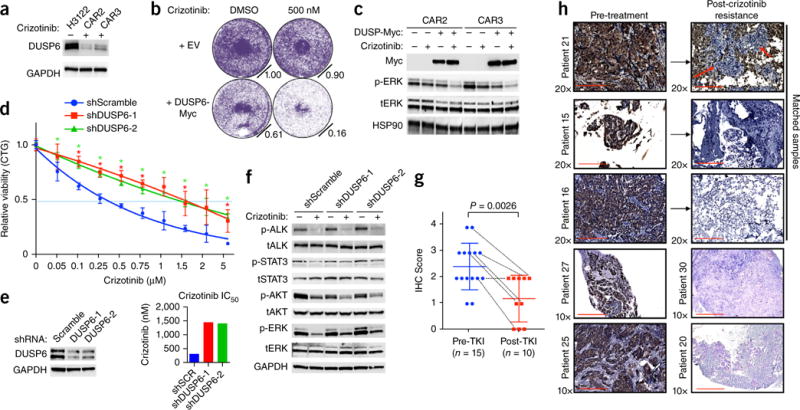
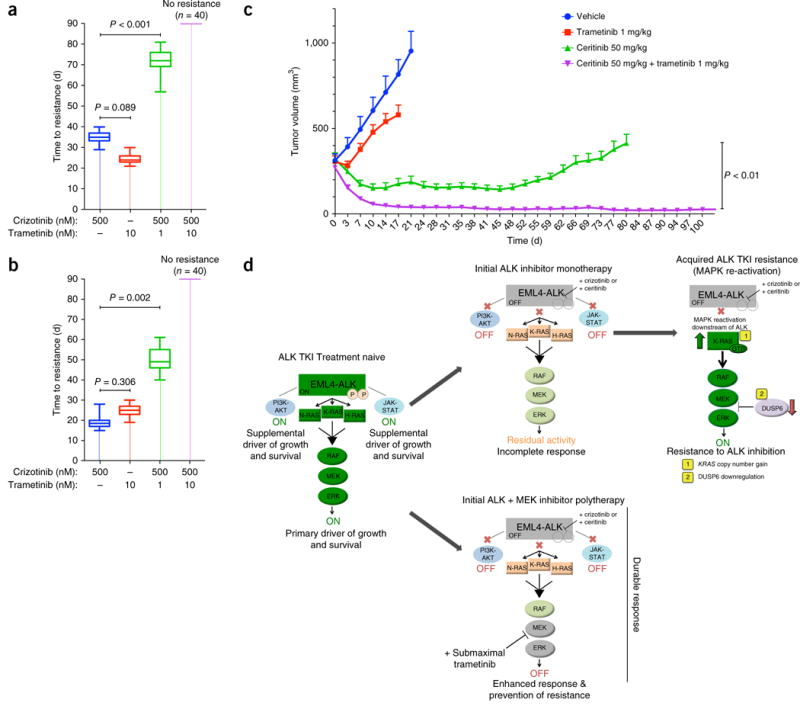
One strategy for combating cancer-drug resistance is to deploy rational polytherapy up front that suppresses the survival and emergence of resistant tumor cells. Here we demonstrate in models of lung adenocarcinoma harboring the oncogenic fusion of ALK and EML4 that the GTPase RAS-mitogen-activated protein kinase (MAPK) pathway, but not other known ALK effectors, is required for tumor-cell survival. EML4-ALK activated RAS-MAPK signaling by engaging all three major RAS isoforms through the HELP domain of EML4. Reactivation of the MAPK pathway via either a gain in the number of copies of the gene encoding wild-type K-RAS (KRAS(WT)) or decreased expression of the MAPK phosphatase DUSP6 promoted resistance to ALK inhibitors in vitro, and each was associated with resistance to ALK inhibitors in individuals with EML4-ALK-positive lung adenocarcinoma. Upfront inhibition of both ALK and the kinase MEK enhanced both the magnitude and duration of the initial response in preclinical models of EML4-ALK lung adenocarcinoma. Our findings identify RAS-MAPK dependence as a hallmark of EML4-ALK lung adenocarcinoma and provide a rationale for the upfront inhibition of both ALK and MEK to forestall resistance and improve patient outcomes.


Conflict of interest statement

COMPETING FINANCIAL INTERESTS

The authors declare competing financial interests: details are available in the online version of the paper.

Figures

Figure 1
Figure 1
EML4-ALK (E13;A20, variant 1) lung adenocarcinoma cells are specifically dependent upon MAPK signaling. (a) Known EML4-ALK effector pathways. ON, activated. (b) Immunoblot analysis showing inhibition of EML4-ALK effector pathways in H3122 and STE-1 cells treated for 1 h with crizotinib (1 μM) or ceritinib (200 nM) (+) or not (−). Actin (bottom) serves as a loading control; ‘t’ before protein designation indicates total protein. (c) Crystal violet staining and quantification of H3122 and STE-1 cells 5 d after treatment with dimethyl sulfoxide (DMSO) or the indicated inhibitors (target inhibition, Supplementary Fig. 1a,b). Quantification (relative number of stained cells) is shown at bottom right of each plate. (d) Growth-inhibition response to 5 d of treatment with crizotinib or ceritinib in H3122 cells expressing cDNA encoding green fluorescent protein (H3122-GFP) or activated AKT (myristoylated AKT (H3122-MyrAKT)), MEK (H3122-MEK-DD) or RAS (H3122-KRASG12V). (e,f) Immunoblot analysis, with antibodies against the indicated molecules, of lysates of H3122-GFP control cells (e,f) and H3122-K-RAS-G12V cells (e) or H3122-Myr-AKT and H3122-MEK-DD cells (f) treated with 250 nM crizotinib for 30 min (+) or not (−). GAPDH (bottom) serves as a loading control throughout. (g) Growth-inhibition response to 72 h of treatment with crizotinib in STE-1 cells expressing cDNA as in d, relative to untreated controls, presented as ‘CellTiterGlo’ (CTG). (h) Half-maximal inhibition concentration (IC50) values (above bars) for the trametinib dose response in a panel of lung cancer cell lines with the indicated genetic drivers. (i) Induction of cleavage of caspases 3 and 7 (Clv. Casp. 3/7) in the cell lines in h after 24 h of treatment with 100 nM trametinib; values are normalized to those of DMSO-treated cells (Trametinib/DMSO). Data are representative of three experiments (bi; error bars (g,i), s.e.m.).
Figure 2
Figure 2
Cells expressing EML4-ALK (E13:A20, variant 1) activate H-, N- and K-RAS to drive MAPK signaling, via the HELP domain of EML4. (a,b) Immunoblot analysis, with antibodies against the indicated molecules, of whole-cell lysates (WCL) or GST-RBD-immunoprecipitated (IP) lysates of H3122 (a) and STE-1 (b) cells treated for 30 min with 200 nM ceritinib (+) or not (−). (c) Immunoblot analysis, with antibodies against the indicated molecules, of WCL or GST-RBD IP lysates of cells transfected with scrambled siRNA (siScr) or siRNA directed against H-RAS (siH-RAS), N-RAS (siN-RAS) or K-RAS (siK-RAS) and treated with 200 nM ceritinib (+) or DMSO (−) for 30 min. (d) Crystal violet assay of cell cultures treated as in c or with siRNA directed against all three RAS isoforms (siHNK-RAS) OD, optical density. P < 0.001 (unpaired t-test). (e) Immunofluorescence staining of endogenous EML4-ALK in STE-1 and H3122 cells with antibody against ALK. Red shows EML4-ALK expression; blue shows DAPI nuclear staining. Inset (far right) shows high magnification of EML4-ALK localization. Representative images from three independent experiments are shown. Scale bars indicate 10 μM. (f) Schematic of ALK (top), showing the extra-cellular domain (ECD) and transmembrane domain (TM), as well as the E13;A20 inversion (below); EML4 (middle), showing the hydrophobic HELP domain (H) and WD-repeat domain (WD); and the EML4-ALK variant 1 (E13:A20) (bottom). (g) Immunofluorescence staining of overexpressed Myc-tagged EML4-ALKWT (EML4-ALKv1-WT-Myc) or ΔHELP EML4-ALK (EML4-ALKv1-ΔHELP-Myc) with antibody against the Myc tag in Beas2B cells. Red shows EML4-ALK expression; blue shows DAPI nuclear staining. Inset (far right) shows high magnification of EML4-ALK localization. Representative images from three independent experiments are shown. Scale bars indicate 15 μm. (h) Immunoblot analysis, with antibodies against the indicated molecules, of lysates of Beas2B and 293T cells transfected with the indicated constructs. Below, expression of each phosphorylated protein relative to that in the GFP-control condition, assessed by densitometry. (i) GST-RBD pulldown assays to isolate Ras-GTP, with immunoblotting using RAS isoform-specific antibodies, in the cells in h. Data shown are n = 3, ±s.e.m., for quantitative assays and for immunoblot assays representative of three independent experiments.
Figure 3
Figure 3
Enhanced therapeutic effect of upfront co-treatment with an ALK inhibitor and a sub-maximal MEK inhibitor. (a,b) Growth-inhibition response (as in Fig. 1g) of H3122 (a) and STE-1 (b) cells treated with crizotinib together with DMSO or trametinib (1 nM or 10 nM). Insets (right) display crizotinib IC50 values. (c) Crystal violet cell-growth assays of H3122 cells (top) and STE-1 cells (bottom) treated as in a,b. (d) Immunoblot analysis, with antibodies against the indicated molecules, of H3122 and STE-1 cells treated for 24 h with crizotinib (500 nM) or trametinib (100 nM) or a combination of those. n ≥ 3, data are shown ±s.e.m. for quantitative assays and for immunoblots representative of three or more independent experiments. (e) Tumor volume (mm3) of H3122 xenografts at 23 d after treatment initiation with ceritinib (25 mg/kg), trametinib (3 mg/kg) or a combination of those at a lower dose of trametinib (1 mg/kg). Values shown are the percentage change in tumor volume from baseline (day 0) ±s.e.m., n = 8 tumors per group. P values, treatment group versus vehicle (unpaired t-test). (f) Immunoblot analysis, with antibodies against the indicated molecules, of lysates from H3122 xenograft tumors 48 h after each treatment. (g,h) Tumor volume (mm3) of STE-1 xenografts during treatment with crizotinib (50 mg/kg), trametinib (1 mg/kg) or a combination of those. Values shown are the tumor volumes over time from baseline (day 0) ±s.e.m., n = 8 tumors per group. P < 0.01, treatment group versus vehicle (unpaired t-test).
Figure 4
Figure 4
Reactivation of MAPK signaling by KRASWT copy-number gain promotes ALK-inhibitor resistance in EML4-ALK lung adenocarcinoma. (a) Viability of H3122 cells, CAR1–CAR3 cells and ceritinib (LDK378)-resistant cells (LAR1–LAR3) treated (72 h) with the indicated doses of crizotinib or ceritinib; results were normalized to those obtained with DMSO. (b) Immunoblotting of lysates from the indicated cells treated with DMSO or the indicated treatments for 6 h. (c) Growth of H3122 and CAR1–CAR3 cells treated as indicated and stained with crystal violet after 5 d. Normalized cell growth quantification is shown. (d) KRASWT amplification confirmed by FISH in H3122 and CAR1 cells. ALK break-apart (yellow, red), K-RAS (yellow), and CEP12 (control; green) probes are shown, as is the K-RAS/CEP12 ratio. (e) Immunoblotting of WCL and GST-RBD IP lysates of H3122 and CAR1 cells treated with DMSO or 1 μM crizotinib for 30 min (line indicates immunoblot crop). (f) Viability of CAR1 cells transfected with scrambled siRNA or siRNA targeting K-RAS and treated with DMSO or 500 nM crizotinib, assessed by crystal violet staining. N.S., not significant; P < 0.001 or 0.006, for the comparative analysis (unpaired t-test). (g) Immunoblots, with antibodies against the indicated molecules, in lysates of CAR1 cells following the introduction of scrambled shRNA or two independent shRNAs targeting K-RAS and treatment with 1 μM crizotinib or vehicle for 1 h. (h) Crystal-violet growth assay of STE-1 cells expressing GFP or KRASWT and treated with 250 nM crizotinib for 5 d. (i) Immunoblots of GFP- and KRASWT-expressing STE-1 cells treated with 250 nM crizotinib for 1 h. (j) Representative KRAS FISH images showing acquisition of KRASWT amplification in patients #2, #13 and #14. KRAS probes are yellow; CEP12 (control) is green. Arrows indicate representative positive signals. Data are representative of three independent experiments (a–j; error bars (a,f), s.e.m.).
Figure 5
Figure 5
Reactivation of MAPK signaling by suppression of DUSP6 promotes ALK-inhibitor resistance in EML4-ALK lung adenocarcinoma. (a) Immunoblot analysis of DUSP6 expression in H3122 cells and CAR sub-lines. Data shown represent three independent experiments. (b,c) Effects of DUSP6 re-expression in H3122 CAR sub-lines on ALK-inhibitor sensitivity, assessed by crystal violet cell-growth assays (b), and on ALK signaling, assessed by immunoblot analysis (c). Data shown represent three independent experiments. (d) Growth-inhibition response (as in Fig. 1g) to 72 h of treatment with crizotinib in H3122 cells expressing scrambled shRNA or either of two independent shRNAs targeting DUSP6. *P < 0.05, at each concentration (unpaired t-test). (e) Left panel, level of knockdown (by immunoblot analysis), and right panel, IC50 values, of cells in d. (f) Immunoblot analysis in H3122 cells treated with shRNA as in d and treated with 250 nm crizotinib for 30 min. (g,h) Immunohistochemistry analysis (IHC) of DUSP6 expression in pre-treatment (Pre-TKI) and post-resistance (Post-TKI) lung adenocarcinoma tumor biopsies from patients treated with ALK inhibitor (n = 25). TKI, tyrosine kinase inhibitor. Each symbol represents an individual patient tumor; small horizontal lines indicate the mean (±s.d.); dotted lines link results for six individual patients with corresponding paired pre-treatment and after-ALK-inhibitor-resistance tumor samples for analysis. P = 0.0026 between each group (pre-treatment versus post-resistance) (unpaired t-test). Representative images of those used to obtain the immunohistochemistry scores are shown in Supplementary Figure 10d. Red arrows indicate tumor cells. Scale bars indicate 200 μm and 400 μm.
Figure 6
Figure 6
Combined inhibition of ALK and MEK enhances response and eliminates resistance in EML4-ALK lung adenocarcinoma models, in vitro and in vivo. (a,b) Time to acquisition of resistance (defined as days to confluency) in H3122 (a) and STE-1 (b) cells plated in 96-well plates (n = 40) and treated with the indicated drugs. P = 0.002 and P < 0.001, for combination therapy versus control (unpaired t-tests). n = 3, data are presented as box plots, with maximum, minimum and quartile ranges. (c) Tumor volume (mm3) of H3122 xenografts during treatment with ceritinib (50 mg/kg), trametinib (1 mg/kg) or a combination of those, presented as change in tumor volume from baseline (day 0) ±s.e.m., n = 10 tumors per group. P < 0.01, between treatment groups (unpaired t-test). (d) Graphical depiction of the model for EML4-ALK oncogene dependence, in which the tumor cells are dependent primarily on RAS-MAPK signaling. Shown is the mechanism of enhanced efficacy of combined treatment with an ALK inhibitor and a (sub-maximal) MEK inhibitor. EML4-ALK engages RAS-MAPK signaling as the primary downstream effector pathway to drive tumor cell growth and survival (left panel). Upfront ALK monotherapy leads to an incomplete response and tumor-cell survival due to residual MAPK activity (middle top panel). Eventually, these cells acquire resistance to ALK monotherapy by fully rescuing MAPK downstream of EML4-ALK via (1) KRASWT copy number gain or (2) downregulation of the MAPK phosphatase DUSP6 (right top panel). Initial ALK inhibitor–MEK inhibitor polytherapy abrogates this residual MAPK kinase activity to promote greater and more durable upfront responses by minimizing tumor-cell survival and re-activation of MAPK signaling (middle bottom panel).

Comment in

References

    1. Solomon BJ, et al. First-line crizotinib versus chemotherapy in ALK-positive lung cancer. N Engl J Med. 2014;371:2167–2177. - PubMed
    1. Shaw AT, et al. Ceritinib in ALK-rearranged non-small-cell lung cancer. N Engl J Med. 2014;370:1189–1197. - PMC - PubMed
    1. Camidge DR, Doebele RC. Treating ALK-positive lung cancer—early successes and future challenges. Nat Rev Clin Oncol. 2012;9:268–277. - PMC - PubMed
    1. Shaw AT, et al. Crizotinib versus chemotherapy in advanced ALK-positive lung cancer. N Engl J Med. 2013;368:2385–2394. - PubMed
    1. Robert C, et al. Improved overall survival in melanoma with combined dabrafenib and trametinib. N Engl J Med. 2015;372:30–39. - PubMed

Publication types

MeSH terms

Substances