. 2015 Sep;125(9):3681-91.
doi: 10.1172/JCI81860. Epub 2015 Aug 24.

Adipocyte iron regulates leptin and food intake

Adipocyte iron regulates leptin and food intake

Yan Gao et al. J Clin Invest. 2015 Sep.

Abstract

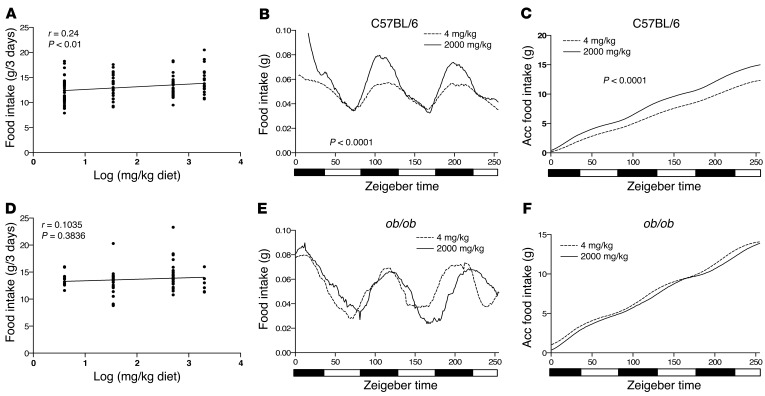
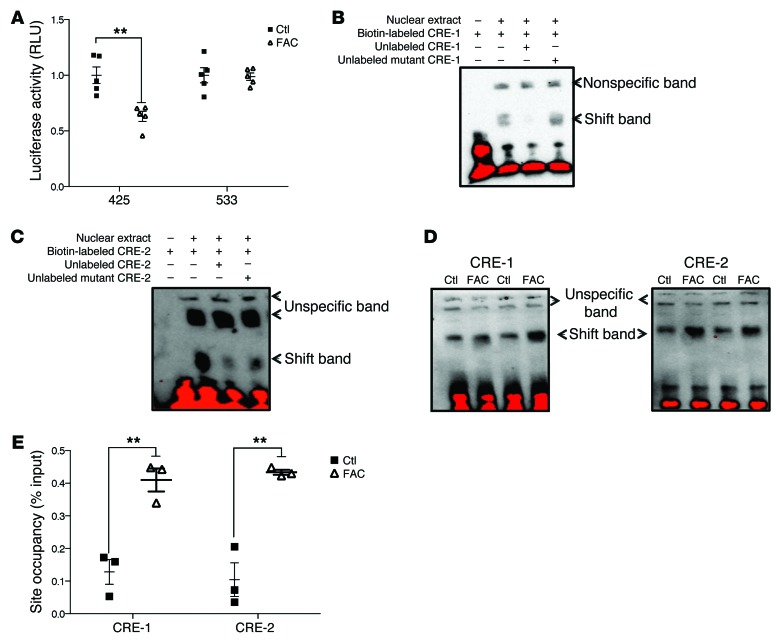
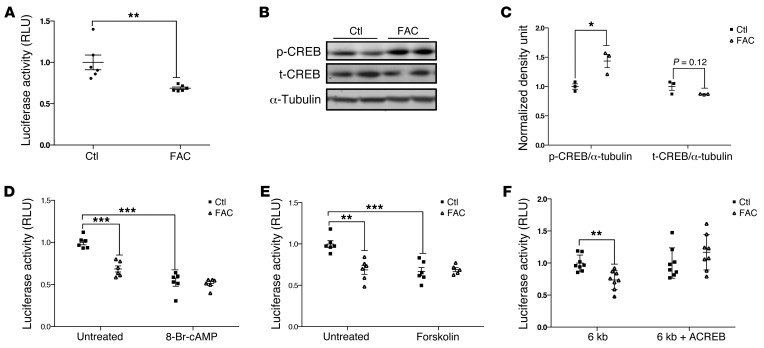
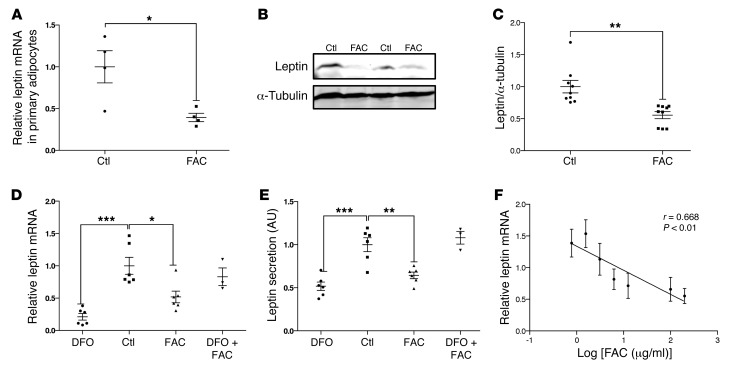
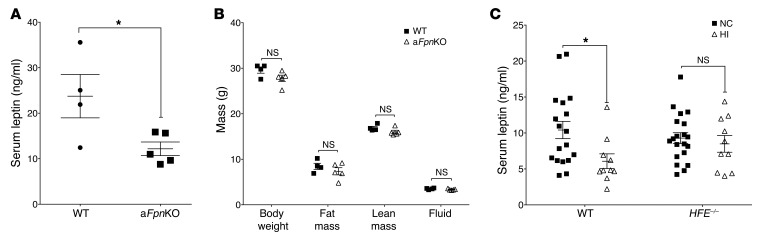
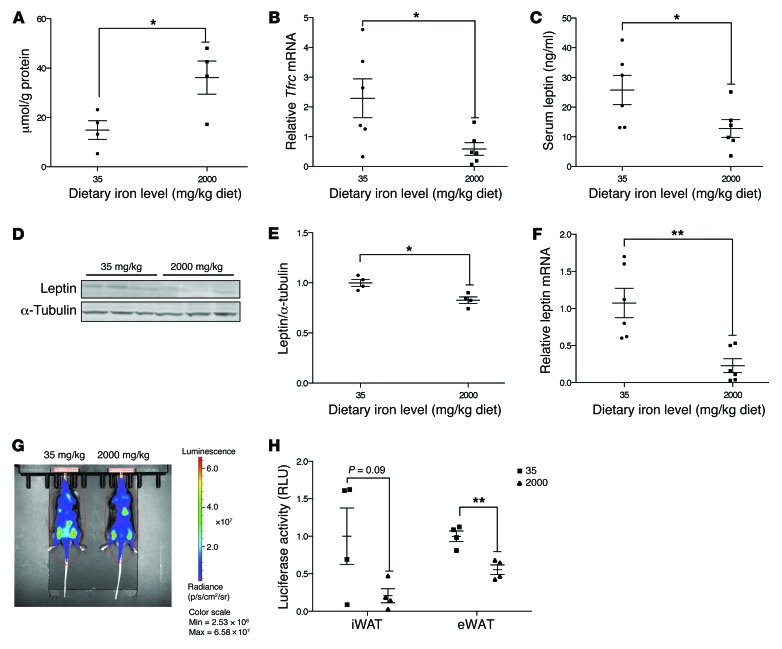
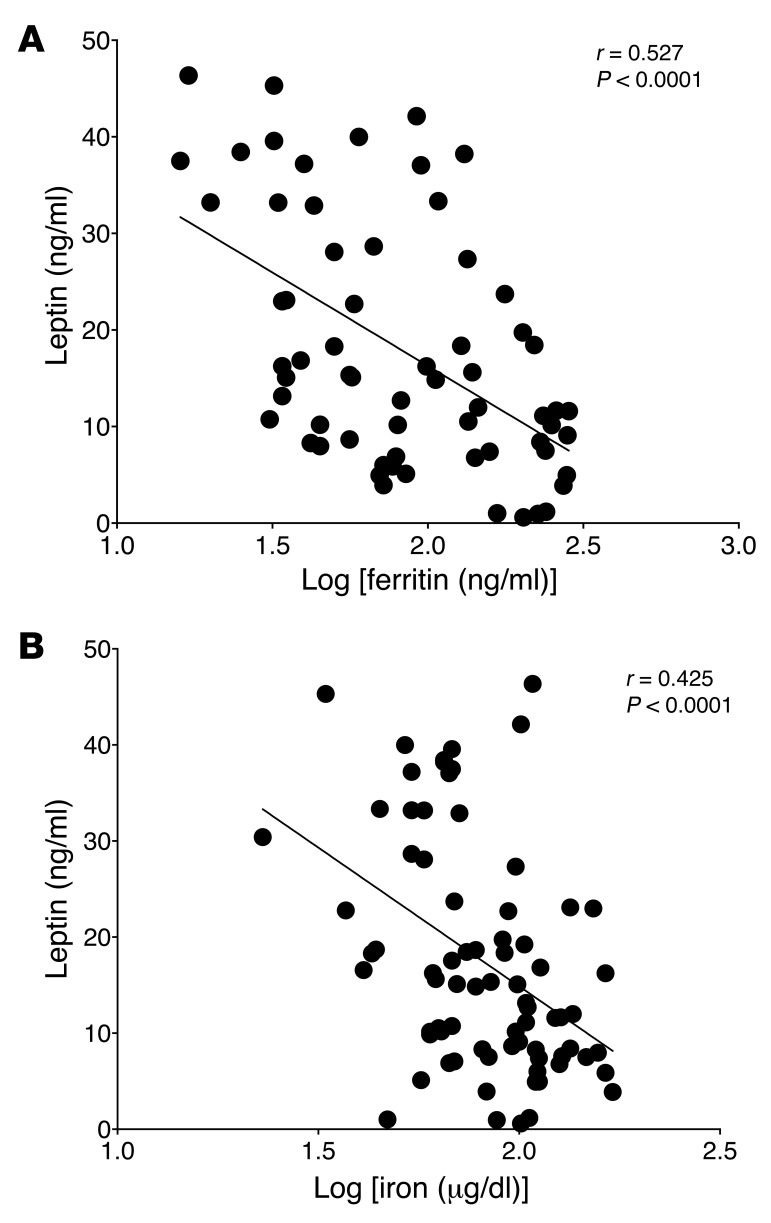
Dietary iron supplementation is associated with increased appetite. Here, we investigated the effect of iron on the hormone leptin, which regulates food intake and energy homeostasis. Serum ferritin was negatively associated with serum leptin in a cohort of patients with metabolic syndrome. Moreover, the same inverse correlation was observed in mice fed a high-iron diet. Adipocyte-specific loss of the iron exporter ferroportin resulted in iron loading and decreased leptin, while decreased levels of hepcidin in a murine hereditary hemochromatosis (HH) model increased adipocyte ferroportin expression, decreased adipocyte iron, and increased leptin. Treatment of 3T3-L1 adipocytes with iron decreased leptin mRNA in a dose-dependent manner. We found that iron negatively regulates leptin transcription via cAMP-responsive element binding protein activation (CREB activation) and identified 2 potential CREB-binding sites in the mouse leptin promoter region. Mutation of both sites completely blocked the effect of iron on promoter activity. ChIP analysis revealed that binding of phosphorylated CREB is enriched at these two sites in iron-treated 3T3-L1 adipocytes compared with untreated cells. Consistent with the changes in leptin, dietary iron content was also directly related to food intake, independently of weight. These findings indicate that levels of dietary iron play an important role in regulation of appetite and metabolism through CREB-dependent modulation of leptin expression.


Figures

Figure 7
Figure 7. Decreased leptin in mice fed different levels of dietary iron is associated with increased food intake.
(A) Food intake is positively associated with dietary iron levels in mice (n = 69 mice/group, Pearson’s r = 0.24, P < 0.01). (B and C) Real-time recording (B) and accumulation of food intake (C) in mice on low- (n = 19 mice/group) and high-iron diets (n = 12 mice/group) (Student’s t test, P < 0.0001 for food intake and accumulated food intake). Black bar in zeitgeber time is nighttime (12 h daily) and white bar is daytime (12 h daily). (D) Dietary iron association with food intake is abolished in ob/ob mice (n = 73 mice/group, Pearson’s r = 0.10, P = 0.38). (E and F) Real-time recording and accumulation of food intake in ob/ob mice with different diet. ob/ob mice fed with high-iron diet (n = 6 mice/group) had no difference in food intake compared with low-iron diet (n = 13 mice/group) in both real-time (E) and accumulated food intake (F). P < 0.0001 using 2-tailed Student’s t tests (B and C). Data represent mean ± SEM.
Figure 6
Figure 6. Iron decreases leptin promoter activity via potential CRE binding sites.
(A) Iron decreases promoter activity in control and the 425 mutant construct, but not the 533 mutant construct (n = 5). (B) EMSA with the CRE-1 oligos, as indicated. Unlabeled CRE-1 abolished protein-probe complex formation, and mutation of the CRE-1 failed to compete the protein-probe interaction. (C) EMSA with the CRE-2 oligos, as indicated. Unlabeled CRE-2 abolished protein-probe complex formation, and mutation of the CRE-2 failed to compete the protein-probe interaction. (D) Nuclear extracts from FAC-treated 3T3-L1 adipocytes had increased protein-probe interaction compared with control group. (E) p-CREB (S133) occupancy at leptin promoter sites was induced by iron. qPCR amplification of DNA sequences flanking CRE-1 and CRE-2 sites from ChIPs performed with p-CREB (S133) antibody (n = 3). **P < 0.01 using Student’s t tests (A and E). Data of figure BD are representative of 3 experiments with n = 3 per replicate. Data represent mean ± SEM.
Figure 5
Figure 5. Iron decreases leptin promoter activity and activates CREB.
(A) Distal leptin promoter–driven luciferase activity (–5986 bp) in the presence or absence of 100 μg/ml FAC (n = 6). (B) Western blot for p-CREB, total CREB (t-CREB), and α-tubulin in 3T3-L1 adipocytes treated with 100 μg/ml FAC for 24 hours. Data are representative of 3 experiments with n = 3 per replicate. (C) Quantitation of Western blots normalized to α-tubulin (n = 3). (D) Distal leptin promoter luciferase activity in 3T3-L1 adipocytes treated with cAMP agonist, 8-Br-cAMP (1 mM), and/or 100 μg/ml FAC for 24 hours (n = 6). (E) Distal leptin promoter luciferase activity in 3T3-L1 adipocytes treated with cAMP agonist, forskolin (2 μM) and/or 100 μg/ml FAC for 24 hours (n = 5 or 6). (F) ACREB abolished the iron-mediated decrease of luciferase activity driven by the distal leptin promoter construct (n = 8). *P < 0.05, **P < 0.01, and ***P < 0.001 using 2-tailed Student’s t tests (A and CF). Data represent mean ± SEM.
Figure 4
Figure 4. Leptin mRNA and protein levels decrease with iron treatment in primary adipocytes or 3T3-L1 adipocytes.
(A) Leptin mRNA levels decrease in collagenased floating primary adipocytes treated with FAC (n = 4). (B) Intracellular leptin protein decreases with FAC treatment. Data are representative of 3 experiments with n = 3 per replicate. (C) Quantification of Western blots normalized to α-tubulin (n = 9). (D and E) Leptin secreted mRNA (D) and protein (E) levels in 3T3-L1 cells following 6-hour treatment with FAC (25 μg/ml), iron chelator desferoxamine (DFO, 100 μM), and FAC (25 μg/ml) plus DFO (100 μM) (n = 3 or 6). (F) Dose response for suppression of leptin mRNA by iron (n = 3, Pearson’s r = 0.668, P < 0.01). *P < 0.05, **P < 0.01, and ***P < 0.001 using 2-tailed Student’s t tests (A, CE). Data represent mean ± SEM.
Figure 3
Figure 3. Serum leptin levels in mouse models with increased and decreased adipocyte iron.
(A) Decreased serum leptin levels in aFpnKO (n = 4 or 5 mice/group). (B) Body composition in aFpnKO compared with WT mice (n = 4 or 5 mice/group). (C) Serum leptin in WT and HFE–/– mice on the 129/SvEvTac background fed normal chow (330 mg/kg) and high-iron (20 g/kg) diets (n = 10–20 mice/group). *P < 0.05 using 2-tailed Student’s t tests. Data represent mean ± SEM.
Figure 2
Figure 2. Serum leptin and adipocyte leptin mRNA levels decrease with dietary iron overload.
(A) Iron levels measured by ferrozine-based colorimetric assay in mice fed low normal– and high-iron diet (n = 4 mice/group). (B) Tfrc mRNA levels quantified by qPCR and normalized to cyclophilin A in adipose tissue from mice fed different levels of dietary iron (n = 6 mice/group). (C) Serum leptin levels from the mice (n = 6 mice/group). (D) Intracellular leptin levels by Western blotting. Data are representative of 3 experiments with n = 4 per replicate. (E) Quantification of leptin protein levels from D normalized to tubulin (n = 4 mice/group). (F) Leptin mRNA levels quantified by qPCR and normalized to cyclophilin A in adipose tissue from mice fed different dietary iron (n = 6 mice/group). (G and H) Leptin expression is downregulated in live imaging (in vivo, G) and in tissue lysate (ex vivo, H) in high-iron–fed transgenic mice expressing the luciferase reporter gene under the control of leptin regulatory sequences. Data are representative of 3 experiments with n = 4 per replicate. *P < 0.05 and **P < 0.01 using 2-tailed Student’s t tests. Data represent mean ± SEM.
Figure 1
Figure 1. Serum ferritin and iron levels are inversely associated with serum leptin levels.
(A) Serum leptin and ferritin levels were measured and correlated in a cohort of subjects with normal ferritin (n = 64, Pearson’s r = 0.527, P < 0.0001). (B) Serum iron levels are inversely associated with serum leptin levels in a cohort of patients with type 2 diabetes, as well as in obese subjects with metabolic syndrome (n = 76, Pearson’s r = 0.425, P < 0.0001).

Comment in

  • Hungry irony.
    Andrews NC. Andrews NC. J Clin Invest. 2015 Sep;125(9):3422-3. doi: 10.1172/JCI83193. Epub 2015 Aug 24. J Clin Invest. 2015. PMID: 26301806 Free PMC article.

References

    1. Lynch SR. Why nutritional iron deficiency persists as a worldwide problem. J Nutr. 2011;141(4):763S–768S. doi: 10.3945/jn.110.130609. - DOI - PubMed
    1. Lawless JW, Latham MC, Stephenson LS, Kinoti SN, Pertet AM. Iron supplementation improves appetite and growth in anemic Kenyan primary school children. J Nutr. 1994;124(5):645–654. - PubMed
    1. Stoltzfus RJ, et al. Low dose daily iron supplementation improves iron status and appetite but not anemia, whereas quarterly anthelminthic treatment improves growth, appetite and anemia in Zanzibari preschool children. J Nutr. 2004;134(2):348–356. - PubMed
    1. Seltzer CC, Mayer J. Serum iron and iron-binding capacity in adolescents. II. comparison of obese and nonobese subjects. Am J Clin Nutr. 1963;13:354–361. - PubMed
    1. Gillum RF. Association of serum ferritin and indices of body fat distribution and obesity in Mexican American men — the Third National Health and Nutrition Examination Survey. Int J Obes Relat Metab Disord. 2001;25(5):639–645. doi: 10.1038/sj.ijo.0801561. - DOI - PubMed

Publication types

MeSH terms