Comparative Study
. 2015 Sep;125(9):3667-80.
doi: 10.1172/JCI81158. Epub 2015 Aug 24.

Comparative genomics reveals multistep pathogenesis of E2A-PBX1 acute lymphoblastic leukemia

Comparative Study

Comparative genomics reveals multistep pathogenesis of E2A-PBX1 acute lymphoblastic leukemia

Jesús Duque-Afonso et al. J Clin Invest. 2015 Sep.

Abstract

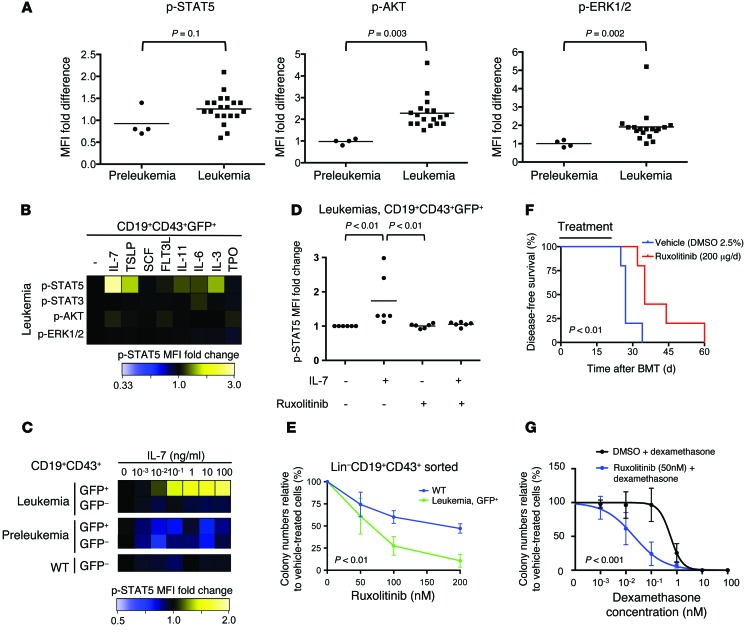
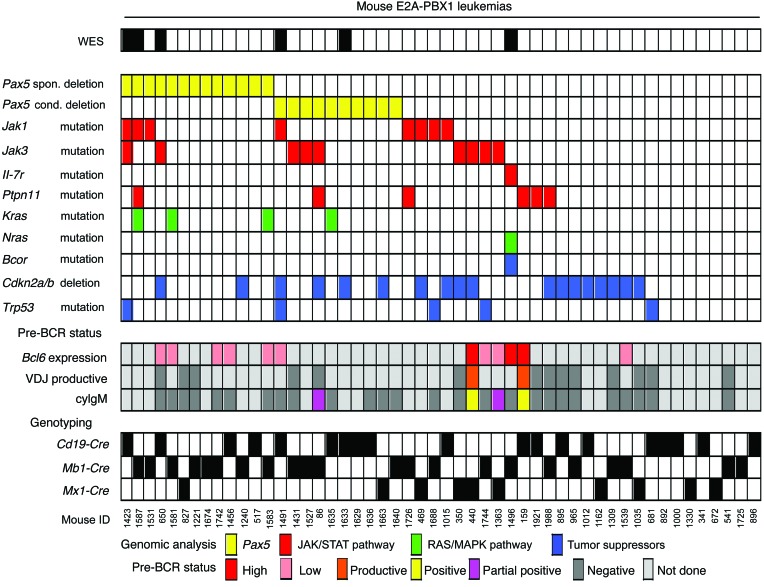
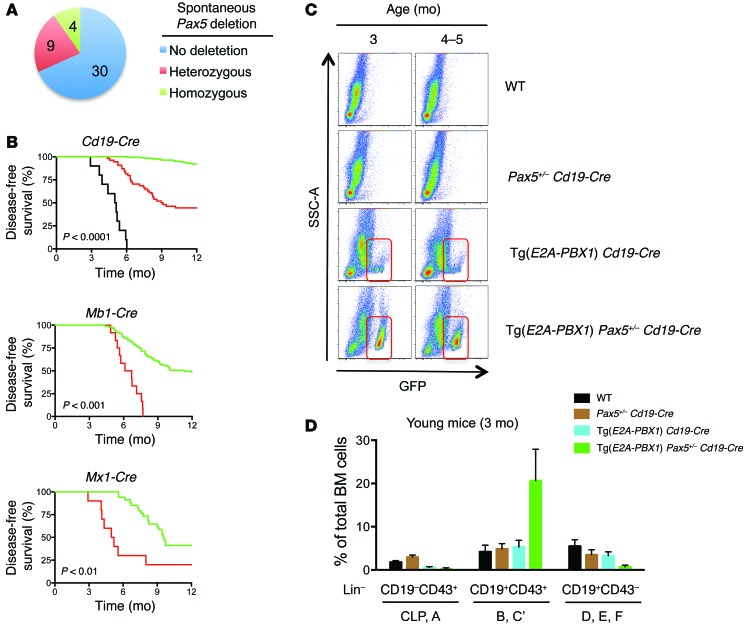
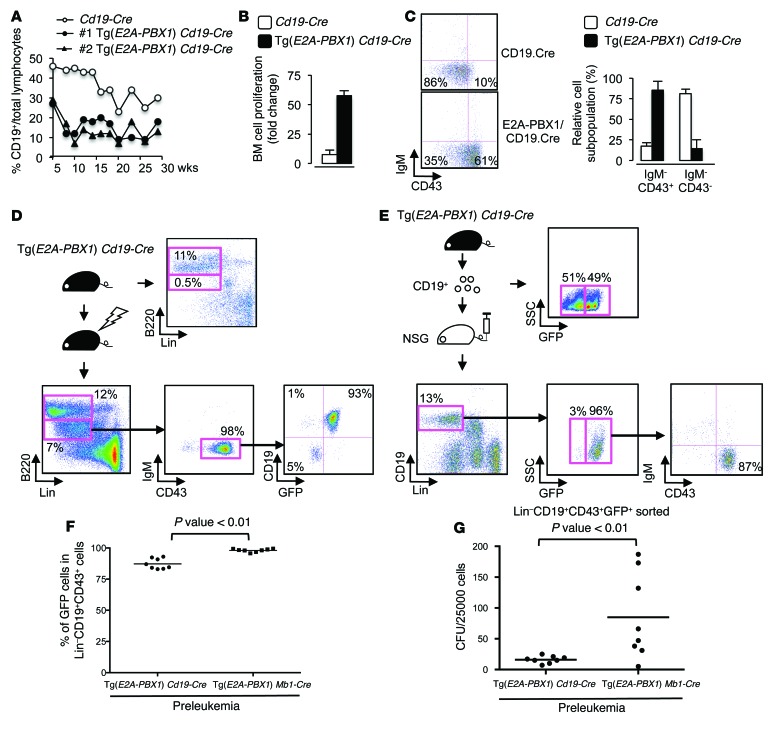
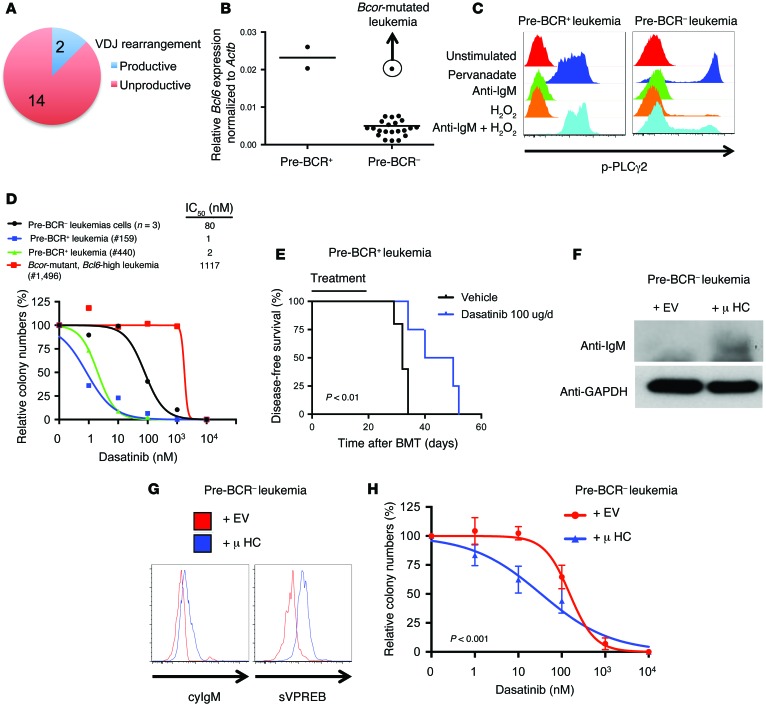
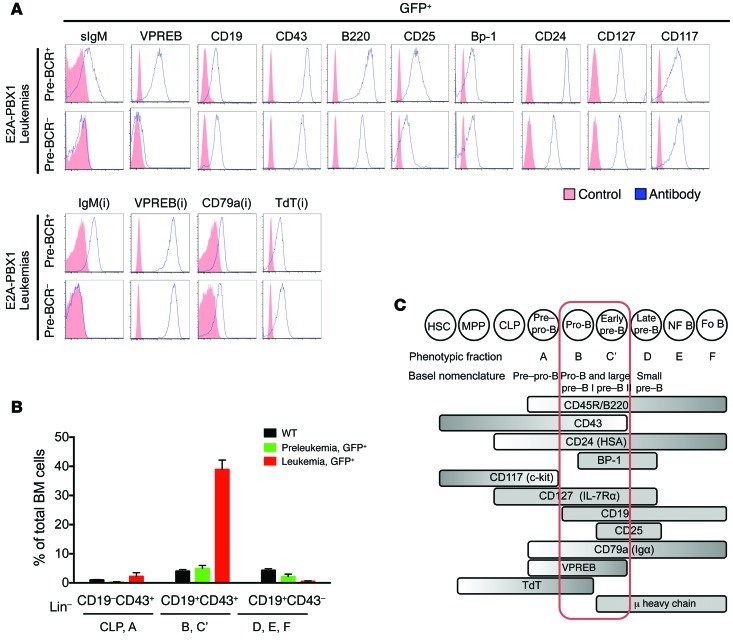
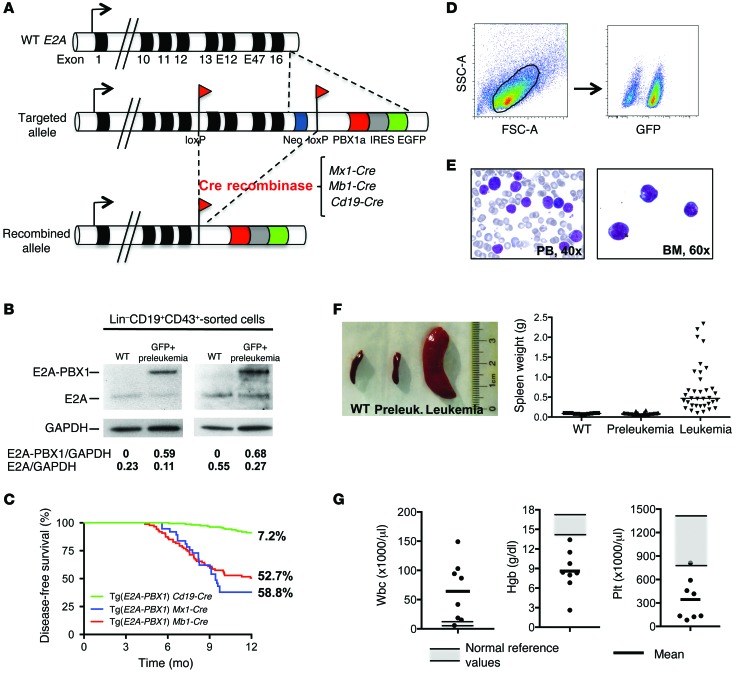
Acute lymphoblastic leukemia (ALL) is the most common childhood cancer; however, its genetic diversity limits investigation into the molecular pathogenesis of disease and development of therapeutic strategies. Here, we engineered mice that conditionally express the E2A-PBX1 fusion oncogene, which results from chromosomal translocation t(1;19) and is present in 5% to 7% of pediatric ALL cases. The incidence of leukemia in these mice varied from 5% to 50%, dependent on the Cre-driving promoter (Cd19, Mb1, or Mx1) used to induce E2A-PBX1 expression. Two distinct but highly similar subtypes of B cell precursor ALLs that differed by their pre-B cell receptor (pre-BCR) status were induced and displayed maturation arrest at the pro-B/large pre-B II stages of differentiation, similar to human E2A-PBX1 ALL. Somatic activation of E2A-PBX1 in B cell progenitors enhanced self-renewal and led to acquisition of multiple secondary genomic aberrations, including prominent spontaneous loss of Pax5. In preleukemic mice, conditional Pax5 deletion cooperated with E2A-PBX1 to expand progenitor B cell subpopulations, increasing penetrance and shortening leukemia latency. Recurrent secondary activating mutations were detected in key signaling pathways, most notably JAK/STAT, that leukemia cells require for proliferation. These data support conditional E2A-PBX1 mice as a model of human ALL and suggest targeting pre-BCR signaling and JAK kinases as potential therapeutic strategies.


Figures

Figure 7
Figure 7. Aberrant activation of signaling pathways in E2A-PBX1 leukemia cells.
(A) Basal phosphorylation of signaling proteins was analyzed by phospho-flow in preleukemic (n = 4) and leukemic E2A-PBX1 (n = 18) BM cells. Results are shown as the MFI of CD19+GFP+ cells compared with that of CD19+GFP cells. Horizontal bars denote the mean. Statistical analysis was performed using a 2-sided Student’s t test. (B) BM leukemia cells were stimulated with cytokines, and the phosphorylation of signaling proteins was analyzed. Heatmap shows the MFI fold induction of a representative of 2 experiments. (C) BM cells were stimulated with IL-7 at increasing concentrations, and p-STAT5 was analyzed. Heatmap shows the MFI fold induction of a representative of 3 experiments. (D) BM cells were pretreated with ruxolitinib (1 μM) or vehicle (DMSO) and then stimulated with IL-7 (10 ng/μl). p-STAT5 MFI was determined and compared with unstimulated/untreated cells. Results from leukemic E2A-PBX1 mice (n = 6) are shown. (E) LinCD19+CD43+ cells from the BM of WT (n = 4) and leukemic E2A-PBX1 mice (n = 5) were FACS sorted and cultured at increasing concentrations of ruxolitinib. Colonies were enumerated, and results are expressed as the mean ± SEM. Statistical analysis was performed using the F test. (F) E2A-PBX1 leukemia cells with a JAK1 L652E mutation were transplanted into sublethally irradiated secondary recipient mice (n = 5 in each cohort). Mice were treated with either vehicle or ruxolitinib (200 μg, i.p.) daily for 20 days. Statistical analysis was performed using the log-rank test. (G) Dose-response curves are shown for leukemia cells (n = 4) cultured in the presence of vehicle or ruxolitinib at increasing concentrations of dexamethasone. Colonies were enumerated, and results are expressed as the mean ± SEM. Statistical analysis was performed using the F test.
Figure 6
Figure 6. Secondary mutations in murine E2A-PBX1 leukemias.
Genetic alterations identified in exome sequencing were validated and analyzed for recurrence in a larger cohort of leukemias (n = 51). Six leukemias (indicated in the top row) were analyzed by WES. All leukemias were analyzed by Sanger sequencing and genomic qPCR. Each column represents a leukemia sample and each row a genetic alteration (deletion or mutation). Identified recurrent genes were functionally grouped as follows: spontaneous and conditional Pax5 deletions (yellow), JAK/STAT signaling pathway (red), RAS/MAPK signaling pathway (green), tumor-suppressor genes (blue). Recurrent genetic alterations were found in 84.3% of leukemias. Pre-BCR status, including the presence of cytoplasmic μ, productive VDJ rearrangement, and Bcl6 expression, was analyzed in selected leukemias. Mouse genotypes are depicted in the lower part of the panel. spon., spontaneous; cond., conditional.
Figure 5
Figure 5. Haploinsufficiency of Pax5 cooperates with E2A-PBX1 to shorten latency, increase leukemia penetrance, and block differentiation.
(A) Frequency of acquired Pax5 deletion in E2A-PBX1 leukemic mice (n = 43) as detected by genomic DNA qPCR. (B) Kaplan-Meier plots show disease-free survival of mice. Conditional E2A-PBX1 mice were crossed with the indicated Cre-recombinase mouse line (green). Additionally, mice were crossed with conditional heterozygous Pax5-deletion mice (red; Cd19, n = 42; Mb1, n = 12; Mx1, n = 9) or conditional homozygous Pax5-deletion mice (black; CD19, n = 10). Statistical differences were determined by log-rank test, and the survival follow-up period was 12 months. (C) Plots show flow cytometric analysis for GFP+ cells in the BM of nonleukemic mice with the indicated genotypes at specific ages. Red rectangle denotes expansion of GFP+ cell populations in Tg(E2A-PBX1) Pax5+/– Cd19-Cre mice at young ages (3 and 4–5 months). (D) Bar graph shows quantification of progenitor B cell subpopulations in the BM of 3-month-old mice with the indicated genotypes (n ≥4), analyzed using an Ab cocktail for lineage markers (CD3, CD4, CD8, Gr1, CD11b, NK1-1, Ter119) and CD19 and CD43 cell-surface antigens.
Figure 4
Figure 4. E2A-PBX1 confers self-renewal properties and impedes differentiation of preleukemic B cell progenitors.
(A) Peripheral blood B cell populations were assessed by flow cytometry at the indicated ages in control and preleukemic (#1 and #2) mice. (B) Bar graphs summarize B cell subset quantification following culture of prospectively isolated progenitor B cells from Tg(E2A-PBX1) Cd19-Cre preleukemic (n = 3) or control mice (n = 3). (C) Flow cytometric analysis at the end of culture for representative control and Tg(E2A-PBX1) Cd19-Cre mice. Bar graphs summarize cell proliferation. (D) WT (n = 4) and preleukemic Tg(E2A-PBX1) Cd19-Cre mice (n = 4) were sublethally irradiated and assessed by flow cytometry for B cell progenitor recovery at 2, 4, 6, and 8 weeks. Results at 6 weeks showed markedly skewed BM repopulation by GFP+ versus control GFP pro-B cells. Similar results were found at the different time points analyzed. (E) BM CD19+ cells (equally composed of GFP+ and GFP cells) isolated from Tg(E2A-PBX1) Cd19-Cre preleukemic mice were transplanted into sublethally irradiated NSG mice (n = 5). GFP+ B cell progenitors had a substantially enhanced engraftment and/or expansion advantage at the analyzed time points (2, 4, and 6 weeks), as shown by flow cytometry. (F) The percentage of GFP+ cells in LinCD19+CD43+ cells from preleukemic Tg(E2A-PBX1) Cd19-Cre (n = 8) and Tg(E2A-PBX1) Mb1-Cre (n = 8) mice was analyzed by flow cytometry. Horizontal bars denote the mean. Statistical analysis was performed using a 2-sided Student’s t test. (G) LinCD19+CD43+GFP+ cells from the previous experiment were sorted and cultured in methylcellulose. CFU were enumerated after 7 days. Horizontal bars denote the mean. Statistical analysis was performed using a 2-sided Student’s t test.
Figure 3
Figure 3. Expression of pre-BCR components in E2A-PBX1 leukemic blasts determines a phenotype very similar to that of human pre-BCR+ leukemias.
(A) Pie chart represents the proportion of analyzed leukemias (n = 16) with a productive or unproductive VDJ rearrangement. (B) Bcl6 expression was assessed by qPCR of sorted LinCD19+CD43+ cells from BM leukemias (n = 24). Leukemias were compared depending on their pre-BCR status. Horizontal bars denote the mean. (C) PLCγ2 phosphorylation was analyzed by phospho-flow after pre-BCR stimulation using polyclonal anti-IgM and H2O2 for 30 minutes (15). Pre-BCR+ and pre-BCR results of 2 analyzed leukemias from each group are shown. Pervanadate was used as a positive control. (D) BM leukemic cells were cultured in the presence of increasing concentrations of dasatinib. Colonies were enumerated after 7 days. (E) E2A-PBX1 leukemia cells from pre-BCR+ leukemia were transplanted into sublethally irradiated secondary recipients. Mice were treated with vehicle (n = 5) or dasatinib (100 μg i.p. daily, n = 4) for 20 days. Statistical analysis was performed by log-rank test. BMT, BM transplantation. (F) Pre-BCR leukemias were transduced retrovirally to ectopically express empty vector (EV) or functional μ heavy chain (μ HC). Results of a representative of 2 transduced leukemias are shown. Western blot shows expression of μ heavy chain and GAPDH as a loading control. (G) Cytoplasmic IgM (cyIgM) and surface VPREB (sVPREB) were assessed by flow cytometry. (H) Transduced pre-BCR leukemias were cultured at increasing concentrations of dasatinib. Colonies were enumerated after 5 days, and results are expressed as the mean ± SEM of 3 independent experiments. Statistical analysis was performed using the F test.
Figure 2
Figure 2. E2A-PBX1 leukemic blasts display B cell precursor immunophenotypes.
(A) Histograms show the immunophenotypic profiles for the indicated surface and intracellular (i) markers in GFP+ leukemic blasts of representative pre-BCR+ and pre-BCR leukemias from 8 analyzed leukemias. Higher levels of cytoplasmic μ heavy chain (cyIgM) and surface VPREB correlated with productive VDJ rearrangement. Red shadow represents control unstained cells for cell-surface markers and isotype controls for intracellular staining. Blue line represents antigen expression. (B) Quantification of progenitor B cell subpopulations in the BM at 3 months of age for WT (n = 7), healthy E2A-PBX1 preleukemic (n = 8), and leukemic (n = 20) mice using an Ab cocktail for lineage markers (CD3, CD4, CD8, Gr1, CD11b, NK1-1, Ter119), CD19, and CD43. (C) Schematic representation of cell surface and intracellular markers expressed in leukemic GFP+ blasts, which correlate with the B-C’ differentiation stage (pro-B, pre–B I, large pre–B II) of B cell development (modified from ref. 12). CLP, common lymphoid progenitors; Fo B, follicular B cells; HSA, heat-stable Ag, MPP, multipotential progenitors; NF B, newly formed B cells .
Figure 1
Figure 1. Conditional E2A-PBX1 Tg mice consistently develop leukemia.
(A) Schematic representation of WT, targeted, and recombined E2A alleles. Cre-mediated recombination results in deletion of 3′ E2A exons (13, E12, E47, and 16) and the PGK neocassette (neo), fusing in-frame the human PBX1a cDNA linked with EGFP by an IRES element. Cre-recombinase was expressed from the B cell–specific promoter Cd19 or Mb1 (CD79a, Igα), or in HSCs from the Mx1 promoter. (B) Representative Western blots show E2A and E2A-PBX1 protein levels in sorted progenitor B cells from WT (LinCD19+CD43+) and healthy preleukemic (LinCD19+CD43+GFP+) Tg(E2A-PBX1) Cd19-Cre mice. The ratio of E2A/GAPDH and E2A-PBX1/GAPDH levels (shown below) was determined by densitometry. (C) Kaplan-Meier plots show disease-free survival of conditional E2A-PBX1 mice crossed with the Cre-recombinase lines Cd19 (n = 153), Mb1 (n = 74), and Mx1 (n = 44). The incidence of leukemia at 12 months is shown on the right. (D) Flow cytometric plots show GFP expression in BM cells from a leukemic mouse. (E) May-Grünwald Giemsa staining of peripheral blood smear (PB) and BM cytospin (BM) show leukemic blast morphology. (F) Spleens are shown for representative WT, preleukemic, and leukemic mice (left panel). Graph shows spleen weights from WT (n = 11), healthy E2A-PBX1 preleukemic (n = 42), and leukemic (n = 35) mice (horizontal bars denote the mean) (right panel). (G) Hematologic findings at leukemia presentation (n = 8). Gray shadows represent normal reference values; horizontal bars denote the mean for the analyzed mice. Hgb, hemoglobin; Plt, platelets, wbc, white blood cells.

Comment in

References

    1. Nowell P, Hungerford D. A minute chromosome in chronic granulocytic leukemia. Science. 1960;142:1497.
    1. Rowley JD. A new consistent chromosomal abnormality in chronic myelogenous leukaemia identified by quinacrine fluorescence and Giemsa staining. Nature. 1973;243(5405):290–293. doi: 10.1038/243290a0. - DOI - PubMed
    1. Rowley JD. Editorial: The role of cytogenetics in hematology. Blood. 1976;48(1):1–7. - PubMed
    1. Kelly LM, Gilliland DG. Genetics of myeloid leukemias. Annu Rev Genomics Hum Genet. 2002;3:179–198. doi: 10.1146/annurev.genom.3.032802.115046. - DOI - PubMed
    1. Mullighan CG. The molecular genetic makeup of acute lymphoblastic leukemia. Hematology Am Soc Hematol Educ Program. 2012;2012:389–396. - PubMed

Publication types

MeSH terms