

On the restricted mean survival time curve in survival analysis
- PMID: 26302239
- PMCID: PMC5114026
- DOI: 10.1111/biom.12384
On the restricted mean survival time curve in survival analysis
Abstract
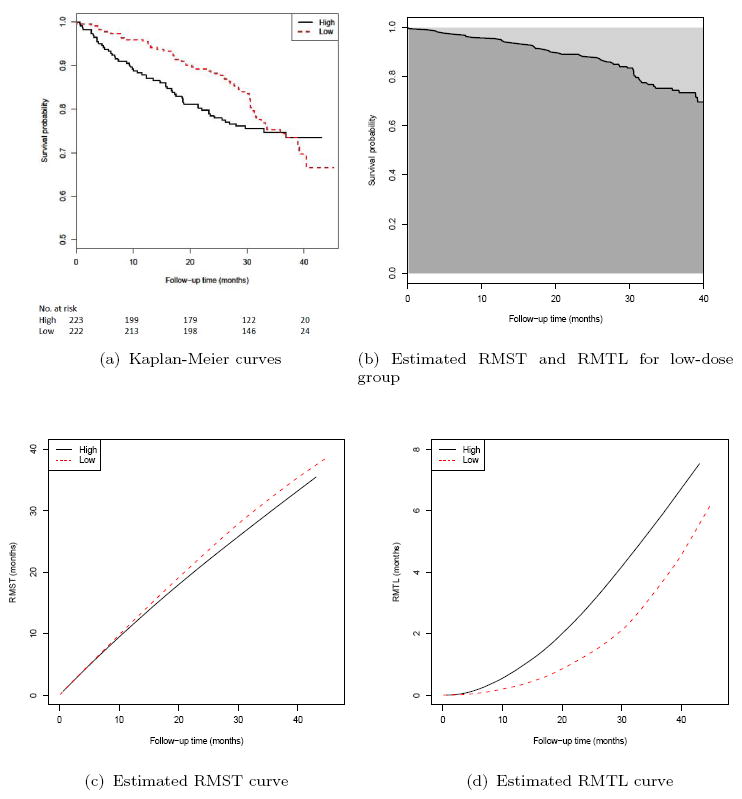
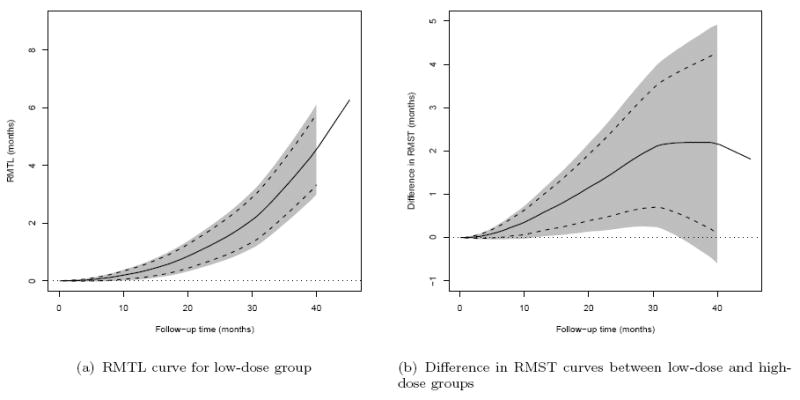
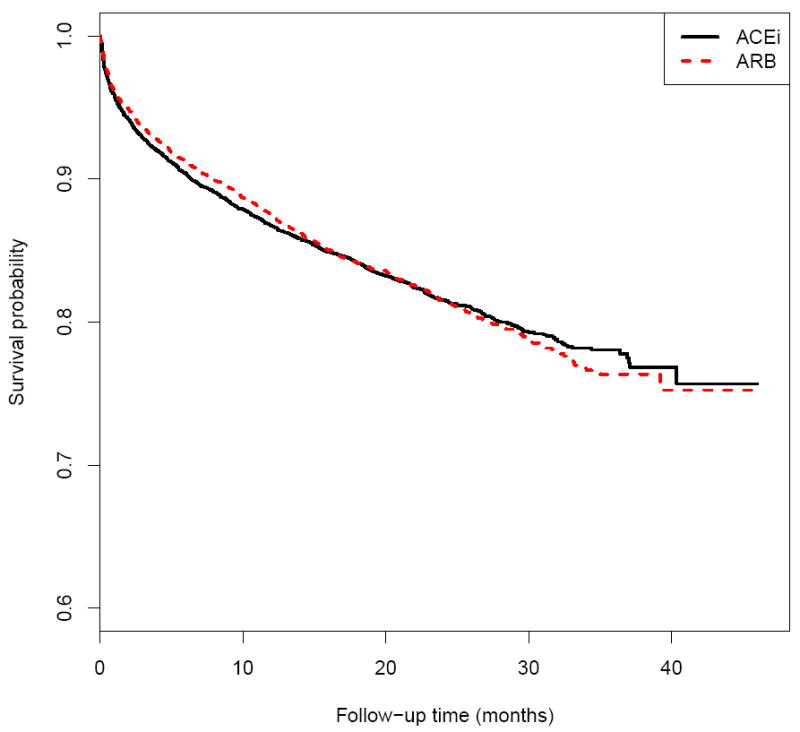
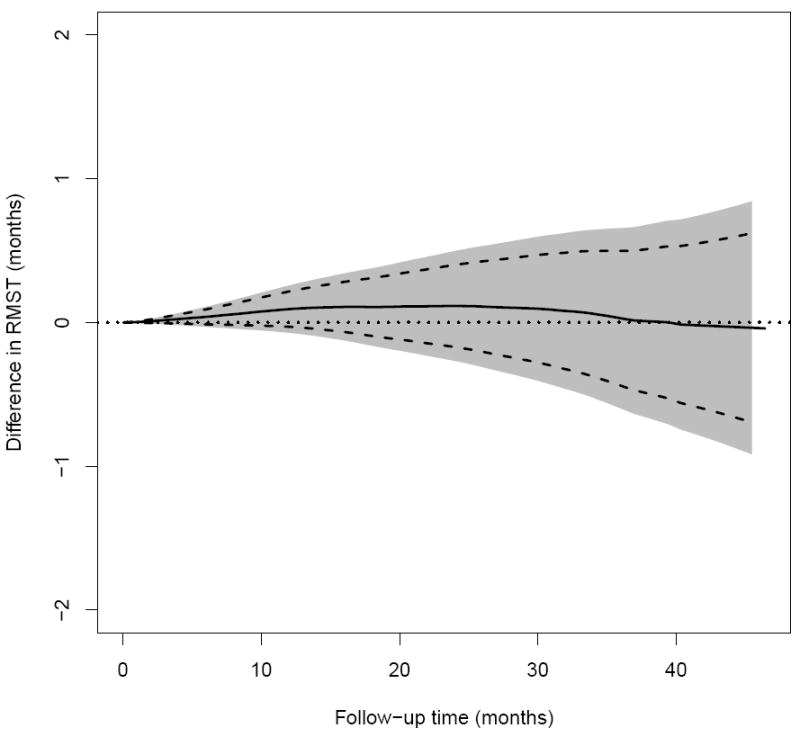
For a study with an event time as the endpoint, its survival function contains all the information regarding the temporal, stochastic profile of this outcome variable. The survival probability at a specific time point, say t, however, does not transparently capture the temporal profile of this endpoint up to t. An alternative is to use the restricted mean survival time (RMST) at time t to summarize the profile. The RMST is the mean survival time of all subjects in the study population followed up to t, and is simply the area under the survival curve up to t. The advantages of using such a quantification over the survival rate have been discussed in the setting of a fixed-time analysis. In this article, we generalize this approach by considering a curve based on the RMST over time as an alternative summary to the survival function. Inference, for instance, based on simultaneous confidence bands for a single RMST curve and also the difference between two RMST curves are proposed. The latter is informative for evaluating two groups under an equivalence or noninferiority setting, and quantifies the difference of two groups in a time scale. The proposal is illustrated with the data from two clinical trials, one from oncology and the other from cardiology.
Keywords: Equivalence/noninferiority study; Gaussian process; Martingale; Simultaneous confidence band; Survival function.
© 2015, The International Biometric Society.
Figures
References
-
- Andersen PK, Hansen MG, Klein JP. Regression analysis of restricted mean survival time based on pseudo-observations. Lifetime Data Analysis. 2004;10:335–350. - PubMed
-
- Chen PY, Tsiatis AA. Causal inference on the difference of the restricted mean lifetime between two groups. Biometrics. 2001;57:1030–1038. - PubMed
-
- Fleming TR, Harrington DP. Counting processes and survival analysis. Vol. 8. Wiley Online Library; 1991.
-
- Gill R. Large sample behaviour of the product-limit estimator on the whole line. The Annals of Statistics. 1983;11:49–58.
Publication types
MeSH terms
Grants and funding
- R01-GM079330/GM/NIGMS NIH HHS/United States
- R01-HL089778/HL/NHLBI NIH HHS/United States
- UM1AI068634/AI/NIAID NIH HHS/United States
- R01 HL089778/HL/NHLBI NIH HHS/United States
- R01-AI024643/AI/NIAID NIH HHS/United States
- UM1 AI068634/AI/NIAID NIH HHS/United States
- R01 AI024643/AI/NIAID NIH HHS/United States
- R01 GM079330/GM/NIGMS NIH HHS/United States
- R21-AG049385/AG/NIA NIH HHS/United States
- UM1 AI068616/AI/NIAID NIH HHS/United States
- UM1AI068616/AI/NIAID NIH HHS/United States
- R21 AG049385/AG/NIA NIH HHS/United States
LinkOut - more resources
Full Text Sources
Other Literature Sources
