. 2015 Aug 24:4:e07935.
doi: 10.7554/eLife.07935.

Phenotypic states become increasingly sensitive to perturbations near a bifurcation in a synthetic gene network

Affiliations

Phenotypic states become increasingly sensitive to perturbations near a bifurcation in a synthetic gene network

Kevin Axelrod et al. Elife. .

Abstract

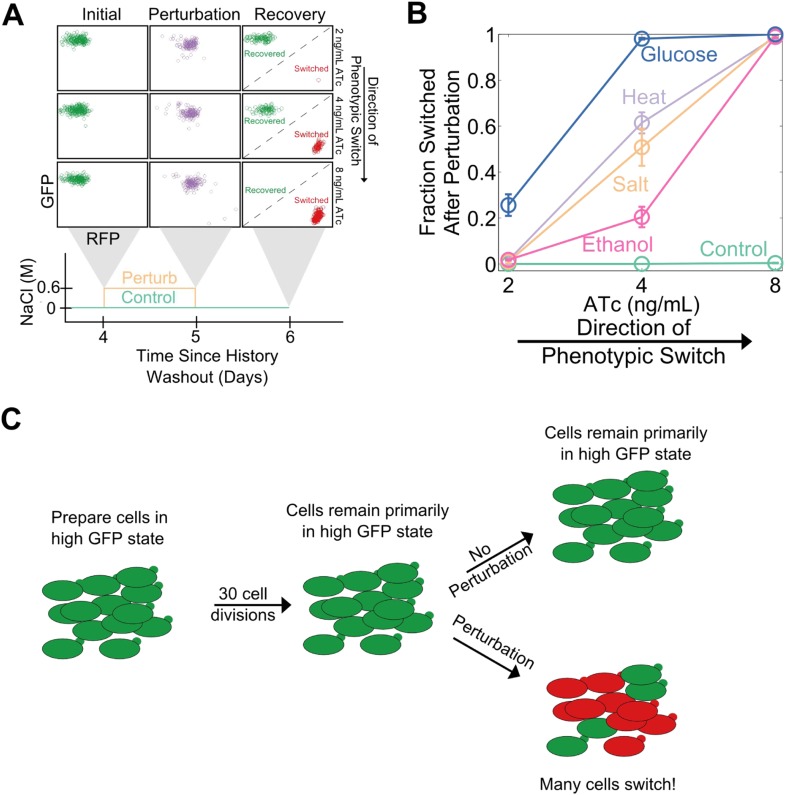
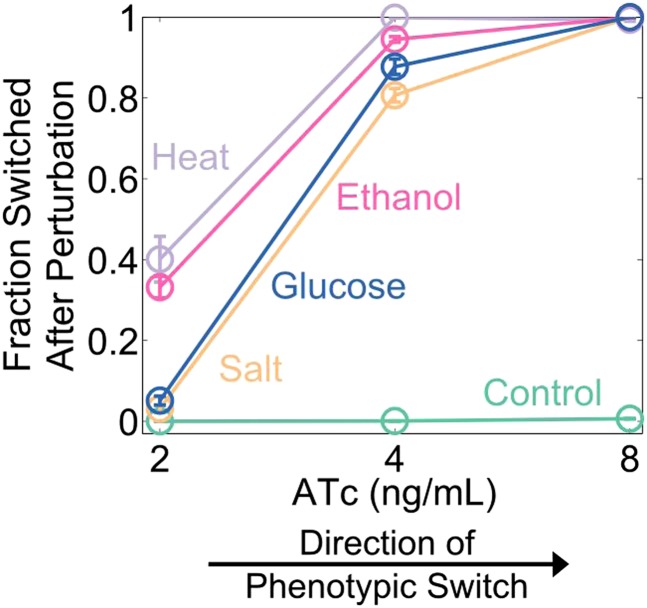
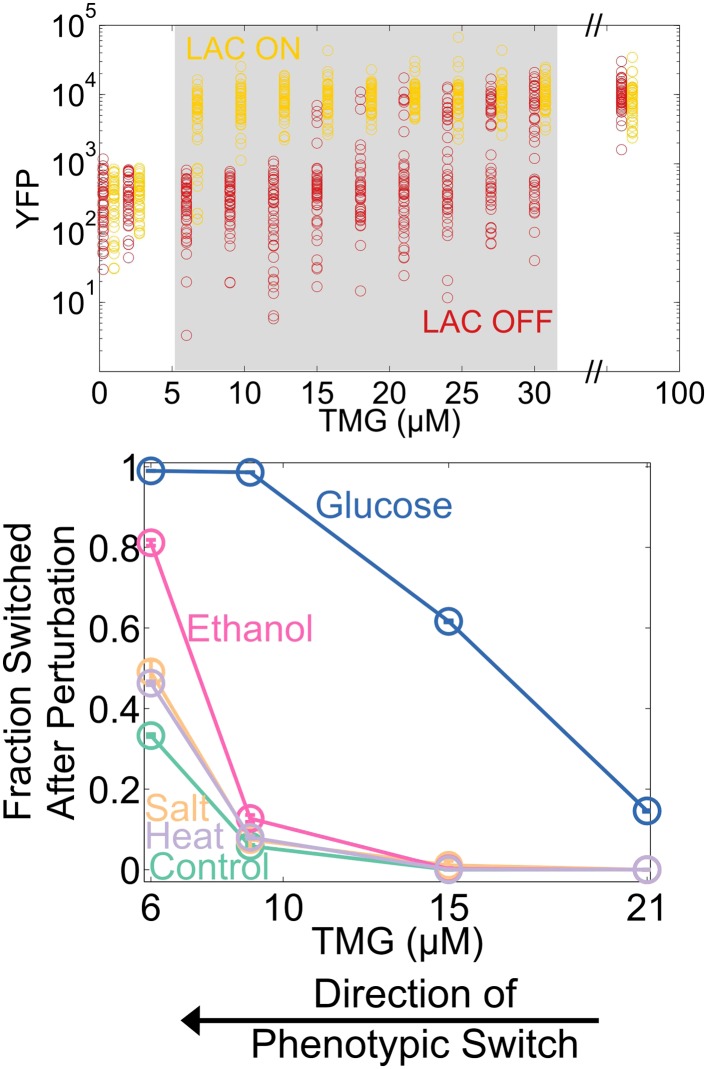
Microorganisms often exhibit a history-dependent phenotypic response after exposure to a stimulus which can be imperative for proper function. However, cells frequently experience unexpected environmental perturbations that might induce phenotypic switching. How cells maintain phenotypic states in the face of environmental fluctuations remains an open question. Here, we use environmental perturbations to characterize the resilience of phenotypic states in a synthetic gene network near a critical transition. We find that far from the critical transition an environmental perturbation may induce little to no phenotypic switching, whereas close to the critical transition the same perturbation can cause many cells to switch phenotypic states. This loss of resilience was observed for perturbations that interact directly with the gene circuit as well as for a variety of generic perturbations-such as salt, ethanol, or temperature shocks-that alter the state of the cell more broadly. We obtain qualitatively similar findings in natural gene circuits, such as the yeast GAL network. Our findings illustrate how phenotypic memory can become destabilized by environmental variability near a critical transition.

Keywords: E. coli; S. cerevisiae; cell memory; computational biology; critical transitions; flow cytometry; resilience; systems biology.


Conflict of interest statement

The authors declare that no competing interests exist.

Figures

Figure 1.
Figure 1.. A toggle switch in yeast exhibits hysteresis and bistability.
(A) A toggle switch consists of two mutually inhibitory transcription factors, two fluorescent readouts of the system state, and two small molecule inhibitors of the transcription factors. (B) Following growth in one of two histories, cells are then diluted into a range of ATc concentrations and propagated in culture for several days. Histogram counts are binned logarithmically. (C) The intensity of GFP fluorescence is plotted as a function of (ATc) for 11 different conditions for the high GFP history (green triangles) and high RFP history (red circles) after 92 hr of growth. The distributions are offset for ease of viewing. 20,000 events are collected, and then a narrow gate is drawn to select several hundred cells of roughly equal size. From this narrow gate, 50 cells at random are plotted. The region of memory is shaded in yellow. DOI: http://dx.doi.org/10.7554/eLife.07935.003
Figure 1—figure supplement 1.
Figure 1—figure supplement 1.. Fraction switched after 92 hr of growth, a proxy for the instability of the state, increases approaching a phenotypic switch.
Yeast cells were pre-grown in the GFP state (green triangles) or RFP state (red circles) and then transferred to a range of ATc concentrations. After 92 hr of growth, the fraction of cells that have switched from their history state to the alternative state is plotted vs ATc. Error bars represent the standard error from three different samples of Forward Scatter Area vs Side Scatter Area (FSC-A vs SSC-A). See Figure 2—figure supplement 2 for details of how a gate is drawn. DOI: http://dx.doi.org/10.7554/eLife.07935.004
Figure 1—figure supplement 2.
Figure 1—figure supplement 2.. The switching kinetics are non-exponential.
Cells were pre-grown in the high RFP state and then transferred to 40 μM IPTG and 2 ng/ml ATc. The fraction of cells remaining in a high RFP state is plotted as a function of time. The switching kinetics are more complicated than what one would expect from first-order kinetics. Error bars represent the standard error from three different samples of FSC-A vs SSC-A. DOI: http://dx.doi.org/10.7554/eLife.07935.005
Figure 2.
Figure 2.. Cellular memory of the high GFP history in the toggle switch loses resilience to directional.
(A) A schematic of how the effective potential changes and the basin of attraction shrinks approaching the critical transition. The size of the basin of attraction is determined by the distance between the stable and unstable fixed points. (B) Far from the critical transition, a perturbation temporarily depresses the value of GFP; the system recovers to its initial state after the perturbation is removed. Close to the critical transition, the same perturbation causes the system to cross the basin boundary into the alternative state. (C) 92 hr after history washout, cells at different distances from the phenotypic switch were exposed to a reduction in (IPTG) from 40 μM to 0.1 μM. Cells grew for 24 hr in this new condition. IPTG was then restored to 40 μM and cells were allowed to recover for 24 hr. Control cells were propagated with (IPTG) held fixed at 40 μM. (D) The fraction of cells that switched into a high RFP state in response to the perturbation is plotted as a function of distance from the tipping point. Two different strength perturbations, a weak (10 μM) and a strong (0.1 μM) are plotted. Error bars in D represent the standard error of three different samplings from forward scatter area (FSC-A) vs side scatter area (SSC-A) (see Figure 2—figure supplement 2). DOI: http://dx.doi.org/10.7554/eLife.07935.006
Figure 2—figure supplement 1.
Figure 2—figure supplement 1.. Cellular memory of the high RFP phenotypic state of the toggle switch loses resilience to directional perturbations.
Cells were pre-grown in the RFP state. 92 hr after history washout, cells at different distances from the phenotypic switch were exposed to an increase in (IPTG) from 40 μM to 360 μM. Cells grew for 24 hr in this new condition. IPTG was then restored to 40 μM and cells were allowed to recover for 24 hr. The fraction of cells that switched into a high GFP state in response to the perturbation is plotted as a function of (ATc). Control cells were propagated with (IPTG) held fixed at 40 μM. Error bars represent the standard error of three different samplings from forward scatter area (FSC-A) vs side scatter area (SSC-A). DOI: http://dx.doi.org/10.7554/eLife.07935.007
Figure 2—figure supplement 2.
Figure 2—figure supplement 2.. To control for cell size, tight gates on FSC-A vs SSC-A are selected for analysis.
10,000 events are collected on the flow cytometer, and the forward scatter area and side scatter area are plotted for each event. A narrow gate (shown in black dashed lines) is drawn to select a subset of cells (approximately 200) for analysis. This effectively decouples fluorescence from cell size, so that differences in fluorescence are due to differences in expression of fluorescent proteins. Error bars in most plots are determined by analyzing three randomly chosen gates and calculating the standard error. DOI: http://dx.doi.org/10.7554/eLife.07935.008
Figure 3.
Figure 3.. Cellular memory of the high GFP history in the toggle switch loses resilience to generic perturbations.
(A) Cells were pre-grown in the high GFP state. 92 hr after history washout, cells at 2, 4, and 8 ng/ml ATc were exposed to an osmotic stress (600 mM NaCl). Cells grew for 24 hr in this new condition. The osmotic stress was then removed and cells were allowed to recover for 24 hr. Control cells were propagated with NaCl held constant throughout the whole time course. Growth media contains trace NaCl (2 mM). (B) The fraction of cells that switched into a high RFP state is plotted as a function of [ATc]. During the 24 hr perturbation period, cells were exposed to 6% ethanol (pink), 600 mM NaCl (peach), 37°C (violet), 0.2% glucose (blue), or no perturbation (teal). Error bars in B represent the standard error of three different samplings from FSC-A vs SSC-A. All results were replicated in a second independent experiment several weeks later (see Figure 3—figure supplement 2). (C) A schematic of the key findings from the perturbation experiments. DOI: http://dx.doi.org/10.7554/eLife.07935.009
Figure 3—figure supplement 1.
Figure 3—figure supplement 1.. Increasing the strength of a generic perturbation increases the probability that cells will switch into the alternative phenotypic state.
Yeast cells expressing the toggle switch were pre-grown in a high GFP state and then transferred to an environmental condition that is close to the phenotypic switch ([ATc] = 8 ng/ml). Cells were perturbed for 24 hr with a salt (upper panel) or an ethanol pulse (lower panel) and then allowed to recover for 24 hr. The fraction of cells that switch into the high RFP state in response to the perturbation is plotted as a function of perturbation intensity. ATc and IPTG were held fixed throughout the perturbation and recovery periods. Control cells were propagated with no supplemental salt or ethanol for comparison. Error bars represent the standard error of measurements from three different gatings on FSC-A vs SSC-A. DOI: http://dx.doi.org/10.7554/eLife.07935.010
Figure 3—figure supplement 2.
Figure 3—figure supplement 2.. A loss of resilience to generic perturbations was confirmed in a second independent experiment.
Same experiment as Figure 3B. Yeast cells expressing the toggle switch were pre-grown in the high GFP state and then transferred to different distances from the critical transition (2, 4, or 8 ng/ml ATc). After 92 hr of growth, the cells were perturbed for 24 hr and then allowed to recover for 24 hr. The fraction of cells that switched into a high RFP state is plotted as a function of (ATc). During the perturbation period, cells were exposed to 6% ethanol (yellow), 600 mM NaCl (peach), 37°C (violet), 0.2% glucose (blue), or no perturbation (teal).Error bars represent the standard error of three different samplings from FSC-A vs SSC-A. DOI: http://dx.doi.org/10.7554/eLife.07935.011
Figure 3—figure supplement 3.
Figure 3—figure supplement 3.. Cellular memory of the RFP state of the toggle switch does not lose resilience to generic perturbations because salt, ethanol, and heat shocks stabilize the high RFP state.
(Left Panel) Yeast cells were pre-grown in the high RFP state. 92 hr after history washout, cells at 2, 4, and 8 ng/ml ATc were exposed to 6% ethanol (pink), 600 mM NaCl (peach), 37°C (violet), 0.2% glucose (blue), or no perturbation (teal). Cells grew for 24 hr in this new condition. The perturbation was then removed and cells were allowed to recover for 24 hr. Control cells were propagated in 2% galactose and 30°C with no salt or ethanol. The fraction of cells that switched into a high GFP state is plotted as a function of (ATc). (Right Panel) The cells were pre-grown in a high GFP state (green) or high RFP state (red) and then transferred to an intermediate distance from the phenotypic switch (4 ng/ml ATc). 92 hr after history washout, the cells were perturbed as described above. The mean fluorescence shifts from its pre-perturbation location (red or green dot) to the tip of the perturbation arrow. Error bars in the left panel represent the Laplacian-corrected binomial counting error. DOI: http://dx.doi.org/10.7554/eLife.07935.012
Figure 4.
Figure 4.. The loss of resilience is due to a shrinking basin of attraction of the phenotypic state.
(A) By examining the RFP-GFP distribution at the end of the recovery period and comparing it to the end of the perturbation period, the basin boundary can be estimated. A cell is assumed to switch when its ratio of GFP to RFP expression falls below some threshold α, so the separatrix is a line with slope 1 and intercept α on a log–log plot. A simple model of the toggle switch supports this assumption (see Figure 4—figure supplement 1). For each [ATc], eight perturbations (10 μM IPTG, 0.1 μM IPTG, 37°C, 200 mM NaCl, 600 mM NaCl, 2% ethanol, 6% ethanol, and 0.2% glucose) were used to estimate α by minimizing the mean-squared deviation between the estimated and measured fractions. (B) The estimated fraction is compared to the measured fraction for [ATc] = 2 ng/ml (□), 4 ng/ml (∆), and 8 ng/ml (○). (C) The unperturbed GFP-RFP distribution for cells at 0 ng/ml (green) and 128 ng/ml (red) is overlaid with the estimated separatrix from 2, 4, and 8 ng/ml. μ ± σ is shaded for each separatrix. (D) The location of the high GFP stable fixed point (green), unstable fixed point (purple), and low GFP stable fixed point (red) are plotted as a function of ATc. The system is bistable for intermediate ATc and monostable at low and high ATc. We assume that switching follows a line in log-space connecting the centroids of the two distributions in Figure 4C (see Figure 4—figure supplement 2). Error bars in all plots represent the standard error from three samplings from the FSC-A vs SSC-A distribution. DOI: http://dx.doi.org/10.7554/eLife.07935.013
Figure 4—figure supplement 1.
Figure 4—figure supplement 1.. A simple model of the toggle switch justifies the assumption that the basin boundary can be approximated as a line in LacI-TetR space.
A deterministic model features cooperative binding of repressor proteins to their promoters (see ‘Materials and methods’ section for details). The system was initialized with a wide range of initial concentrations of LacI and TetR. The system then evolved in time until it reached one of the two stable fixed points. Initial conditions leading to a high LacI state are shaded in green, and initial conditions leading to a high TetR state are shaded in red. The stable fixed points are represented by black circles. The basin boundary is the interface where the red and the green areas meet. Top: the promoters have equal strengths and bottom, the promoters have asymmetric strengths. See also the grey line in figure S7 of reference (Wu et al., 2013). DOI: http://dx.doi.org/10.7554/eLife.07935.014
Figure 4—figure supplement 2.
Figure 4—figure supplement 2.. Cell switching paths approximately follow a line on a log–log plot connecting the stable fixed points.
Yeast cells in a high GFP condition (2 ng/ml ATc) are plotted in green and cells in a high RFP condition (128 ng/ml ATc) are plotted in red. The line connecting the centroids of the distribution is plotted in black. Overlaid in purple is the distribution of cells that were initially in a high GFP state and were then perturbed for 24 hr with a glucose pulse. The unstable fixed point in Figure 4D is estimated by finding the y-coordinate of the intersection of the basin boundary in Figure 4C with the black line above. DOI: http://dx.doi.org/10.7554/eLife.07935.015
Figure 4—figure supplement 3.
Figure 4—figure supplement 3.. Increasing the duration of the perturbation increases the fraction of cells that switch phenotypes in a Gillespie simulation of the toggle switch.
Here, p = 50, K = 15, and γ = 0.5. 100 cells are initialized in a high Lac state and equilibrate for ten generations. Suddenly, K is increased to 100 for a variable time period (ranging from 0.2 to 20 generations). K is then restored to 15, and the cells are allowed to equilibrate for several more generations. At the end of the recovery, we determine what fraction of the cells remains in a high Lac state. DOI: http://dx.doi.org/10.7554/eLife.07935.016
Figure 4—figure supplement 4.
Figure 4—figure supplement 4.. Not all perturbations induce switching in a Gillespie simulation of the toggle switch.
Here, p = 50, K = 15, and γ = 0.5. 100 cells are initialized in a high Lac state and equilibrate for ten generations. Suddenly, K is decreased to 1 for a variable time period (ranging from 0.2 to 20 generations). K is then restored to 15, and the cells equilibrate for several more generations. At the end of the recovery, we determine what fraction of the cells remains in a high Lac state. DOI: http://dx.doi.org/10.7554/eLife.07935.017
Figure 5.
Figure 5.. No significant change in mean fluorescence of the state and no significant increase in coefficient of variation approaching the critical transition.
Yeast cells expressing the toggle switch were pre-grown in the high GFP state (green triangles) or the high RFP state (red circles) and then transferred to a range of ATc concentrations for 92 hr. (A) The mean GFP fluorescence of cells that have not switched from their pre-growth state is plotted against [ATc]. Above 16 ng/ml (for the GFP history) and below 1 ng/ml (for the RFP history), all of the cells have switched into the alternative state. To quantify population variability, the standard deviation normalized to the mean (coefficient of variation, i.e., ‘CV’) is plotted for the B, log-transformed and C, linear values of fluorescence. When calculating variation, only cells that remain in the state they were pre-grown in are analyzed (see inset in B). To minimize the effect of instrument noise in B and C, variation in RFP fluorescence is measured for the RFP history (similarly, variation in GFP is measured for the GFP history). Error bars in A represent the standard error of three samplings from FSC-A vs SSC-A. Error bars in B and C are standard errors from 200 bootstrap resamplings of the data. DOI: http://dx.doi.org/10.7554/eLife.07935.018
Figure 6.
Figure 6.. The yeast galactose network loses resilience to directional perturbations and the generic perturbation ethanol.
(A) 25 hr after history washout, a gal80-inducible strain shows strong memory above 0.05% galactose. The two histories are offset for ease of viewing, and the region of memory is shaded in yellow. 50 cells at random are plotted from a tight gate on FSC-A vs SSC-A. (B) 25 hr after history washout, cells at 0.4%, 0.1%, and 0.08% galactose were exposed to 6% ethanol (pink), 600 mM NaCl (peach), 37°C (violet), 0.1% glucose (blue), or no perturbation (teal). Cells grew for 12 hr in this new condition. The perturbation was then removed and cells were allowed to recover for 12 hr. Control cells were propagated with fixed glucose, galactose, and temperature. The fraction of cells that switched into a low YFP state after the perturbation is plotted as a function of [galactose]. Error bars are standard errors obtained by bootstrap with 200 resamplings of the data. DOI: http://dx.doi.org/10.7554/eLife.07935.019
Figure 6—figure supplement 1.
Figure 6—figure supplement 1.. The Escherichia coli lactose network loses resilience to directional perturbations as well as to the generic perturbation ethanol.
(Upper panel) The cells were pre-grown in either 0 or 100 μM TMG (‘LAC OFF’ and ‘LAC ON,’ respectively) for 20 hr and then diluted into a range of TMG concentrations. After 21 hr of growth, the system exhibits strong hysteresis. A constitutively expressed mCherry allows for discrimination between OFF cells and noise. The region of memory is shaded in gray, and the two histories are offset for ease of viewing. Fifty cells at random are plotted. (Lower panel) 21 hr after pre-growth washout, the cells from the ON history were exposed to several perturbations for 12 hr (blue: 0.01% glucose; pink: 6% ethanol; peach: 1 M NaCl; violet: 43°C). The perturbations were then removed, and the cells were allowed to recover for 12 hr. The fraction of cells that switched into the OFF state is plotted as a function of [TMG]. Control cells (green) were grown at 37°C with no added salt, glucose, or ethanol. Error bars represent the standard error from 200 bootstrap resamplings of the data. DOI: http://dx.doi.org/10.7554/eLife.07935.020

References

    1. Acar M, Becskei A, van Oudenaarden A. Enhancement of cellular memory by reducing stochastic transitions. Nature. 2005;435:228–232. doi: 10.1038/nature03524. - DOI - PubMed
    1. Ajo-Franklin CM, Drubin DA, Eskin JA, Gee EP, Landgraf D, Phillips I, Silver PA. Rational design of memory in eukaryotic cells. Genes & Development. 2007;21:2271–2276. doi: 10.1101/gad.1586107. - DOI - PMC - PubMed
    1. Angeli D, Ferrell JE, Sontag ED. Detection of multistability, bifurcations, and hysteresis in a large class of biological positive-feedback systems. Proceedings of the National Academy of Sciences of USA. 2004;101:1822–1827. doi: 10.1073/pnas.0308265100. - DOI - PMC - PubMed
    1. Biggar SR, Crabtree GR. Cell signaling can direct either binary or graded transcriptional responses. The EMBO Journal. 2001;20:3167–3176. doi: 10.1093/emboj/20.12.3167. - DOI - PMC - PubMed
    1. Blake WJ, Balázsi G, Kohanski MA, Isaacs FJ, Murphy KF, Kuang Y, Cantor CR, Walt DR, Collins JJ. Phenotypic consequences of promoter-mediated transcriptional noise. Molecular Cell. 2006;24:853–865. doi: 10.1016/j.molcel.2006.11.003. - DOI - PubMed

Publication types