Review
. 2015 Sep;276(3):637-53.
doi: 10.1148/radiol.2015142631.

Dual- and Multi-Energy CT: Principles, Technical Approaches, and Clinical Applications

Affiliations
Review

Dual- and Multi-Energy CT: Principles, Technical Approaches, and Clinical Applications

Cynthia H McCollough et al. Radiology. 2015 Sep.

Abstract

In x-ray computed tomography (CT), materials having different elemental compositions can be represented by identical pixel values on a CT image (ie, CT numbers), depending on the mass density of the material. Thus, the differentiation and classification of different tissue types and contrast agents can be extremely challenging. In dual-energy CT, an additional attenuation measurement is obtained with a second x-ray spectrum (ie, a second "energy"), allowing the differentiation of multiple materials. Alternatively, this allows quantification of the mass density of two or three materials in a mixture with known elemental composition. Recent advances in the use of energy-resolving, photon-counting detectors for CT imaging suggest the ability to acquire data in multiple energy bins, which is expected to further improve the signal-to-noise ratio for material-specific imaging. In this review, the underlying motivation and physical principles of dual- or multi-energy CT are reviewed and each of the current technical approaches is described. In addition, current and evolving clinical applications are introduced.


Figures

Figure 1:
Figure 1:
Graph of linear attenuation coefficients for bone (assuming ρ = 1 g/cm3), iodine (assuming ρ = 1 g/cm3), and iodine with lower density (assuming ρ = 0.1 g/cm3) as a function of energy (in kiloelectron volts). The plotted linear attenuation coefficients (in reciprocal centimeters) were generated by using the energy-dependent mass attenuation coefficients from the National Institute of Standards, which were multiplied by the assigned density values. The result is that the same linear attenuation value (μ[E]) can be attained although the materials (iodine and bone) are different (arrow). Measuring attenuation at a second energy allows the two materials to be differentiated (arrowhead).
Figure 2a:
Figure 2a:
Slow kilovoltage (kV) switching: (a) Consecutive scans of the entire scan volume are obtained by using back-to-back scans at low and high tube potentials. Scans can be acquired in axial or spiral modes. The interscan delay is relatively long (several seconds) and is composed of the time to scan the complete volume of interest, as well as the time to reposition the table to the beginning of the scan volume. (b) Consecutive scans of one anatomic section are obtained with decreased interscan delay by switching the tube potential between axial scans at each anatomic section level. The interscan delay is reduced to one rotation time plus the small delay to switch tube potential and increment the table.
Figure 2b:
Figure 2b:
Slow kilovoltage (kV) switching: (a) Consecutive scans of the entire scan volume are obtained by using back-to-back scans at low and high tube potentials. Scans can be acquired in axial or spiral modes. The interscan delay is relatively long (several seconds) and is composed of the time to scan the complete volume of interest, as well as the time to reposition the table to the beginning of the scan volume. (b) Consecutive scans of one anatomic section are obtained with decreased interscan delay by switching the tube potential between axial scans at each anatomic section level. The interscan delay is reduced to one rotation time plus the small delay to switch tube potential and increment the table.
Figure 3:
Figure 3:
Fast kilovoltage (kV) switching: The x-ray tube potential is switched between successive views in either axial or spiral mode. Dual-energy processing can be performed by using projection or image data, and the temporal resolution of each image and the entire examination remains essentially unchanged. For successful technical implementation and to maintain current levels of image quality and temporal resolution, very fast detector materials and electronics are needed. Additionally, the x-ray generator must be capable of very rapid transitions between the low and high tube potentials.
Figure 4:
Figure 4:
A single x-ray source and single tube potential value are used in combination with a dual-layer scintillating detector. kV = kilovoltage.
Figure 5:
Figure 5:
In a dual-layer detector, low-energy quanta are predominantly collected in the front layer. X-rays capable of passing through the front layer are predominantly of higher energy and are collected in the back detector layer. keV = kiloelectron volt.
Figure 6:
Figure 6:
Dual-x-ray-source geometry: Independent x-ray tubes, detectors, and generators allow simultaneous collection of dual-energy data. Each tube can be operated by using the optimal tube current setting and with optimum spectral filtration. Due to the 90° offset between the low- and high-energy views, dual-energy processing is implemented by using already reconstructed image data. Both axial and spiral acquisition modes are possible, and the temporal resolution remains unchanged. Scatter originating from one tube can be detected by the orthogonal detector, which can reduce spectral separation. The field of view over which dual energy data are acquired is currently limited to 26, 33 or 35 cm, depending on the specific scanner model. kV = kilovoltage.
Figure 7:
Figure 7:
Schematic diagram of a photon-counting (energy-resolving) x-ray detector and signal-processing components. The semiconductor detector (eg, CdTe) directly converts the absorbed x-ray energy into electrical charge, which is accelerated across a potential difference and collected by discreet signal electrodes. Unlike current scintillating CT detectors, there are no septa within the semiconductor material; this maximizes geometric efficiency. The signal collected is proportional to the absorbed photon energy, and pulse height analysis is used to bin the signal from discreet photon interactions into two or more energy windows, depending on the capability of the application-specific integrated circuit coupled to the semiconductor detector. keV = kiloelectron-voltage.
Figure 8:
Figure 8:
Illustration of the binning of detected x-rays into six energy windows (w1–w6). This illustration neglects nonideal properties such as pulse pile-up, which occurs when the count rate is too high, and charge sharing or K-escape phenomena, which occur when the discrete spacing of the signal electrodes is too small. To achieve both an accurate photon count and spectral measurement in CT, both hardware and software advances are necessary. keV = kiloelectron volt.
Figure 9:
Figure 9:
The CT numbers of three known materials in the low- and high-energy images can be plotted on the y- and x-axis, respectively. Unknown materials are then mapped onto this plot to determine the percent composition of each of the three basis materials.
Figure 10:
Figure 10:
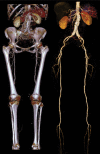
Coronal CT angiogram in a 62-year-old woman. With dual-energy techniques, bone anatomy can be automatically separated from the vascular anatomy and highly enhancing kidneys.
Figure 11:
Figure 11:
Contrast-enhanced, dual-energy axial CT image in a 31-year-old man with a pulmonary embolism in the right lower lobe. Iodine signal is identified and color coded in red within the segmented lung. The iodine overlay image is superimposed on a gray-scale mixed image. The dark regions show a perfusion defect secondary to the embolism. Blue circle marks the diameter of the second tube on the dual-source CT scanner. Dual-energy data are acquired only within this circle.
Figure 12a:
Figure 12a:
Axial contrast-enhanced, dual-energy scan in a 67-year-old man. (a, b) Mixed images show subcapsular hematoma of the liver (*) and two similar-appearing low-attenuation liver lesions (arrow). (c, d) Iodine overlay images demonstrate iodine within one lesion (c), indicating it is a metastasis (arrow), while the other image (d) contains no iodine, indicating it is a hematoma (arrow) associated with prior wedge resection.
Figure 12b:
Figure 12b:
Axial contrast-enhanced, dual-energy scan in a 67-year-old man. (a, b) Mixed images show subcapsular hematoma of the liver (*) and two similar-appearing low-attenuation liver lesions (arrow). (c, d) Iodine overlay images demonstrate iodine within one lesion (c), indicating it is a metastasis (arrow), while the other image (d) contains no iodine, indicating it is a hematoma (arrow) associated with prior wedge resection.
Figure 12c:
Figure 12c:
Axial contrast-enhanced, dual-energy scan in a 67-year-old man. (a, b) Mixed images show subcapsular hematoma of the liver (*) and two similar-appearing low-attenuation liver lesions (arrow). (c, d) Iodine overlay images demonstrate iodine within one lesion (c), indicating it is a metastasis (arrow), while the other image (d) contains no iodine, indicating it is a hematoma (arrow) associated with prior wedge resection.
Figure 12d:
Figure 12d:
Axial contrast-enhanced, dual-energy scan in a 67-year-old man. (a, b) Mixed images show subcapsular hematoma of the liver (*) and two similar-appearing low-attenuation liver lesions (arrow). (c, d) Iodine overlay images demonstrate iodine within one lesion (c), indicating it is a metastasis (arrow), while the other image (d) contains no iodine, indicating it is a hematoma (arrow) associated with prior wedge resection.
Figure 13a:
Figure 13a:
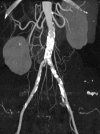
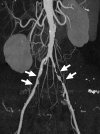
Coronal maximum intensity projection images from CT angiographic study of the aortic bifurcation in a 70-year-old man. (a) Calcified plaque obscures the vessel lumen. (b) By using dual-energy material decomposition, the calcified plaque is identified and subtracted, giving a clear indication of vessel patency and areas of stenoses (arrows).
Figure 13b:
Figure 13b:
Coronal maximum intensity projection images from CT angiographic study of the aortic bifurcation in a 70-year-old man. (a) Calcified plaque obscures the vessel lumen. (b) By using dual-energy material decomposition, the calcified plaque is identified and subtracted, giving a clear indication of vessel patency and areas of stenoses (arrows).
Figure 14a:
Figure 14a:
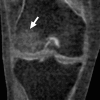
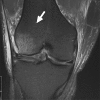
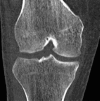
Dual-energy CT virtual noncalcium images acquired 11 days after injury demonstrate bone bruises in the lateral femoral condyle of a 29-year-old male soccer player. (a) Coronal and (d) axial views of the virtual noncalcium images demonstrate increased signal intensity due to edema subsequent to a knee injury (ie, bone bruises, arrow). (b, e) Corresponding T2-weighted MR images show high signal intensity in the same region (arrow). (c) Coronal and (f) axial views of the mixed images, where calcium signal has not been removed, show no evidence of bone injury.
Figure 14b:
Figure 14b:
Dual-energy CT virtual noncalcium images acquired 11 days after injury demonstrate bone bruises in the lateral femoral condyle of a 29-year-old male soccer player. (a) Coronal and (d) axial views of the virtual noncalcium images demonstrate increased signal intensity due to edema subsequent to a knee injury (ie, bone bruises, arrow). (b, e) Corresponding T2-weighted MR images show high signal intensity in the same region (arrow). (c) Coronal and (f) axial views of the mixed images, where calcium signal has not been removed, show no evidence of bone injury.
Figure 14c:
Figure 14c:
Dual-energy CT virtual noncalcium images acquired 11 days after injury demonstrate bone bruises in the lateral femoral condyle of a 29-year-old male soccer player. (a) Coronal and (d) axial views of the virtual noncalcium images demonstrate increased signal intensity due to edema subsequent to a knee injury (ie, bone bruises, arrow). (b, e) Corresponding T2-weighted MR images show high signal intensity in the same region (arrow). (c) Coronal and (f) axial views of the mixed images, where calcium signal has not been removed, show no evidence of bone injury.
Figure 14d:
Figure 14d:
Dual-energy CT virtual noncalcium images acquired 11 days after injury demonstrate bone bruises in the lateral femoral condyle of a 29-year-old male soccer player. (a) Coronal and (d) axial views of the virtual noncalcium images demonstrate increased signal intensity due to edema subsequent to a knee injury (ie, bone bruises, arrow). (b, e) Corresponding T2-weighted MR images show high signal intensity in the same region (arrow). (c) Coronal and (f) axial views of the mixed images, where calcium signal has not been removed, show no evidence of bone injury.
Figure 14e:
Figure 14e:
Dual-energy CT virtual noncalcium images acquired 11 days after injury demonstrate bone bruises in the lateral femoral condyle of a 29-year-old male soccer player. (a) Coronal and (d) axial views of the virtual noncalcium images demonstrate increased signal intensity due to edema subsequent to a knee injury (ie, bone bruises, arrow). (b, e) Corresponding T2-weighted MR images show high signal intensity in the same region (arrow). (c) Coronal and (f) axial views of the mixed images, where calcium signal has not been removed, show no evidence of bone injury.
Figure 14f:
Figure 14f:
Dual-energy CT virtual noncalcium images acquired 11 days after injury demonstrate bone bruises in the lateral femoral condyle of a 29-year-old male soccer player. (a) Coronal and (d) axial views of the virtual noncalcium images demonstrate increased signal intensity due to edema subsequent to a knee injury (ie, bone bruises, arrow). (b, e) Corresponding T2-weighted MR images show high signal intensity in the same region (arrow). (c) Coronal and (f) axial views of the mixed images, where calcium signal has not been removed, show no evidence of bone injury.
Figure 15a:
Figure 15a:
Axial images in (a) 20-year-old man and (b) 32-year-old man. A commercially available software application can be used to discriminate between uric acid and non–uric acid renal stones.
Figure 15b:
Figure 15b:
Axial images in (a) 20-year-old man and (b) 32-year-old man. A commercially available software application can be used to discriminate between uric acid and non–uric acid renal stones.
Figure 16a:
Figure 16a:
Axial CT images. By using custom software that takes advantage of the increased in-spectral separation provided by a tin filter on the high-energy beam of a dual-source CT system, uric acid stones (red) can be distinguished from three groups of non–uric acid stones: cystine (yellow), calcium oxalate/brushite/struvite (green), and apatite (blue). (a) Uric acid stone in a 71-year-old man. (b) Cystine stone in a 63-year-old man. (c) Calcium oxalate stone in a 21-year-old woman. (d) Apatite stone in a 34-year-old woman.
Figure 16b:
Figure 16b:
Axial CT images. By using custom software that takes advantage of the increased in-spectral separation provided by a tin filter on the high-energy beam of a dual-source CT system, uric acid stones (red) can be distinguished from three groups of non–uric acid stones: cystine (yellow), calcium oxalate/brushite/struvite (green), and apatite (blue). (a) Uric acid stone in a 71-year-old man. (b) Cystine stone in a 63-year-old man. (c) Calcium oxalate stone in a 21-year-old woman. (d) Apatite stone in a 34-year-old woman.
Figure 16c:
Figure 16c:
Axial CT images. By using custom software that takes advantage of the increased in-spectral separation provided by a tin filter on the high-energy beam of a dual-source CT system, uric acid stones (red) can be distinguished from three groups of non–uric acid stones: cystine (yellow), calcium oxalate/brushite/struvite (green), and apatite (blue). (a) Uric acid stone in a 71-year-old man. (b) Cystine stone in a 63-year-old man. (c) Calcium oxalate stone in a 21-year-old woman. (d) Apatite stone in a 34-year-old woman.
Figure 16d:
Figure 16d:
Axial CT images. By using custom software that takes advantage of the increased in-spectral separation provided by a tin filter on the high-energy beam of a dual-source CT system, uric acid stones (red) can be distinguished from three groups of non–uric acid stones: cystine (yellow), calcium oxalate/brushite/struvite (green), and apatite (blue). (a) Uric acid stone in a 71-year-old man. (b) Cystine stone in a 63-year-old man. (c) Calcium oxalate stone in a 21-year-old woman. (d) Apatite stone in a 34-year-old woman.
Figure 17a:
Figure 17a:
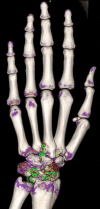
Three-dimensional volume-rendered CT images of (a) gout (green) in a 56-year-old man and (b) calcium pyrophosphate crystals (purple) in the triangular fibrocartilage (arrow) in a 78-year-old woman, where composition of intra- and peri-articular crystals was automatically determined by using dual-energy CT.
Figure 17b:
Figure 17b:
Three-dimensional volume-rendered CT images of (a) gout (green) in a 56-year-old man and (b) calcium pyrophosphate crystals (purple) in the triangular fibrocartilage (arrow) in a 78-year-old woman, where composition of intra- and peri-articular crystals was automatically determined by using dual-energy CT.
Figure 18a:
Figure 18a:
Evaluation of the integrity of silicone breast implants by using unenhanced dual-energy CT in a 65-year-old woman with silicone implants placed in the right breast in 1976 and replaced in the left breast in 1989. (a, b) Axial and (c, d) coronal views demonstrate that silicone and soft tissue have very similar CT numbers in the mixed images (a, c), making it potentially difficult to differentiate a small extracapsular silicone leak from fibroglandular breast tissue. In the material-specific images (b, d), silicone is color coded in red, making it easy to differentiate silicone from soft tissue. Dense or high-atomic-number materials also take on a red tint (eg, cartilage and ribs) in the color-coded image.
Figure 18b:
Figure 18b:
Evaluation of the integrity of silicone breast implants by using unenhanced dual-energy CT in a 65-year-old woman with silicone implants placed in the right breast in 1976 and replaced in the left breast in 1989. (a, b) Axial and (c, d) coronal views demonstrate that silicone and soft tissue have very similar CT numbers in the mixed images (a, c), making it potentially difficult to differentiate a small extracapsular silicone leak from fibroglandular breast tissue. In the material-specific images (b, d), silicone is color coded in red, making it easy to differentiate silicone from soft tissue. Dense or high-atomic-number materials also take on a red tint (eg, cartilage and ribs) in the color-coded image.
Figure 18c:
Figure 18c:
Evaluation of the integrity of silicone breast implants by using unenhanced dual-energy CT in a 65-year-old woman with silicone implants placed in the right breast in 1976 and replaced in the left breast in 1989. (a, b) Axial and (c, d) coronal views demonstrate that silicone and soft tissue have very similar CT numbers in the mixed images (a, c), making it potentially difficult to differentiate a small extracapsular silicone leak from fibroglandular breast tissue. In the material-specific images (b, d), silicone is color coded in red, making it easy to differentiate silicone from soft tissue. Dense or high-atomic-number materials also take on a red tint (eg, cartilage and ribs) in the color-coded image.
Figure 18d:
Figure 18d:
Evaluation of the integrity of silicone breast implants by using unenhanced dual-energy CT in a 65-year-old woman with silicone implants placed in the right breast in 1976 and replaced in the left breast in 1989. (a, b) Axial and (c, d) coronal views demonstrate that silicone and soft tissue have very similar CT numbers in the mixed images (a, c), making it potentially difficult to differentiate a small extracapsular silicone leak from fibroglandular breast tissue. In the material-specific images (b, d), silicone is color coded in red, making it easy to differentiate silicone from soft tissue. Dense or high-atomic-number materials also take on a red tint (eg, cartilage and ribs) in the color-coded image.

References

    1. Hounsfield GN. Computerized transverse axial scanning (tomography). I. Description of system. Br J Radiol 1973;46(552):1016–1022. - PubMed
    1. Alvarez RE, Macovski A. Energy-selective reconstructions in x-ray computerized tomography. Phys Med Biol 1976;21(5):733–744. - PubMed
    1. Macovski A, Alvarez RE, Chan JL, Stonestrom JP, Zatz LM. Energy dependent reconstruction in x-ray computerized tomography. Comput Biol Med 1976;6(4):325–336. - PubMed
    1. Kalender WA, Klotz E, Suess C. Vertebral bone mineral analysis: an integrated approach with CT. Radiology 1987;164(2):419–423. - PubMed
    1. Kalender WA, Perman WH, Vetter JR, Klotz E. Evaluation of a prototype dual-energy computed tomographic apparatus. I. Phantom studies. Med Phys 1986;13(3):334–339. - PubMed

Publication types

MeSH terms