Genome-wide identification, phylogeny and expression analysis of GRAS gene family in tomato
- PMID: 26302743
- PMCID: PMC4549011
- DOI: 10.1186/s12870-015-0590-6
Genome-wide identification, phylogeny and expression analysis of GRAS gene family in tomato
Abstract
Background: GRAS transcription factors usually act as integrators of multiple growth regulatory and environmental signals, including axillary shoot meristem formation, root radial pattering, phytohormones, light signaling, and abiotic/biotic stress. However, little is known about this gene family in tomato (Solanum lycopersicum), the most important model plant for crop species with fleshy fruits.
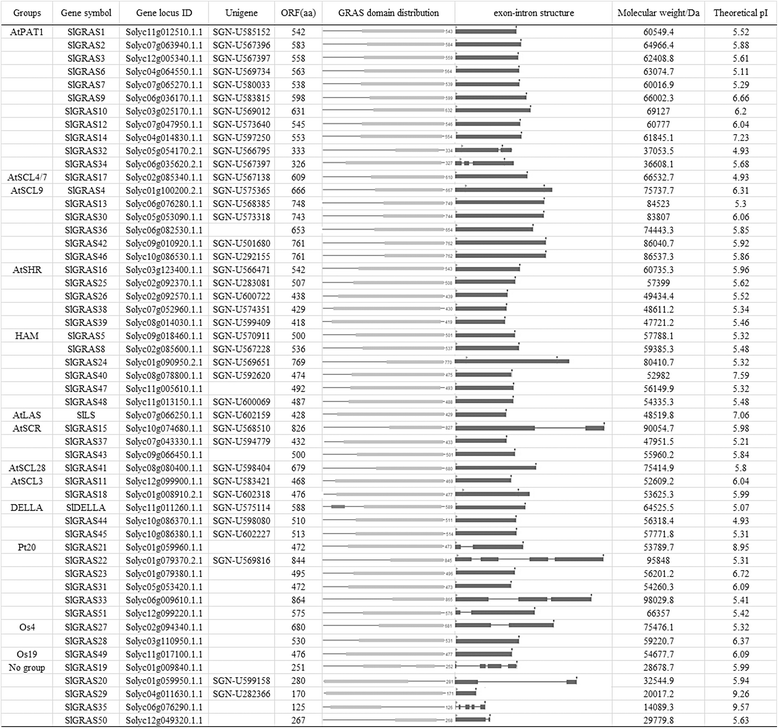
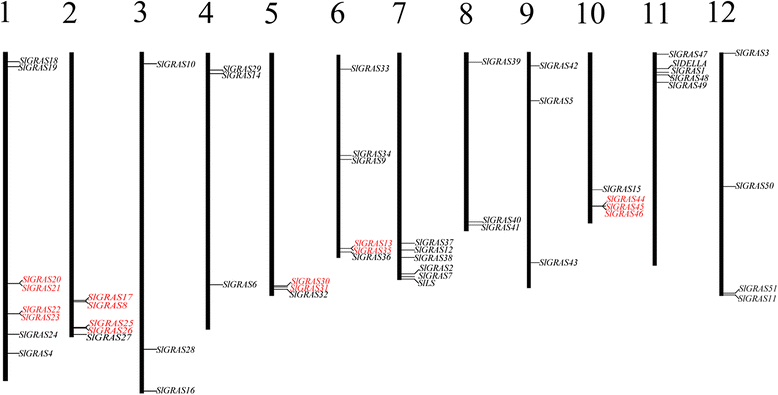
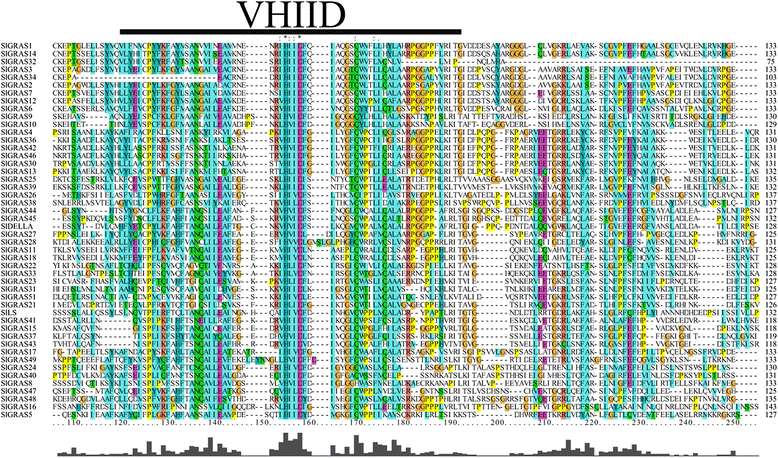
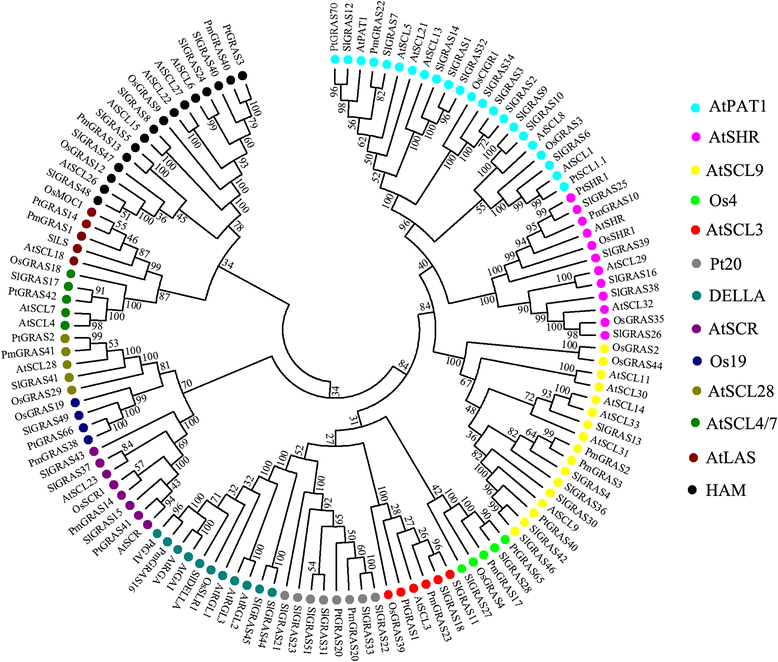
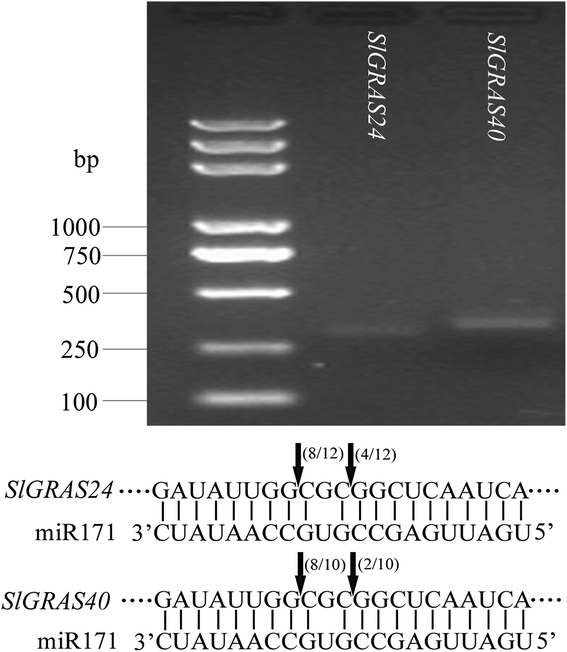
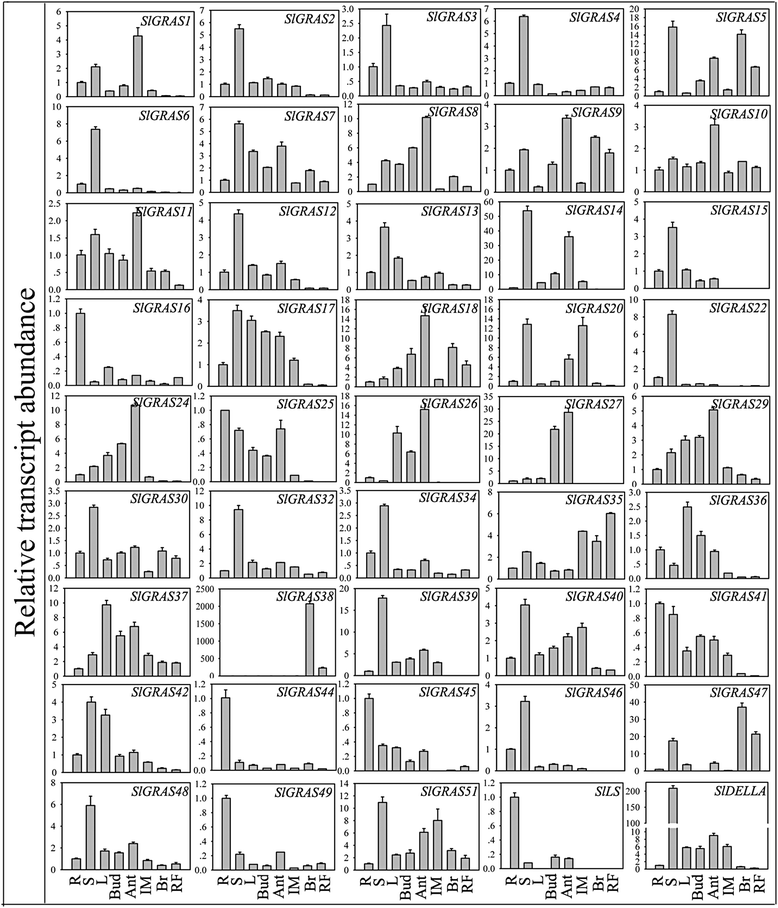
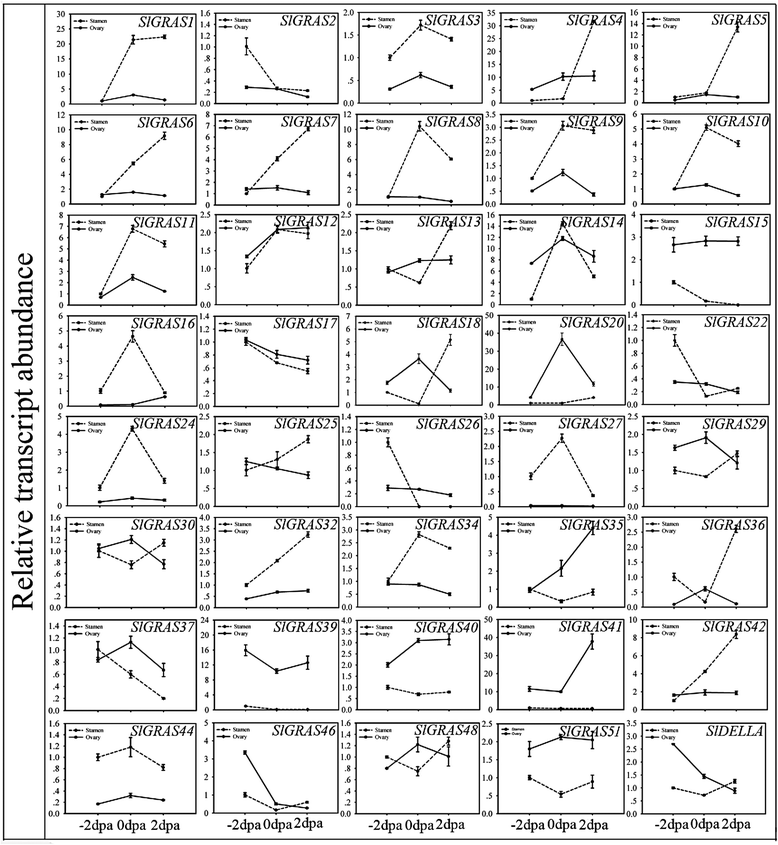
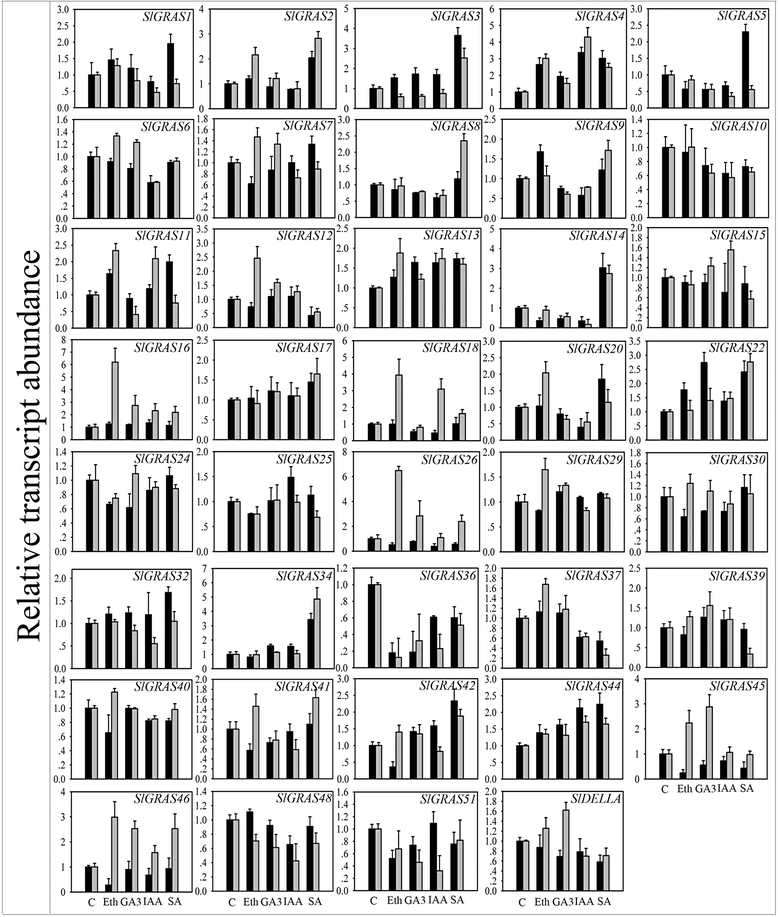
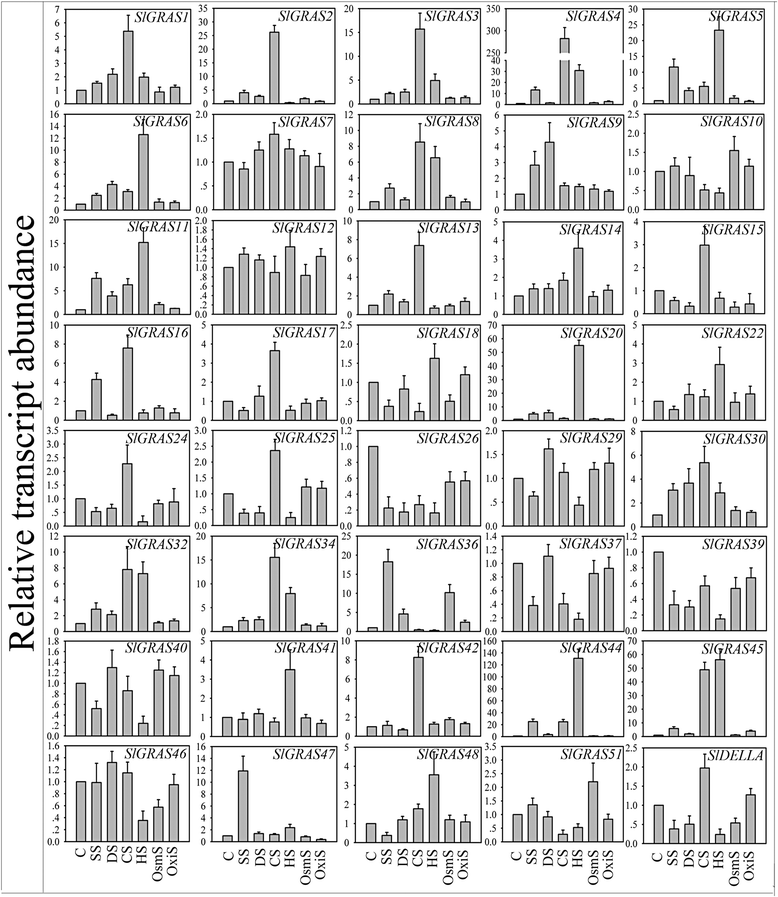
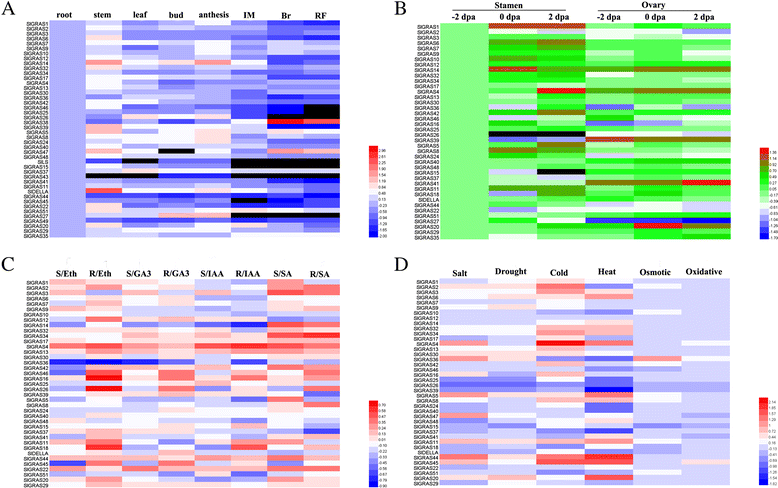
Results: In this study, 53 GRAS genes were identified and renamed based on tomato whole-genome sequence and their respective chromosome distribution except 19 members were kept as their already existed name. Multiple sequence alignment showed typical GRAS domain in these proteins. Phylogenetic analysis of GRAS proteins from tomato, Arabidopsis, Populus, P.mume, and Rice revealed that SlGRAS proteins could be divided into at least 13 subfamilies. SlGRAS24 and SlGRAS40 were identified as target genes of miR171 using5'-RACE (Rapid amplification of cDNA ends). qRT-PCR analysis revealed tissue-/organ- and development stage-specific expression patterns of SlGRAS genes. Moreover, their expression patterns in response to different hormone and abiotic stress treatments were also investigated.
Conclusions: This study provides the first comprehensive analysis of GRAS gene family in the tomato genome. The data will undoubtedly be useful for better understanding the potential functions of GRAS genes, and their possible roles in mediating hormone cross-talk and abiotic stress in tomato as well as in some other relative species.
Figures
Similar articles
-
Identification, cloning and characterization of the tomato TCP transcription factor family.BMC Plant Biol. 2014 Jun 6;14:157. doi: 10.1186/1471-2229-14-157. BMC Plant Biol. 2014. PMID: 24903607 Free PMC article.
-
Genome-wide analysis of the GRAS gene family in Prunus mume.Mol Genet Genomics. 2015 Feb;290(1):303-17. doi: 10.1007/s00438-014-0918-1. Epub 2014 Sep 23. Mol Genet Genomics. 2015. PMID: 25245166
-
Genome-wide systematic characterization of the bZIP transcriptional factor family in tomato (Solanum lycopersicum L.).BMC Genomics. 2015 Oct 12;16:771. doi: 10.1186/s12864-015-1990-6. BMC Genomics. 2015. PMID: 26459863 Free PMC article.
-
Genome-Wide Identification of the WD40 Gene Family in Tomato (Solanum lycopersicum L.).Genes (Basel). 2023 Jun 15;14(6):1273. doi: 10.3390/genes14061273. Genes (Basel). 2023. PMID: 37372453 Free PMC article. Review.
-
Genetic control of branching in Arabidopsis and tomato.Curr Opin Plant Biol. 1999 Feb;2(1):51-5. doi: 10.1016/s1369-5266(99)80010-7. Curr Opin Plant Biol. 1999. PMID: 10047573 Review.
Cited by
-
Genome-Wide Identification, Evolutionary Analysis, and Stress Responses of the GRAS Gene Family in Castor Beans.Int J Mol Sci. 2016 Jun 24;17(7):1004. doi: 10.3390/ijms17071004. Int J Mol Sci. 2016. PMID: 27347937 Free PMC article.
-
Genome-Wide Characterization and Expression Profiling of the GRAS Gene Family in Salt and Alkali Stresses in Miscanthus sinensis.Int J Mol Sci. 2022 Nov 22;23(23):14521. doi: 10.3390/ijms232314521. Int J Mol Sci. 2022. PMID: 36498850 Free PMC article.
-
Genome-wide identification and expression analysis of the GRAS gene family under abiotic stresses in wheat (Triticum aestivum L.).Sci Rep. 2023 Oct 31;13(1):18705. doi: 10.1038/s41598-023-45051-0. Sci Rep. 2023. PMID: 37907517 Free PMC article.
-
Genome-wide characterization and expression analysis of GRAS gene family in pepper (Capsicum annuum L.).PeerJ. 2018 May 29;6:e4796. doi: 10.7717/peerj.4796. eCollection 2018. PeerJ. 2018. PMID: 29868257 Free PMC article.
-
Genome-wide analysis of the GRAS gene family in Liriodendron chinense reveals the putative function in abiotic stress and plant development.Front Plant Sci. 2023 Sep 21;14:1211853. doi: 10.3389/fpls.2023.1211853. eCollection 2023. Front Plant Sci. 2023. PMID: 37810392 Free PMC article.
References
Publication types
MeSH terms
Substances
LinkOut - more resources
Full Text Sources
Other Literature Sources

