. 2016 Sep;21(9):1188-93.
doi: 10.1038/mp.2015.126. Epub 2015 Aug 25.

Phenome-wide analysis of genome-wide polygenic scores

Affiliations

Phenome-wide analysis of genome-wide polygenic scores

E Krapohl et al. Mol Psychiatry. 2016 Sep.

Abstract

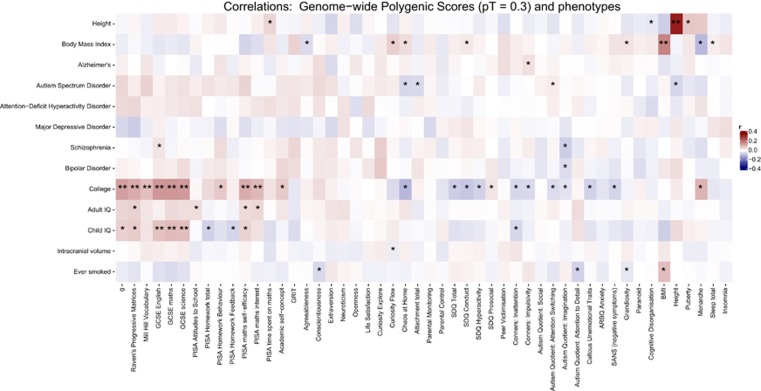
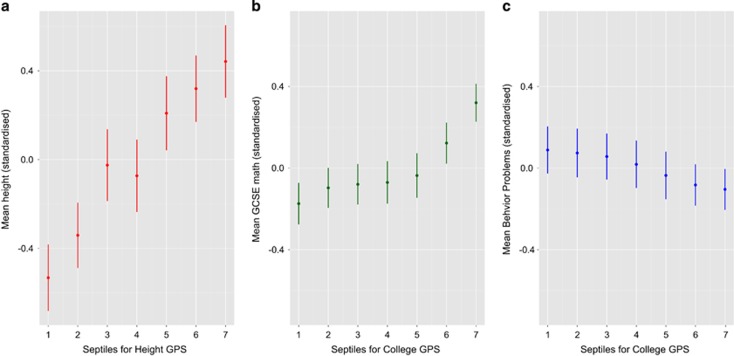
Genome-wide polygenic scores (GPS), which aggregate the effects of thousands of DNA variants from genome-wide association studies (GWAS), have the potential to make genetic predictions for individuals. We conducted a systematic investigation of associations between GPS and many behavioral traits, the behavioral phenome. For 3152 unrelated 16-year-old individuals representative of the United Kingdom, we created 13 GPS from the largest GWAS for psychiatric disorders (for example, schizophrenia, depression and dementia) and cognitive traits (for example, intelligence, educational attainment and intracranial volume). The behavioral phenome included 50 traits from the domains of psychopathology, personality, cognitive abilities and educational achievement. We examined phenome-wide profiles of associations for the entire distribution of each GPS and for the extremes of the GPS distributions. The cognitive GPS yielded stronger predictive power than the psychiatric GPS in our UK-representative sample of adolescents. For example, education GPS explained variation in adolescents' behavior problems (~0.6%) and in educational achievement (~2%) but psychiatric GPS were associated with neither. Despite the modest effect sizes of current GPS, quantile analyses illustrate the ability to stratify individuals by GPS and opportunities for research. For example, the highest and lowest septiles for the education GPS yielded a 0.5 s.d. difference in mean math grade and a 0.25 s.d. difference in mean behavior problems. We discuss the usefulness and limitations of GPS based on adult GWAS to predict genetic propensities earlier in development.


Conflict of interest statement

The authors declare no conflict of interest.

Figures

Figure 1
Figure 1
Correlations between 13 genome-wide polygenic scores and 50 traits from the behavioral phenome. These results are based on GPS constructed using a GWAS P-value threshold (PT)=0.30; results for PT =0.10 and 0.05 (Supplementary Figures 1a and b and Supplementary Table 3). P-values that pass Nyholt–Sidak correction (see Supplementary Methods 1) are indicated with two asterisks, whereas those reaching nominal significance (thus suggestive evidence) are shown with a single asterisk.
Figure 2
Figure 2
(a) Mean for height at age 16 by adult Height genome-wide polygenic score (GPS) septile. The threshold for selecting trait-associated alleles was PT < 0.30. The GPS were converted to quantiles (1=lowest, 7=highest GPS). Mean phenotypic values and 95% confidence intervals (CIs) for the quantile groups (bars) were estimated using general linear regression with ancestrally informative principal components, sex and age of measurement as covariates. (b) Mean for children's mathematics educational achievement at age 16 (compulsory subject on the General Certificate of Secondary Examination (GCSE), see Materials and Methods for details) by College GPS septile. The threshold for selecting trait-associated alleles was PT < 0.30. The GPS were converted to quantiles (1=lowest, 7=highest GPS). Mean phenotypic values and 95% CI for the quantile groups (bars) were estimated using general linear regression with ancestrally informative principal components, sex and age of measurement as covariates. (c) Mean for total parent-reported behavior problems at age 16 by adult College GPS septile. The threshold for selecting trait-associated alleles was PT < 0.30 (the best-fit GPS as estimated by PRSice software, see Materials and Methods). The GPS were converted to quantiles (1=lowest, 7=highest GPS). Mean phenotypic values and 95% CI for the quantile groups (bars) were estimated using general linear regression with ancestrally informative principal components, sex and age of measurement as covariates.

References

    1. Gratten J, Wray NR, Keller MC, Visscher PM. Large-scale genomics unveils the genetic architecture of psychiatric disorders. Nat Neurosci 2014; 17: 782–790. - PMC - PubMed
    1. Wray NR, Lee SH, Mehta D, Vinkhuyzen AAE, Dudbridge F, Middeldorp CM. Research review: polygenic methods and their application to psychiatric traits. J Child Psychol Psychiatry 2014; 55: 1068–1087. - PubMed
    1. Visscher PM, Brown MA, McCarthy MI, Yang J. Five years of GWAS discovery. Am J Hum Genet 2012; 90: 7–24. - PMC - PubMed
    1. Robinson MR, Wray NR, Visscher PM. Explaining additional genetic variation in complex traits. Trends Genet 2014; 30: 124–132. - PMC - PubMed
    1. Dudbridge F. Power and predictive accuracy of polygenic risk scores. PLoS Genet 2013; 9: e1003348. - PMC - PubMed

Publication types