

Japanese population norms for preference-based measures: EQ-5D-3L, EQ-5D-5L, and SF-6D
- PMID: 26303761
- PMCID: PMC4759213
- DOI: 10.1007/s11136-015-1108-2
Japanese population norms for preference-based measures: EQ-5D-3L, EQ-5D-5L, and SF-6D
Abstract
Purpose: The purpose of this study was to measure the population norms for the Japanese versions of preference-based measures (EQ-5D-3L, EQ-5D-5L, and SF-6D). We also considered the relations between QOL score in the general population and socio-demographic factors.
Methods: A total of 1143 adult respondents (aged ≥ 20 years) were randomly sampled from across Japan using data from the Basic Resident Register. The health status of each respondent was measured using the EQ-5D-3L, EQ-5D-5L, and SF-6D, and responses regarding socio-demographic data as well as subjective diseases and symptoms were obtained. The responses were converted to a QOL score using Japanese value sets.
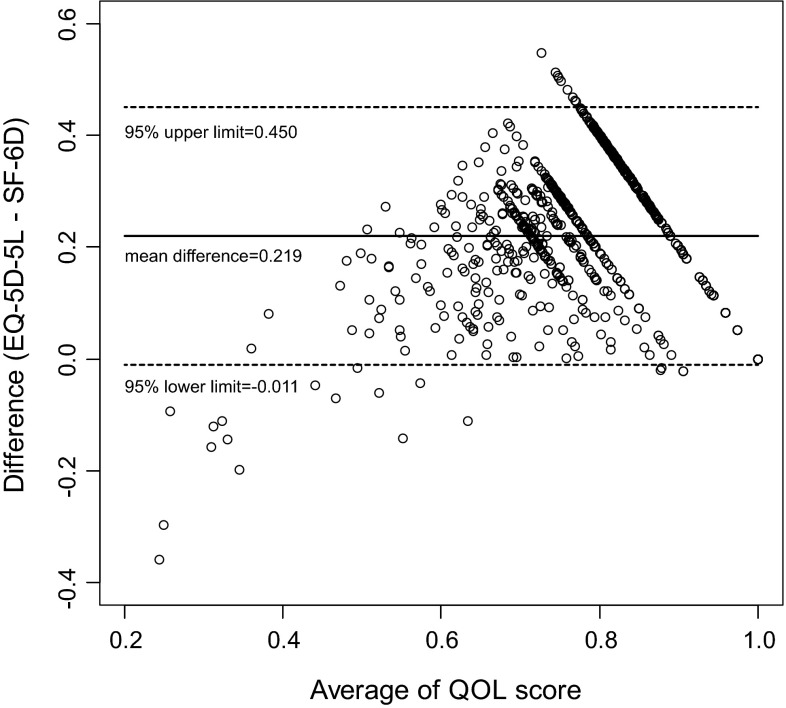
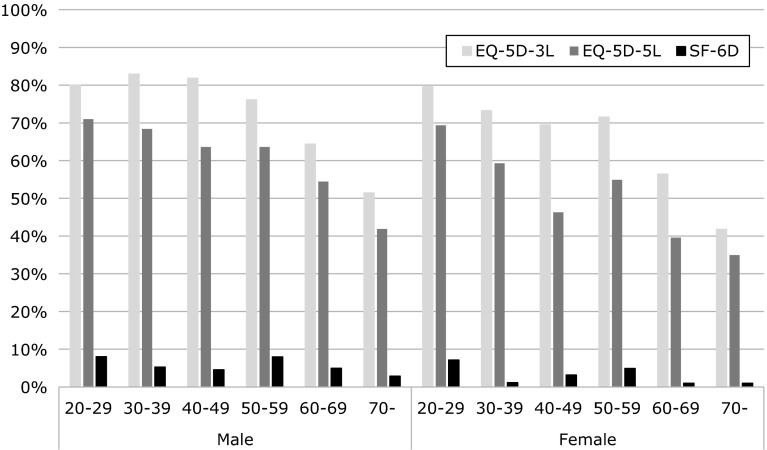
Results: The percentages of respondents with full health scores were 68 % (EQ-5D-3L), 55 % (EQ-5D-5L), and 4 % (SF-6D). The QOL score measured using the SF-6D was significantly lower than those measured using either EQ-5D score. The QOL score was significantly lower among respondents over the age of 60 years, those who had a lower income, and those who had a shorter period of education. Intraclass correlation coefficient showed a poor agreement between the EQ-5D and SF-6D scores. The differences in QOL scores between respondents with and those without any disease were 0.064 for the EQ-5D-3L, 0.061 for the EQ-5D-5L, and 0.073 for the SF-6D; these differences are regarded as between-group minimal important differences in the general population.
Conclusion: The Japanese population norms of three preference-based QOL measures were examined for the first time. Such information is useful for economic evaluations and research examining QOL score.
Keywords: EQ-5D; Health-related quality of life; Japan; Population norms; QALY; SF-6D.
Figures
References
Publication types
MeSH terms
LinkOut - more resources
Full Text Sources
Other Literature Sources
