. 2015 Aug 25:5:13450.
doi: 10.1038/srep13450.

UCP-3 uncoupling protein confers hypoxia resistance to renal epithelial cells and is upregulated in renal cell carcinoma

Affiliations

UCP-3 uncoupling protein confers hypoxia resistance to renal epithelial cells and is upregulated in renal cell carcinoma

Norbert Braun et al. Sci Rep. .

Abstract

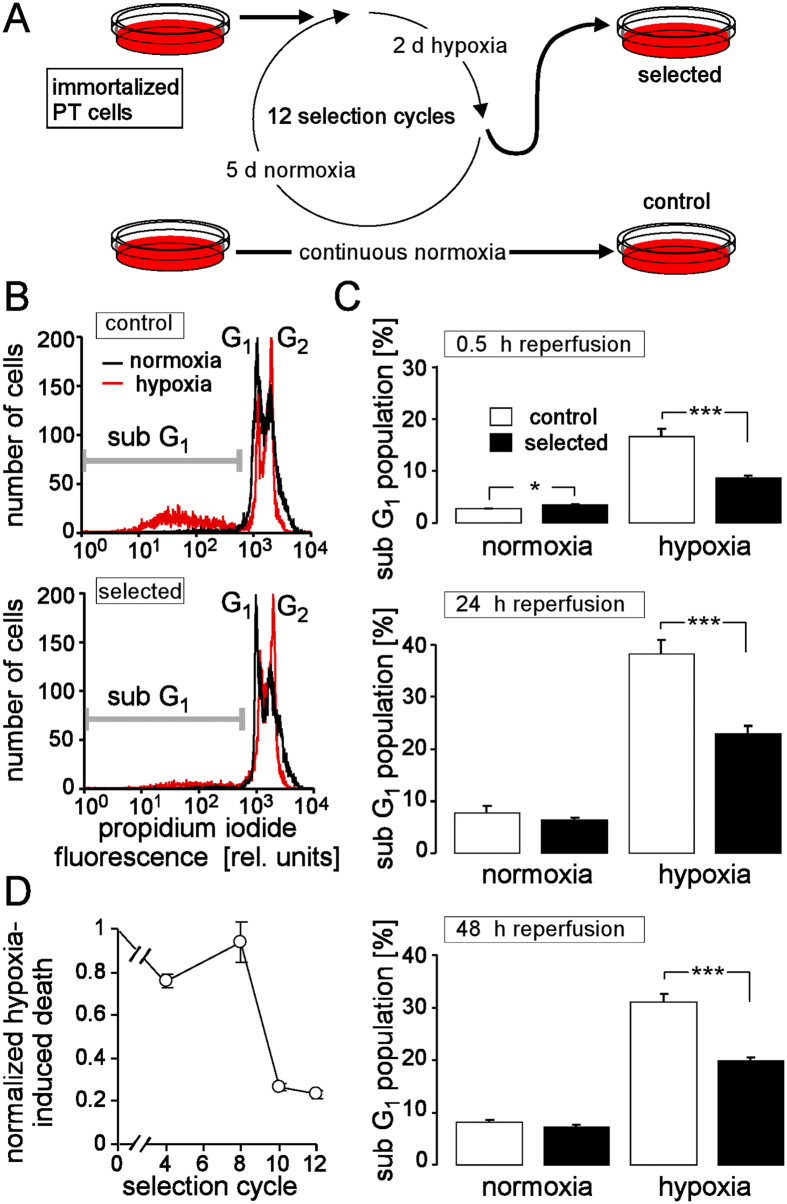
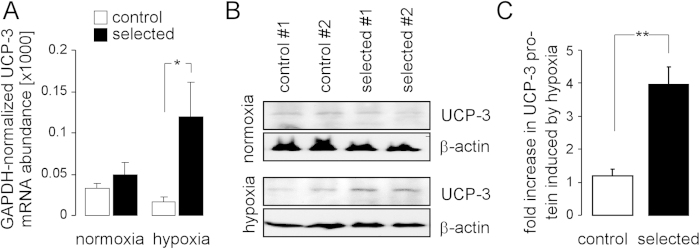
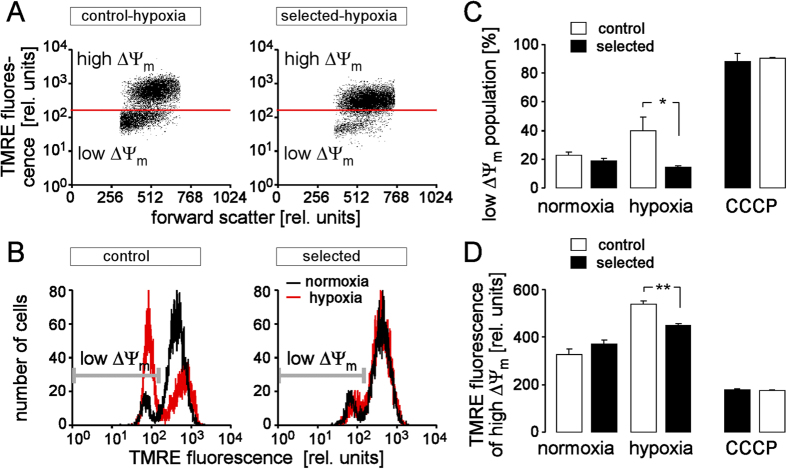
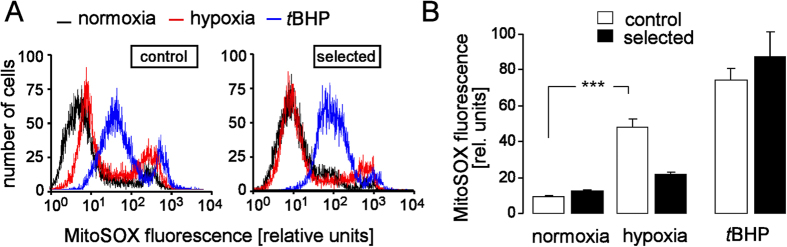
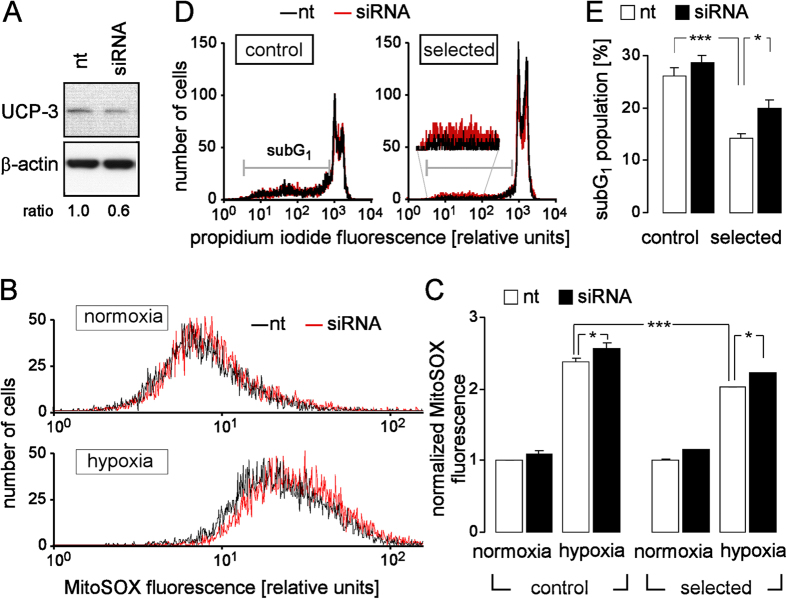
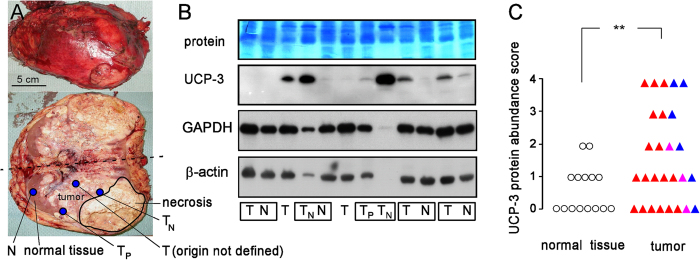
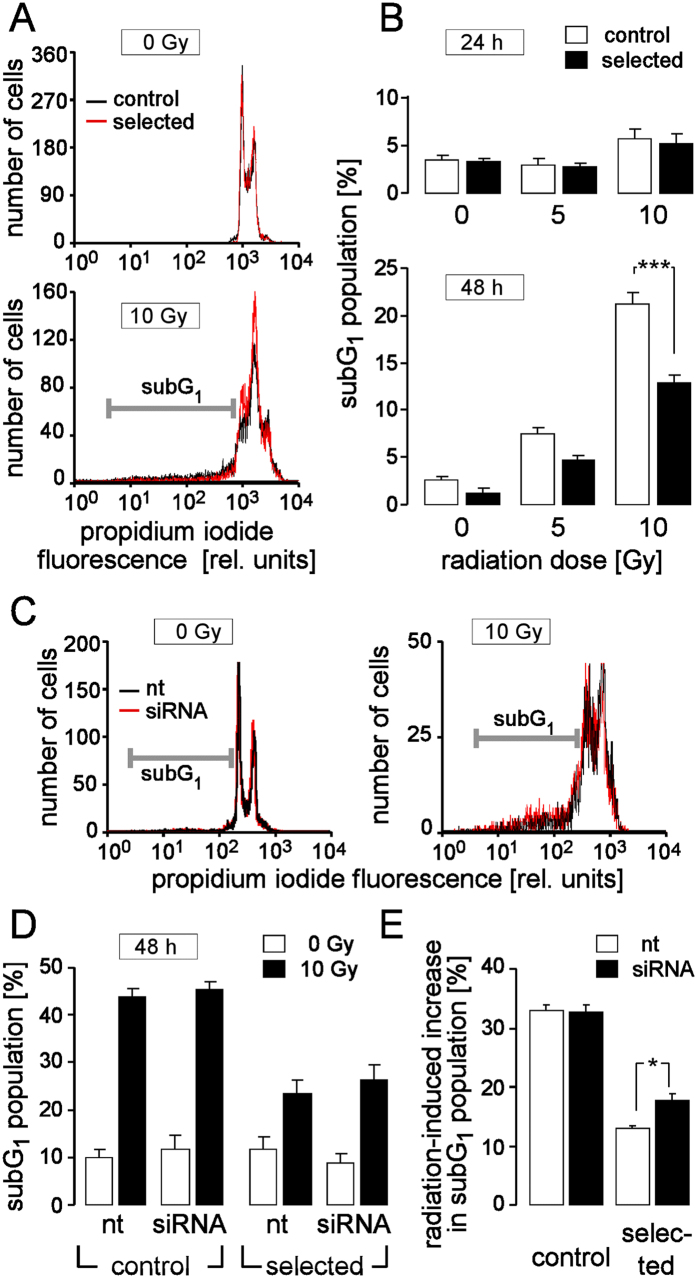
Tumor cells can adapt to a hostile environment with reduced oxygen supply. The present study aimed to identify mechanisms that confer hypoxia resistance. Partially hypoxia/reoxygenation (H/R)-resistant proximal tubular (PT) cells were selected by exposing PT cultures to repetitive cycles of H/R. Thereafter, H/R-induced changes in mRNA and protein expression, inner mitochondrial membrane potential (ΔΨ(m)), formation of superoxide, and cell death were compared between H/R-adapted and control PT cultures. As a result, H/R-adapted PT cells exhibited lower H/R-induced hyperpolarization of ΔΨ(m) and produced less superoxide than the control cultures. Consequently, H/R triggered ΔΨ(m) break-down and DNA degradation in a lower percentage of H/R-adapted than control PT cells. Moreover, H/R induced upregulation of mitochondrial uncoupling protein-3 (UCP-3) in H/R-adapted PT but not in control cultures. In addition, ionizing radiation killed a lower percentage of H/R-adapted as compared to control cells suggestive of an H/R-radiation cross-resistance developed by the selection procedure. Knockdown of UCP-3 decreased H/R- and radioresitance of the H/R-adapted cells. Finally, UCP-3 protein abundance of PT-derived clear cell renal cell carcinoma and normal renal tissue was compared in human specimens indicating upregulation of UCP-3 during tumor development. Combined, our data suggest functional significance of UCP-3 for H/R resistance.


Figures

Figure 1
Figure 1. Repetitive exposure to hypoxia/reoxygenation (H/R) selected partial H/R-resistent proximal convoluted tubule (PT) cells.
(A) Selection protocol. (B) Histograms showing the propidium iodide fluorescence intensity of permeabilized control and H/R-adapted PT cells. Cells were recorded by flow cytometry either under control conditions (72 h of normoxia, black line) or after 48 h of hypoxia (0.1% oxygen) followed by 24 h of reoxygenation (red line). The marker indicates the dead cells (sub G1 population). (C) Mean percentage (±SE, n = 24 from 4 cultures each measured in hexaduplicate) of dead cells (sub G1 population) in control (open bars) and H/R-adapted cultures (closed bars) grown under normoxia (left) or under hypoxia (48 h of 0.1% oxygen) followed by 0.5 h (top), 24 h (middle) and 48 h (bottom) of reoxygenation. * and *** indicate p ≤ 0.05 and p ≤ 0.001, respectively (ANOVA). (D) Time course of resistance acquisition. Shown is the selection-cycle-dependent H/R-induced cell death of the H/R-adapted cultures normalized to that of the particular control cultures (means ± SE, n = 4).
Figure 2
Figure 2. H/R induces an up-regulation of the mitochondrial uncoupling protein-3 (UCP-3) in H/R-adapted but not in control PT cultures.
(A) Mean (±SE, n = 3) GAPDH-normalized UCP-3 mRNA abundance of control (open bars) and H/R-adapted PT cultures (closed bars) under normoxia (left) or after hypoxia (48 h)/reoxygenation (24 h) as determined by quantitative RT-PCR. (B) Immunoblot of PAGE-separated proteins from control (1st and 2nd lane) H/R-adapted PT cultures (3rd and 4th lane) probed against UCP-3 and β-actin. Cell lysates were prepared from normoxic (upper blot) and cultures which underwent H/R stress (lower blot). (C). Densitometrically semi-quantified increase in UCP-3 protein of control (open bar) and H/R-adapted PT-cultures induced by hypoxia(48 h)/reoxygenation (24 h; means ± SE, n = 3 cultures each; * indicates p ≤ 0.05, two-tailed Welch-corrected t-test).
Figure 3
Figure 3. H/R-adapted cultures exhibit after H/R stress less hyperpolarization of the inner mitochondrial membrane potential (ΔΨm) than control cultures.
(A,B) Dot plots (A) and histograms (B) showing forward scatter and tetramethylrhodamine-ethyl-ester-perchlorate (TMRE) fluorescence as a measure of cell size and ΔΨm, respectively. Depicted are a control (left) and a H/R-adapted PT culture (right) recorded by flow cytometry under normoxic conditions (black lines in (B)) and after H/R stress (48 h hypoxia/24 h reoxygenation; (A) and red histograms in (B)). Cell populations with dissipated ΔΨm (low ΔΨm) are indicated by gate and marker in A and B, respectively. (C,D) Mean percentage of control (open bars) and H/R-adapted cells (closed bars) with broken-down ΔΨm (C) and (D) mean TMRE fluorescence intensity of the cell population with high ΔΨm (±SE, n = 9 from 3 cultures each determined in triplicate) recorded as in (B) under normoxic conditions (left), after H/R stress (48 h hypoxia/24 h reoxygenation, middle), or after pharmacological break-down of ΔΨm by the proton ionophore carbonyl cyanide-3-chlorophenylhydrazone (CCCP, 1 μM). * and ** indicate p ≤ 0.05 and p ≤ 0.01, respectively (ANOVA).
Figure 4
Figure 4. H/R produces less reactive oxygen species (ROS) in H/R-adapted than in control cultures.
(A) Histograms showing the MitoSOX fluorescence as a measure of mitochondrial superoxide production. PT cells were recorded by flow cytometry from a control (top) and a H/R-adapted culture under normoxic conditions (black lines), after H/R stress (48 h hypoxia/24 h reoxygenation, red lines) or after oxidation with tertbutylhydroperoxide (tBHP, 1 mM). (B) Mean MitoSOX fluorescence intensities recorded as in (A) under normoxic conditions (left), after H/R stress (48 h hypoxia/24 h reoxygenation, middle, data are means ± SE, n = 10–12 from 4 cultures each determined in duplicate or triplicate), or after oxidation with tBHP (means ± SE, n = 4 from 4 cultures recorded under normoxia) *** indicates p ≤ 0.001 (ANOVA).
Figure 5
Figure 5. UCP-3 knock-down increases H/R-induced superoxide production and cell death.
(A) Immunoblot showing the UCP-3 (upper gel) and—for loading control—the β-actin (lower gel) protein abundance in PT culture transfected with non-targeting (nt) RNA (left lane) or with UCP-3 siRNA (right lane). The ratio indicates the densitometrically semi-quantified β-actin-normalized relative UCP-3 protein abundance. (B) Histograms showing the MitoSOX fluorescence of nt- (black lines) and UCP-3 siRNA-transfected (red lines) PT cells after normoxia (top) or H/R stress (48 h hypoxia/24 h reoxygenation, bottom), recorded as in Fig. 4. (C) Mean normalized MitoSOX fluorescence intensities of nt- (open bars) and UCP-3 siRNA-transfected (closed bars) control and H/R-adapted PT cultures PT cells recorded in as in (B) under normoxic conditions or after H/R stress. Data are means ± SE, n = 6 from 2 cultures each determined in triplicate. (D) Histograms showing the propidium iodide fluorescence of permeabilized nt- (black line) and UCP-3 siRNA-transfected (red line) control (left) and H/R-adapted PT cultures (right) after hypoxia (48 h)/reoxygenation (24 h, recorded as in Fig. 1). (E) Mean percentage (±SE, n = 7–9 from 3 cultures each recorded in duplicate or triplicate) of dead cells (sub G1 population) in nt- (open bars) or UCP-3 siRNA-transfected control and H/R-adapted PT cultures after H/R stress (48 h hypoxia/24 h reoxygenation. * and *** indicate p ≤ 0.05 and p ≤ 0.001, respectively (ANOVA).
Figure 6
Figure 6. UCP-3 protein expression in human renal cell carcinoma and adjacent non-cancerous normal renal tissue.
(A) Human nephrectomy specimen top view (upper panel) and opened cut halves (lower panel) with renal cell carcinoma (RCC). Areas of necrosis and residual normal tissue, as well as locations of the sample taking are indicated (N: normal renal tissue, T: tumor without defined origin. TN: tumor close to necrotic area, TP: tumor at the periphery). (B) Immunoblot of renal cell carcinoma and normal renal tissue (as shown in (A)) probed against UCP-3 (2nd panel), GAPDH (3rd panel) and β-actin (4th panel). The 1st panel depicts the corresponding protein stain (PageBlue). The low or even missing housekeeper bands of the 4th and 8th sample (from left) might be explained by strong overexpression of other proteins by theses two tumors. Since electrophoresis loading volume was adjusted to total protein concentration strong overexpression of some proteins dilutes the housekeeper proteins in these samples. Boxes indicate samples which originated from the same kidney. (C) Scoring of the UCP-3 protein abundance in non-cancerous renal tissue (open circles) and clear cell RCCs (closed red triangles), papillary RCCs (closed blue triangles) or mixed RCCs (closed violet triangles). ** indicates p ≤ 0.01, Welch-corrected, two-tailed t-test.
Figure 7
Figure 7. Cross resistance of H/R-adapted cultures against ionizing radiation.
(A) Histograms showing the propidium iodide fluorescence of permeabilized control (black) and H/R-adapted (red) PT cells. Cells were recorded by flow cytometry 48 h after irradiation (under normoxic conditions) with 0 Gy (top) or 10 Gy (botom). The marker indicates the dead cells (sub G1 population). Percentage of dead cells (sub G1 population) in control (open bars) and H/R-adapted cultures (closed bars) 24 h (top) and 48 h (bottom) after irradiation (under normoxic conditions) with 0, 5, or 10 Gy. (C) Propidium iodide histograms of nt RNA- (black) and UCP-3 siRNA (red) transfected H/R-adapted PT cells 48 h after irradiation with 0 Gy (left) or 10 Gy (right). (D) Sub G1 population control (left) and H/R-adapted PT cultures (right) 96 h after transfection with nt or UCP-3 siRNA (as indicated) and 48 h after irradiation with 0 Gy (open bars) and 10 Gy (closed bars). Data are means ± SE, n = 9 in (B) or n = 6 in (D,E) from 3 (B) or 2 (D,E) cultures each determined in triplicates. * and *** indicate p ≤ 0.05 and p ≤ 0.001 (ANOVA), respectively.

References

    1. Huber S. M., Misovic M., Mayer C., Rodemann H. P. & Dittmann K. EGFR-mediated stimulation of sodium/glucose cotransport promotes survival of irradiated human A549 lung adenocarcinoma cells. Radiother Oncol 103, 373–379 (2012). - PubMed
    1. Dittmann K., Mayer C., Rodemann H. P. & Huber S. M. EGFR cooperates with glucose transporter SGLT1 to enable chromatin remodeling in response to ionizing radiation. Radiother Oncol 107, 247–251 (2013). - PubMed
    1. Huber S. M. Oncochannels. Cell Calcium 53, 241–255 (2013). - PubMed
    1. Huber S. M. et al. Ionizing radiation, ion transports, and radioresistance of cancer cells. Front Physiol 4, 212 (2013). - PMC - PubMed
    1. Duranton C. et al. CFTR is involved in the fine tuning of intracellular redox status: physiological implications in cystic fibrosis. Am J Pathol 181, 1367–1377 (2012). - PubMed

Publication types