. 2015 Aug 25:6:8065.
doi: 10.1038/ncomms9065.

Transcription errors induce proteotoxic stress and shorten cellular lifespan

Affiliations

Transcription errors induce proteotoxic stress and shorten cellular lifespan

Marc Vermulst et al. Nat Commun. .

Erratum in

  • Corrigendum: Transcription errors induce proteotoxic stress and shorten cellular lifespan.
    Vermulst M, Denney AS, Lang MJ, Hung CW, Moore S, Moseley MA, Thompson JW, Madden V, Gauer J, Wolfe KJ, Summers DW, Schleit J, Sutphin GL, Haroon S, Holczbauer A, Caine J, Jorgenson J, Cyr D, Kaeberlein M, Strathern JN, Duncan MC, Erie DA. Vermulst M, et al. Nat Commun. 2015 Oct 14;6:8738. doi: 10.1038/ncomms9738. Nat Commun. 2015. PMID: 26465398 No abstract available.

Abstract

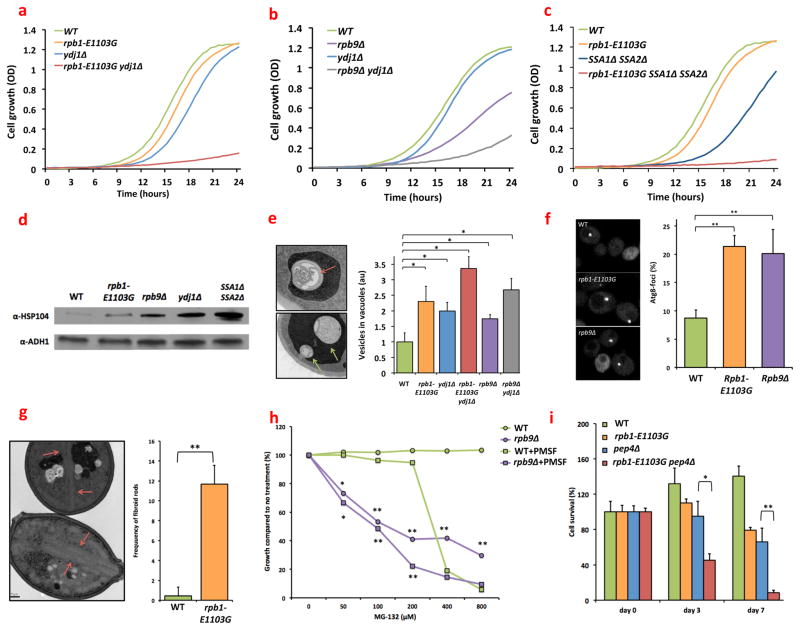
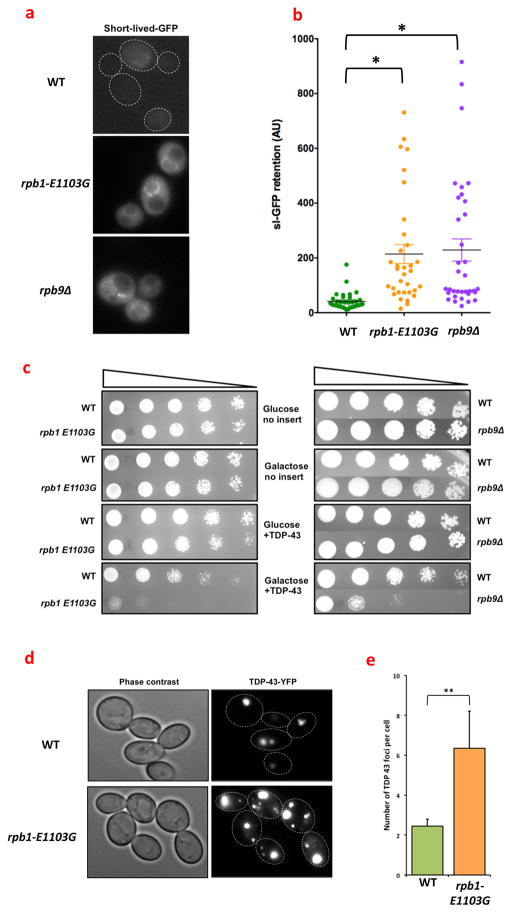
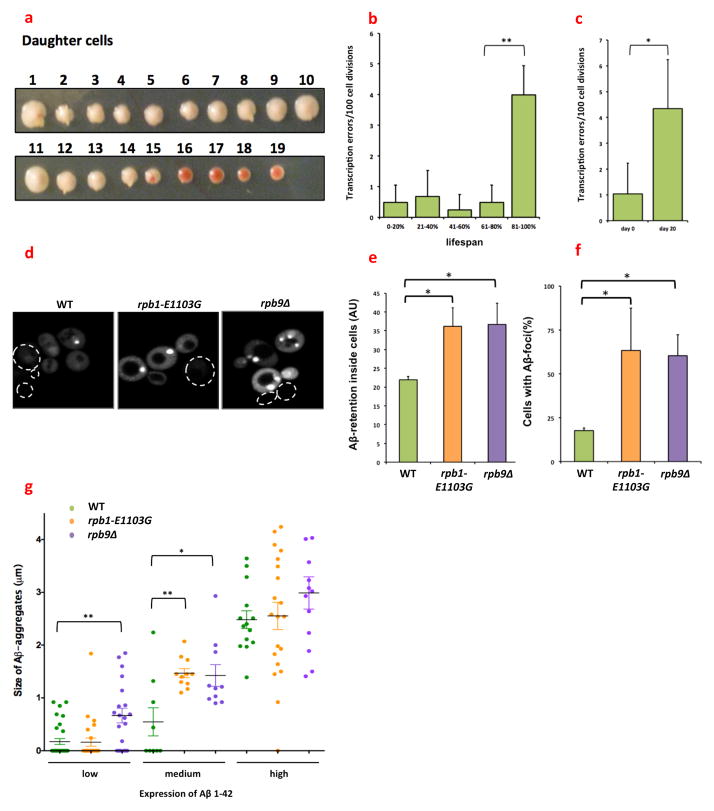
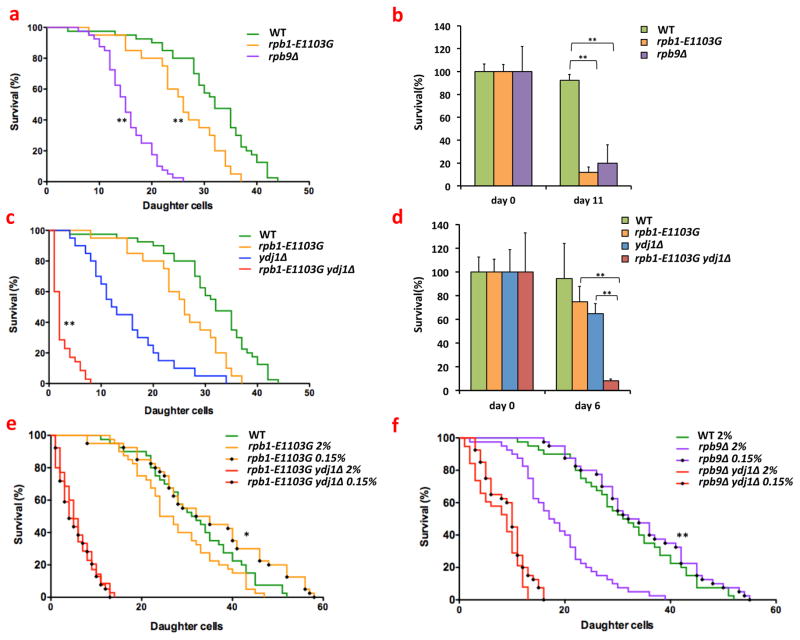
Transcription errors occur in all living cells; however, it is unknown how these errors affect cellular health. To answer this question, we monitor yeast cells that are genetically engineered to display error-prone transcription. We discover that these cells suffer from a profound loss in proteostasis, which sensitizes them to the expression of genes that are associated with protein-folding diseases in humans; thus, transcription errors represent a new molecular mechanism by which cells can acquire disease phenotypes. We further find that the error rate of transcription increases as cells age, suggesting that transcription errors affect proteostasis particularly in aging cells. Accordingly, transcription errors accelerate the aggregation of a peptide that is implicated in Alzheimer's disease, and shorten the lifespan of cells. These experiments reveal a previously unappreciated role for transcriptional fidelity in cellular health and aging.


Figures

Fig. 1
Fig. 1
Genetic, biochemical and ultrastructural data suggest that cells that exhibit error prone transcription experience proteotoxic stress. (a) In the absence of YDJ1, rpb1-E1103G (MVY0001-4) and cells grow very slowly. (b) In the absence of YDJ1, rpb9Δ cells grow very slowly (MVY0001, 3, 4, 6). Each cell line was diluted to OD 0.001, and aliquoted in triplicate into a 96-well plate. Cell strains were then allowed to grow uninterrupted for 24 hours at 30°C while an OD measurement was made every 15 minutes. (c) In the absence of SSA1 and SSA2, rpb1-E1103G cells grow very slowly (MVY0001, 2, 7, 8). The protocol described in figure legend 1a and b was used for this experiment as well. (d) Similar to cells that have lost YDJ1 or SSA1 and SSA2, rpb1-E1103G cells and rpb9Δ cells display increased expression of Hsp104 (MVY0001-4, 7). Cells were grown into log phase, lysed, and analyzed by Western blotting with an anti-body against Hsp104. (e) Autophagic remnants (top panel, red arrows) and inclusion bodies (middle panel, green arrows) are more frequently present in the vacuoles of rpb1-E1103G and rpb9Δ cells compared to WT cells (MVY0001-6). The prevalence of these vesicles can be exacerbated further by YDJ1 deletion. (f) Cells were transformed with a GFP-tagged copy of ATG8. Foci indicate locations where autophagosome formation occurs. The number of foci present per cell is an indication of autophagy activity (MVY0001-3). (g) Fibroid, crystalline protein aggregates (red arrows) are present in rpb1-E1103G cells that were chronologically aged for 96 hours in a 30°C incubator (MVY0001-2). (h) Rpb9Δ cells are more sensitive to increasing concentrations of MG-132 than WT cells. The sensitivity of Rpb9 cells to MG-132 can be enhanced further by simultaneously inhibiting proteases present in the vacuole by 200uM PMSF (MVY0001, 3). (i) Deletion of PEP4 shortens the chronological lifespan of rpb1-E cells (MVY0001, 2, 13, 14). Cells were allowed to grow into stationary phase for 48 hours (day 0) and the number of colony forming units (CFUs) determined. After 3 and 7 days of incubation and constant shaking at 30°C, the number of CFUs were determined again and compared to day 0. At least 3 biological replicates were used for each genotype for each experiment presented above. Images and western blots were quantified with ImageJ software. *= P<0.05, **= P<0.01
Fig. 2
Fig. 2
Transcription errors overextend the protein quality control machinery. (a) WT cells and rpb1-E1103G cells were transformed with a short-lived-GFP molecule, which is an indicator of the strain placed upon cellular protein quality control pathways. rpb1-E1103G and rpb9Δ cells display a brighter GFP signal than WT cells, indicating that sl-GFP is degraded less efficiently in the error prone cells compared to the WT cells and that PQC is overextended in the error prone cells. Dashed lines outline cells that are difficult to see due to low fluorescence (MVY0001-3). (b) Quantification of the retention of sl-GFP in WT cells, rpb1-E1103G cells and rpb9Δ cells (MVY0001-3). (c) Cells were either transformed with an empty vector, or a plasmid that contained a YFP-tagged copy of TDP-43, which was placed under the control of a GAL4 promoter. The transformed cells were then spotted in 4-fold dilutions on plates that contained gluocose (no expression) or galactose (expression). Expression of TDP-43 inhibited the growth of rpb1-E1103G and rpb9Δ cells to a greater degree than WT cells, as shown by reduced growth of the error prone cells at multiple dilutions (MVY0001-3). (d) Cells were transformed with a YFP-tagged copy of TDP-43, grown into log-phase and monitored under a fluorescence microscope. Despite identical expression patterns, rpb1-E1103G cells contain more protein aggregates than WT cells, indicating that they have greater difficulty destroying the TDP-43 protein. The aggregates in rpb1-E1103G cells are also larger in size compared to WT cells (MVY0001-2). (e) Quantification of the number of TDP-43 foci in WT cells and rpb1-E1103G cells. At least 3 biological replicates were used for each genotype for each experiment presented above. Images were quantified with ImageJ software (MVY0001-2). **= P<0.01
Fig. 3
Fig. 3
The fidelity of transcription changes as a function of age. (a) Example of a replicative assay for one mother cell. Daughter cells were collected from an aging mother cell, and displayed in a row across a plate. In the image shown, each consecutive daughter is numbered. These daughter cells were grown into a colony, which allowed us to score transcription errors by monitoring red sectoring in the growing colonies. A transcription error could occur in either the mother cell, or one of the daughter cells. If a transcription error occurred in the mother cell, all the subsequent daughter cells born after this event would grow into red colonies (cell 16–19). If a transcription error occurred in the daughter cell though, then only that colony would be affected. For instance, while daughter 15 was growing into a colony, one of its progeny experienced a transcription error, resulting in a clearly visible red sector inside the colony (diploid cross between GRY3337 and GRY3724). (b) The error rate of transcription increases approximately 8-fold as a function of the replicative age of the cell. Virgin cells containing the reporter construct were selected and the transcriptional error rate of each cell was determined as a function of their age. For example, if a cell gave birth to a total of 20 daughters, and a transcription error occurred at daughter 17, then the error occurred at 85% of its lifespan(diploid cross between GRY3337 and GRY3724). (c) The error rate of transcription increases approximately 4-fold as a function of the chronological age of the cell. Cells were grown into stationary phase for 48 hours in YAPD (day 0) and aged for extended periods of time while the number of CFUs was determined every 3 days (diploid cross between GRY3337 and GRY3724). (d) Aβ1-42 aggregates into more numerous foci in rpb1-E1103G and rpb9Δ cells than in WT cells. Cells were transformed with a plasmid that contains a GFP-tagged copy of Aβ1-42, which was placed under the control of a PGK1 promoter and monitored with a fluorescence microscope. Dashed outlines outline cells that are difficult to see due to low fluorescence (MVY0001-3). (e) More Aβ1-42 is present inside rpb1-E1103G compared to WT cells despite equal expression levels; however, rpb9Δ cells have a 20% lower expression of Aβ1-42 compared to WT cells. We therefore normalized Aβ1-42 expression in rpb9Δ cells to GFP expression. With or without this correction, more Aβ1-42 is retained inside both of the error prone cells compared to WT cells. Approximately 120 cells were analyzed for each genotype (MVY0001-3). (f) A greater number of Aβ1-42 foci appear in rpb1-E1103G and rpb9Δ cells (MVY0001-3). (g) Aβ1-42 starts to aggregate at lower levels of expression in rpb1-E1103G and rpb9Δ cells compared. This threshold is reached first in rpb9Δ cells, and then in the rpb1-E1103G cells. At least 3 biological replicates were used for each genotype for each experiment presented above. Images were quantified with ImageJ software (MVY0001-3). *= P<0.05, **= P<0.01
Fig. 4
Fig. 4
Error prone cells have a shortened lifespan. (a) rpb1-E1103G and rpb9Δ cells live shorter replicative lifespans than WT cells. For example, the average lifespan of WT cells is ≈30 divisions, while the average lifespan of rpb9Δ cells is ≈18 divisions. In all replicative lifespan assays, the lifespan of 20–40 mother cells was measured per sample (MVY0001-3). (b) rpb1-E1103G and rpb9Δ cells live shorter chronological lifespans than WT cells. For all chronological lifespan assays, the lifespan of 3–5 replicates was measured per sample (MVY0001-3). (c) Deletion of YDJ1 results in a profound reduction of the replicative lifespan of rpb1-E1103G cells (MVY0001, 2, 4, 5). (d) Deletion of YDJ1 results in a profound reduction of the chronological lifespan of rpb1-E1103G cells (MVY0001, 2, 4, 5). (e) Dietary restriction rescues the shortened lifespan of rpb1-E1103G cells, but not rpb1-E1103G ydj1Δ cells (MVY0001, 2, 5). (f) Dietary restriction rescues the shortened lifespan of rpb9Δ cells, but not rpb9Δ ydj1Δ cells (MVY0001, 3, 6). At least 3 biological replicates were used for each genotype for each experiment presented above. Kaplan Meier curves and analysis was performed with Prism Graphpad software. *= P<0.05, **= P<0.01

References

    1. Hanahan D, Weinberg RA. The hallmarks of cancer. Cell. 2000;100(1):57–70. - PubMed
    1. Wanagat J, Cao Z, Pathare P, Aiken JM. Mitochondrial DNA deletion mutations colocalize with segmental electron transport system abnormalities, muscle fiber atrophy, fiber splitting, and oxidative damage in sarcopenia. Faseb J. 2001;15(2):322–332. - PubMed
    1. Kraytsberg Y, et al. Mitochondrial DNA deletions are abundant and cause functional impairment in aged human substantia nigra neurons. Nat Genet. 2006;38(5):518–520. - PubMed
    1. Viswanathan A, You HJ, Doetsch PW. Phenotypic change caused by transcriptional bypass of uracil in nondividing cells. Science. 1999;284(5411):159–162. - PubMed
    1. Schimmel P. Development of tRNA synthetases and connection to genetic code and disease. Protein Sci. 2008;17(10):1643–1652. - PMC - PubMed

Publication types

MeSH terms

LinkOut - more resources