. 2015 Dec;5(1):61.
doi: 10.1186/s13561-015-0061-7. Epub 2015 Aug 25.

Waiting time distribution in public health care: empirics and theory

Affiliations

Waiting time distribution in public health care: empirics and theory

Sofia Dimakou et al. Health Econ Rev. 2015 Dec.

Abstract

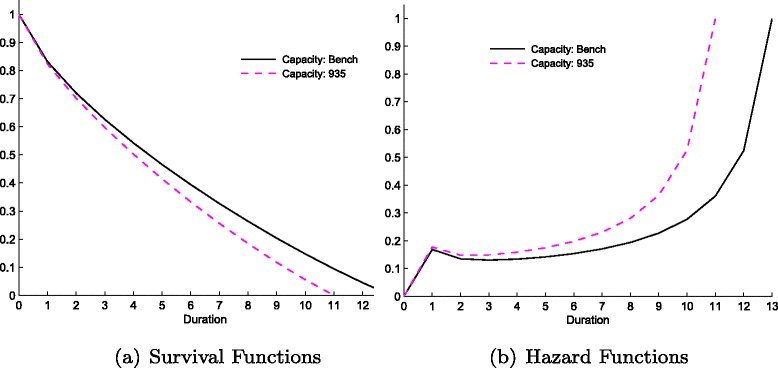
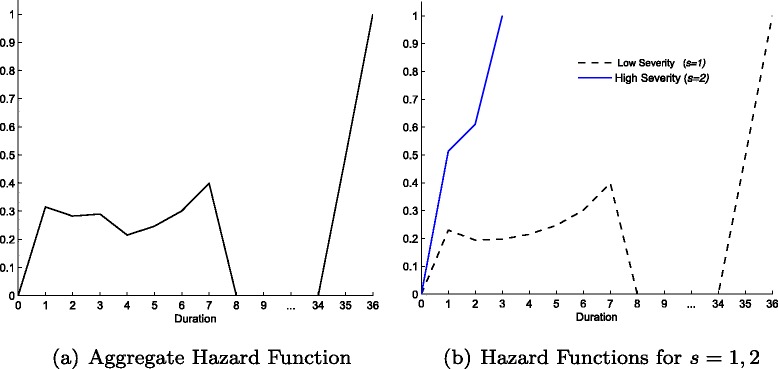
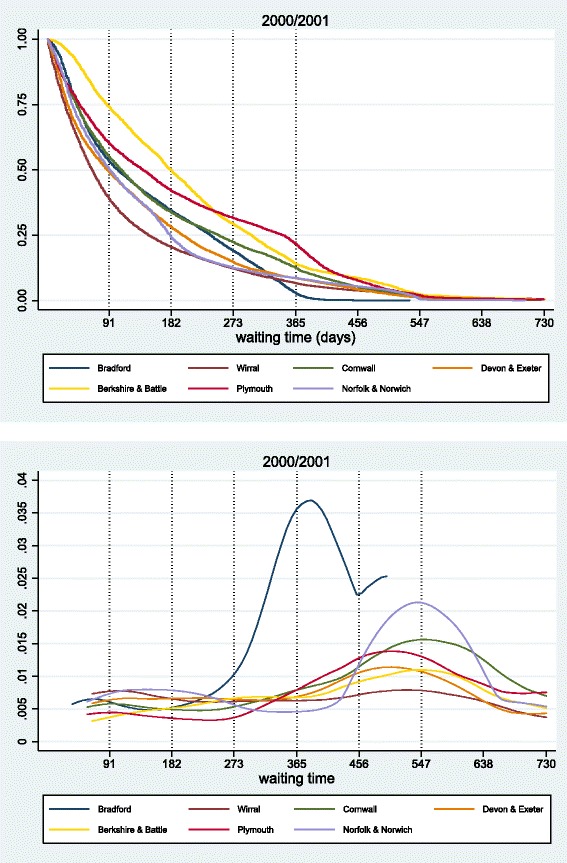
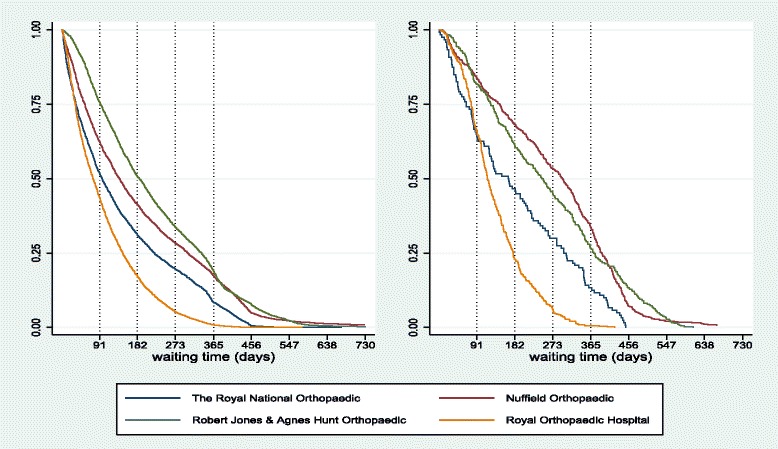
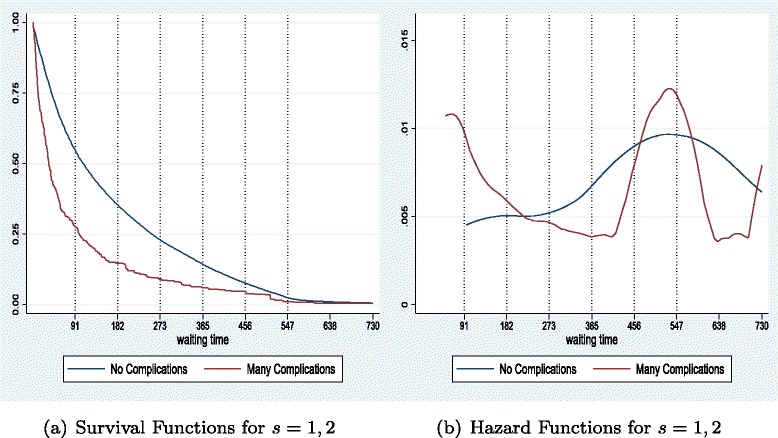
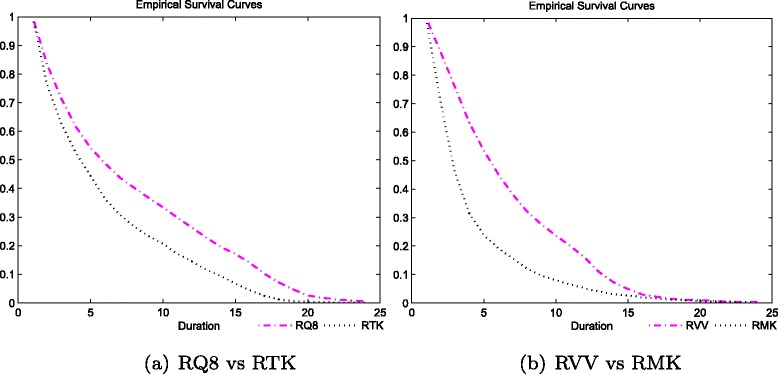
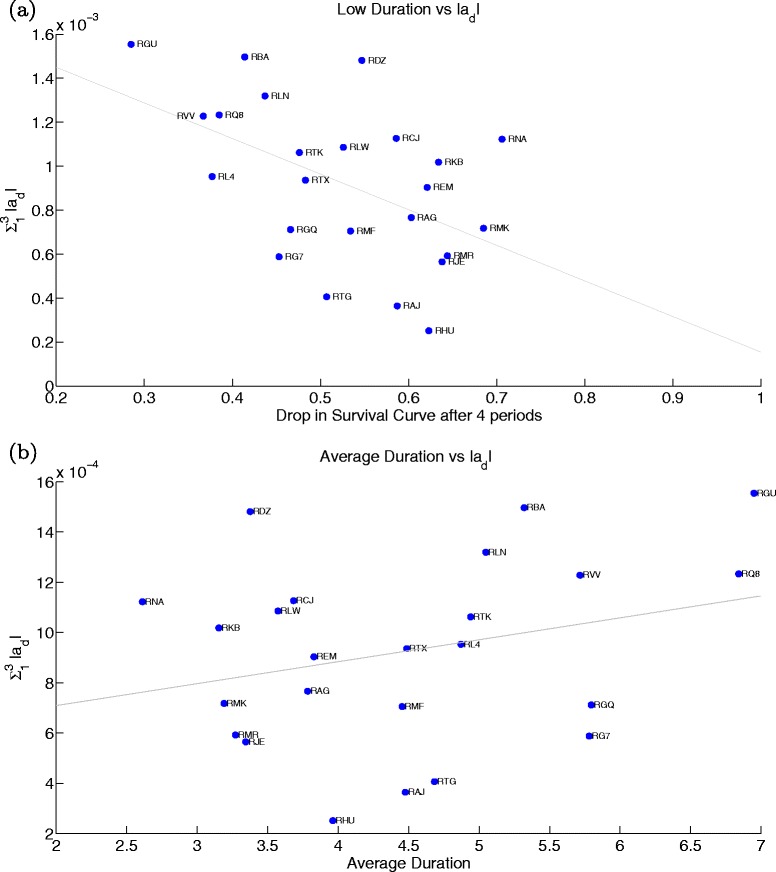
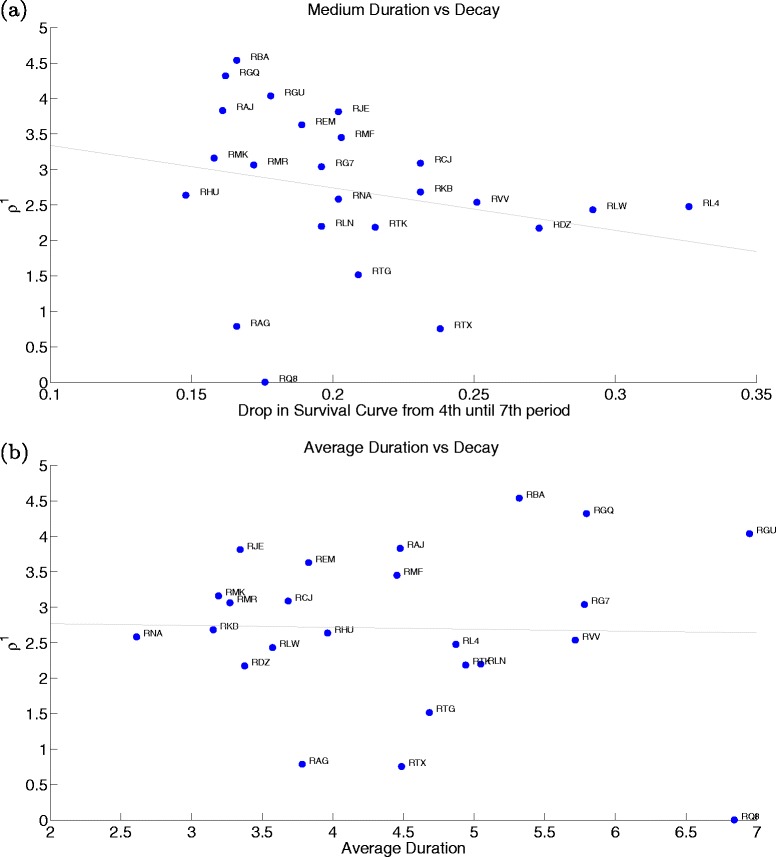
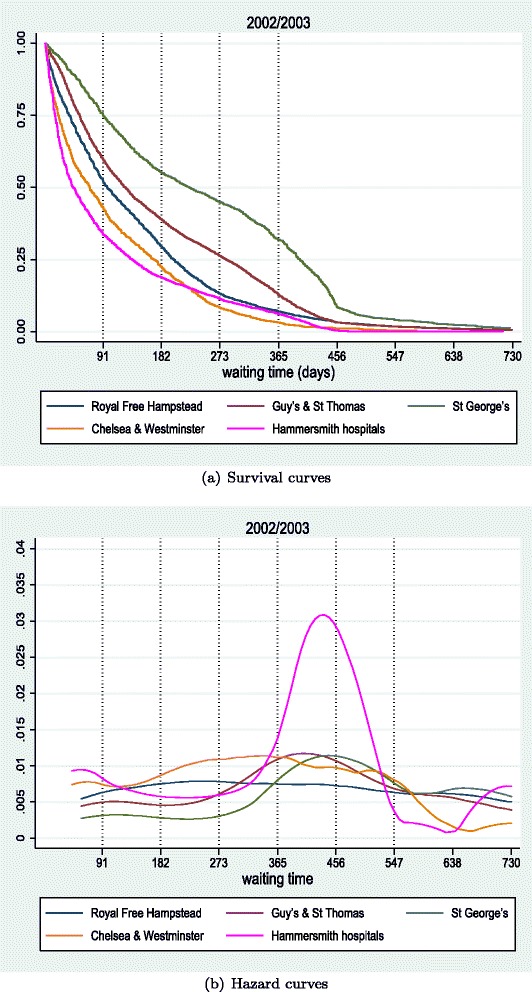
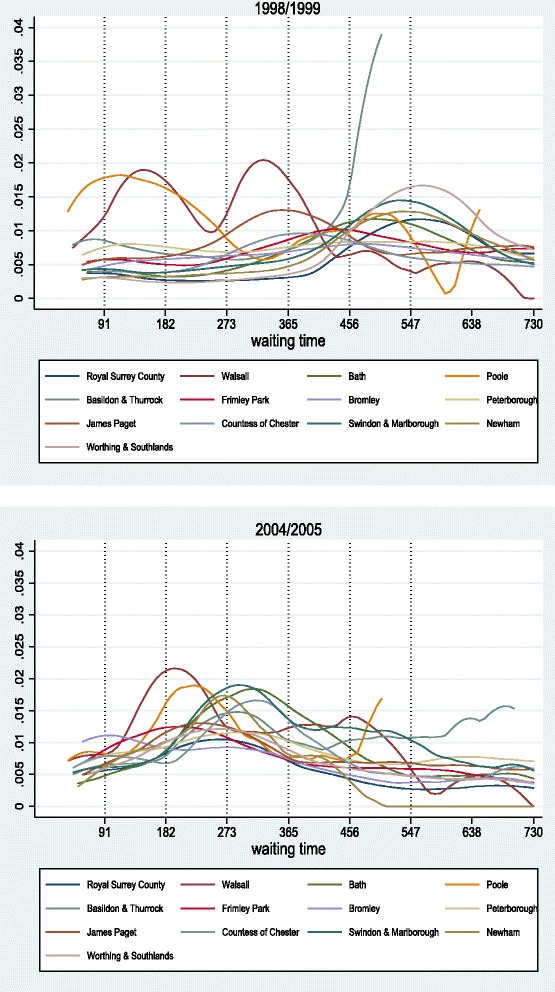
Excessive waiting times for elective surgery have been a long-standing concern in many national healthcare systems in the OECD. How do the hospital admission patterns that generate waiting lists affect different patients? What are the hospitals characteristics that determine waiting times? By developing a model of healthcare provision and analysing empirically the entire waiting time distribution we attempt to shed some light on those issues. We first build a theoretical model that describes the optimal waiting time distribution for capacity constraint hospitals. Secondly, employing duration analysis, we obtain empirical representations of that distribution across hospitals in the UK from 1997-2005. We observe important differences on the 'scale' and on the 'shape' of admission rates. Scale refers to how quickly patients are treated and shape represents trade-offs across duration-treatment profiles. By fitting the theoretical to the empirical distributions we estimate the main structural parameters of the model and are able to closely identify the main drivers of these empirical differences. We find that the level of resources allocated to elective surgery (budget and physical capacity), which determines how constrained the hospital is, explains differences in scale. Changes in benefits and costs structures of healthcare provision, which relate, respectively, to the desire to prioritise patients by duration and the reduction in costs due to delayed treatment, determine the shape, affecting short and long duration patients differently. JEL Classification I11; I18; H51.


Figures

Fig. 1
Fig. 1
Survival (a) and Hazard (b) functions for the Benchmark Model
Fig. 2
Fig. 2
Survival (a) and Hazard (b) functions from changes in the hospital’s capacity
Fig. 3
Fig. 3
Survival (a) and Hazard (b) functions for quadratic and logarithmic utility specifications
Fig. 4
Fig. 4
Survival (a) and Hazard (b) functions from changes in ρ d
Fig. 5
Fig. 5
Aggregate (a) and for each severity (b) Survival functions with two severity levels (Table 3)
Fig. 6
Fig. 6
Aggregate (a) and for each severity (b) Hazard functions with two severity levels (Table 3)
Fig. 7
Fig. 7
Survival (top) and Hazard (bottom) curves for large acute hospitals, 2000/2001
Fig. 8
Fig. 8
Survival curves hospital level-left graphs and hip replacements-right graphs in four orthopaedic hospitals for 2002/2003
Fig. 9
Fig. 9
Survival (a) and Hazard (b) curves by number of complications for all teaching hospitals for 1998/99
Fig. 10
Fig. 10
Survival curves by degree of complications for a teaching (a) and a large acute (b) hospital
Fig. 11
Fig. 11
Estimated degree of capacity constraint versus number of beds (a) and versus average duration (b)
Fig. 12
Fig. 12
Comparing empirical Survival curves across hospitals: RQ8 vs RTK (a) and RVV vs RMK (b)
Fig. 13
Fig. 13
Prioritisation: Estimated benefit structure versus actual drop in survival rates after 4 periods (a) and versus average duration (b)
Fig. 14
Fig. 14
Sensitivity of cost to duration: Estimated cost decay versus actual drop in survival rates from the 4th until 7th period (a) and versus average duration (b)
Fig. 15
Fig. 15
Survival (a) and Hazard (b) curves for teaching hospitals in London, 2002/2003
Fig. 16
Fig. 16
Survival curves for medium acute hospitals, 1998/1999 (top) and 2004/2005 (bottom)
Fig. 17
Fig. 17
Hazard curves for medium acute hospitals, 1998/1999 (top) and 2004/2005 (bottom)
Fig. 18
Fig. 18
Survival (top) and hazard (bottom) curves for small acute hospitals for 2005/2006

References

    1. Iversen T. A theory of hospital waiting lists. J Health Econ. 1993;12(1):55–71. doi: 10.1016/0167-6296(93)90040-L. - DOI - PubMed
    1. Siciliani L. A dynamic model of supply of elective surgery in the presence of waiting times and waiting lists. J Health Econ. 2006;25(5):891–907. doi: 10.1016/j.jhealeco.2005.12.002. - DOI - PubMed
    1. MacCormick AD, Parry B. Waiting time thresholds: Are they appropriate? ANZ J Surg. 2003;73(11):926–8. doi: 10.1046/j.1445-2197.2003.02835.x. - DOI - PubMed
    1. Levy AR, Sobolev BG, Hayden R, Kiely M, FitzGerald JM, Schechter MT. Time on wait lists for coronary bypass surgery in British Columbia, Canada, 1991 - 2000. BMC Health Serv Res.2005;5(22). - PMC - PubMed
    1. Dimakou S, Parkin D, Devlin N, Appleby J. Identifying the impact of government targets on waiting times in the NHS. Health Care Manag Sci. 2009;12(1):1–10. doi: 10.1007/s10729-008-9069-4. - DOI - PubMed

LinkOut - more resources