Case Reports
. 2015 Sep 21;212(10):1641-62.
doi: 10.1084/jem.20140280. Epub 2015 Aug 24.

Human TYK2 deficiency: Mycobacterial and viral infections without hyper-IgE syndrome

Affiliations
Case Reports

Human TYK2 deficiency: Mycobacterial and viral infections without hyper-IgE syndrome

Alexandra Y Kreins et al. J Exp Med. .

Abstract

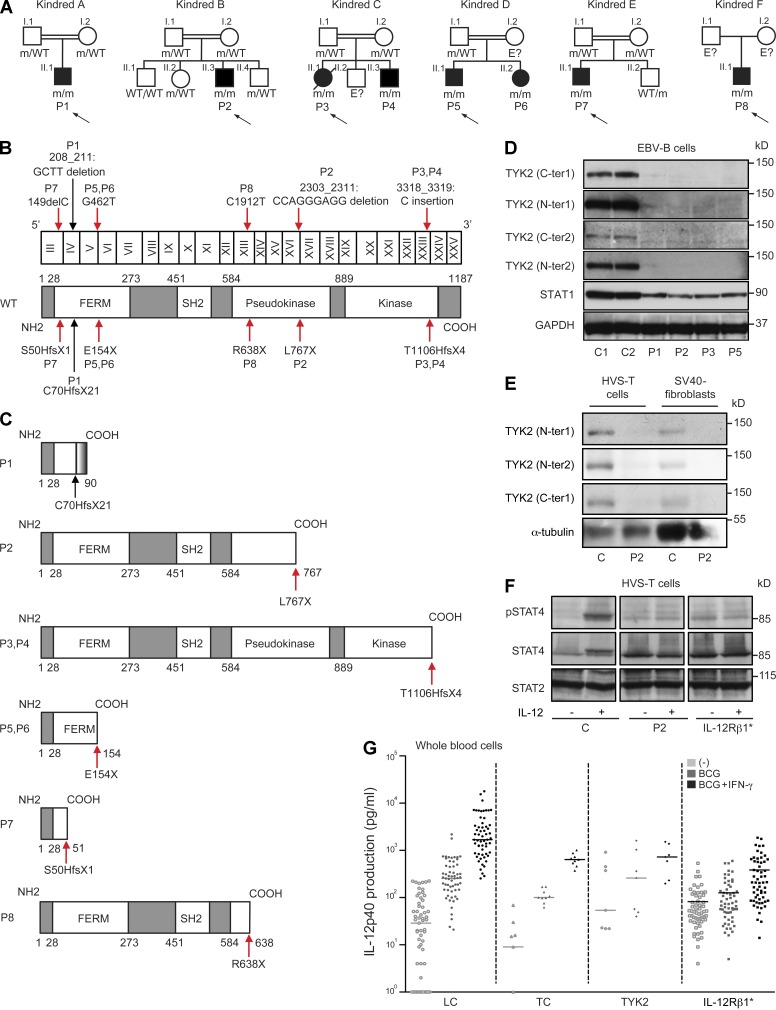
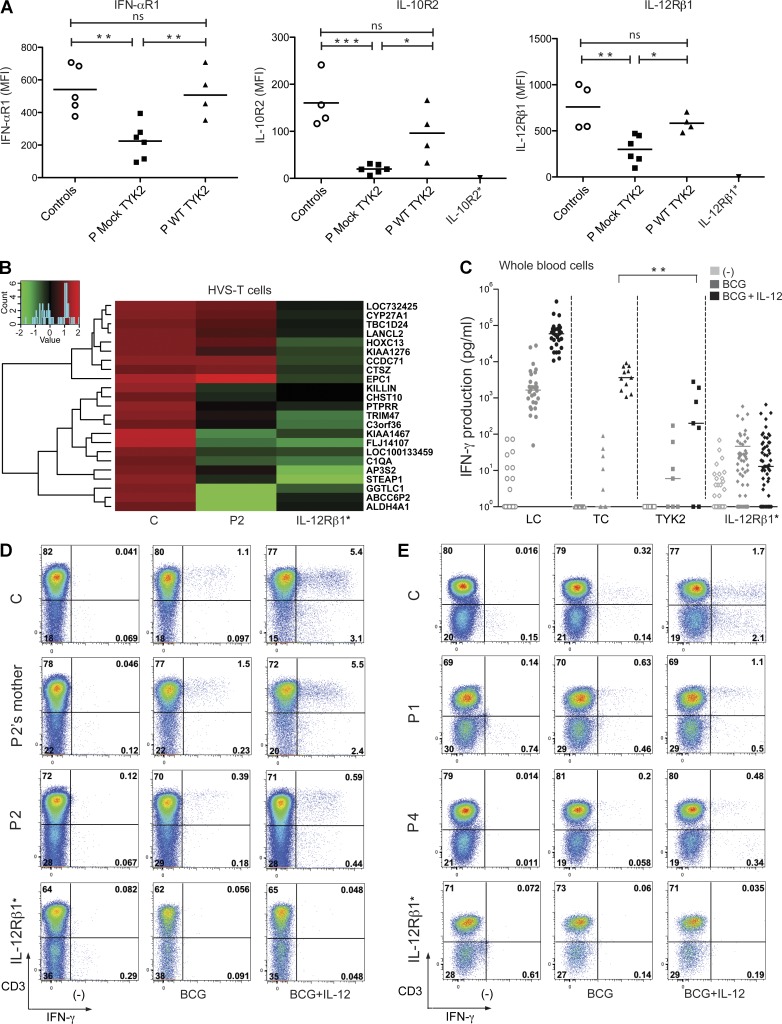
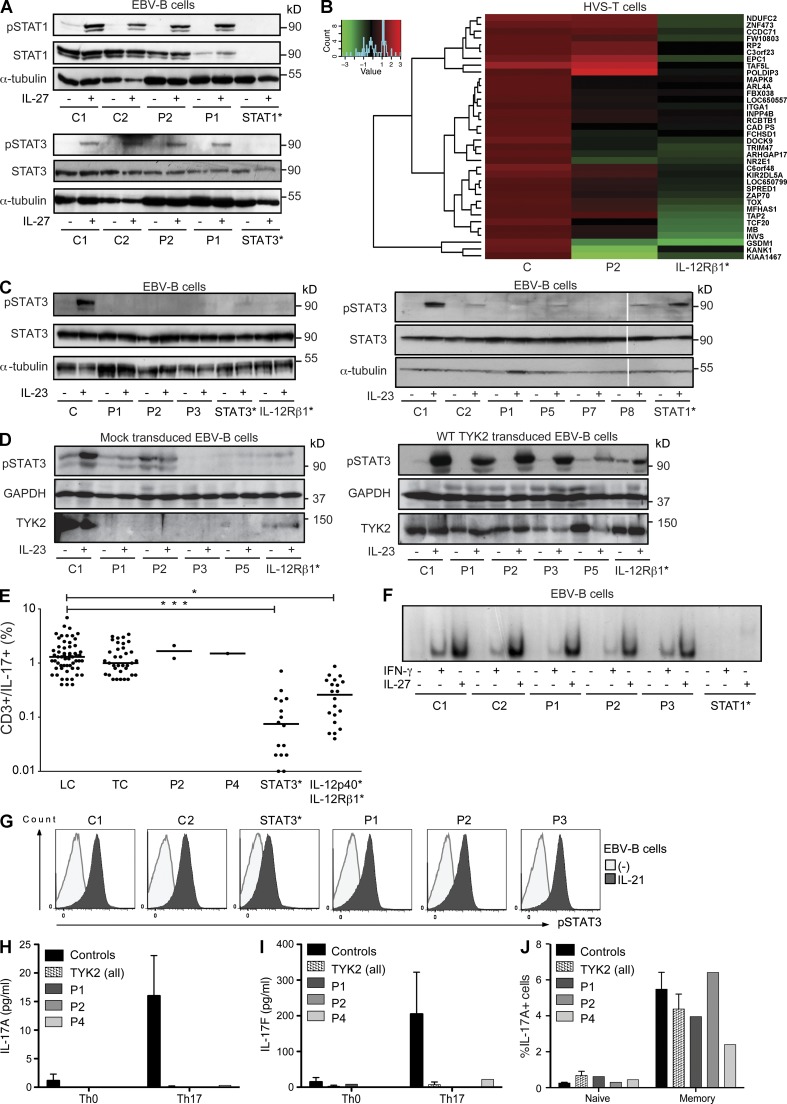
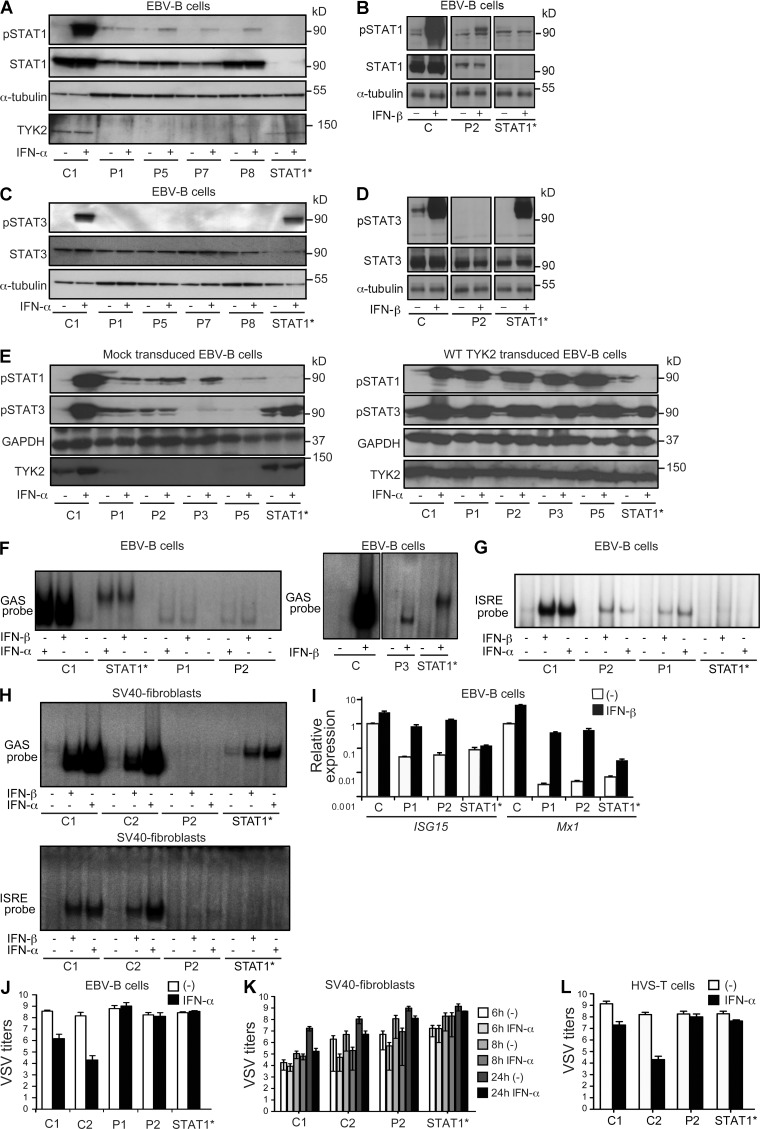
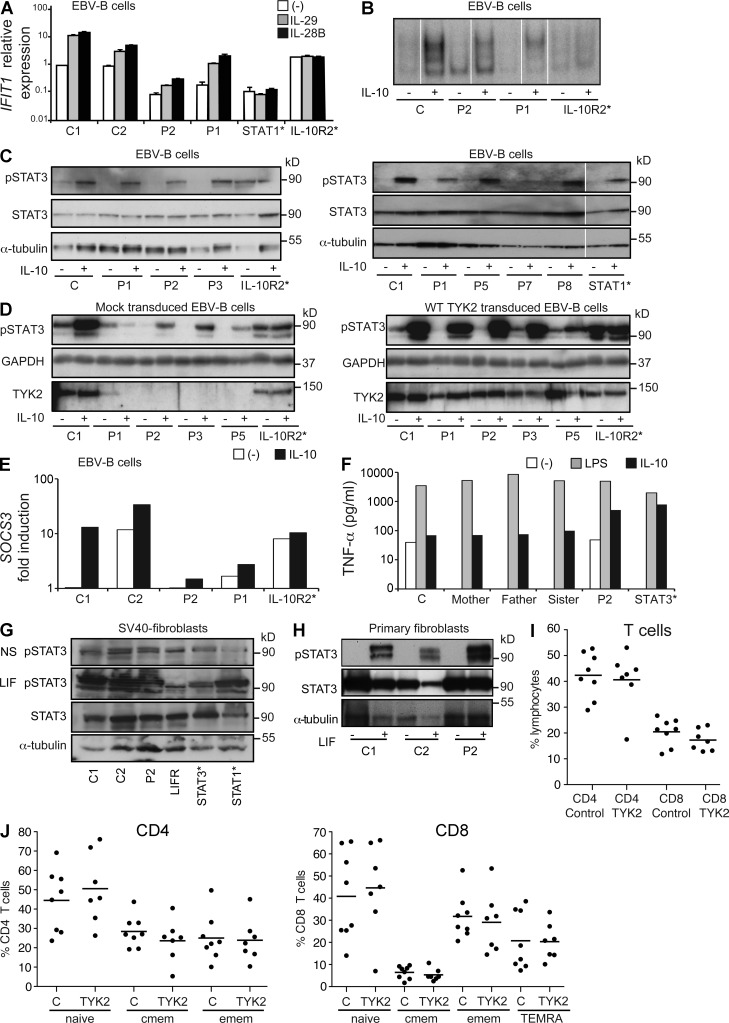
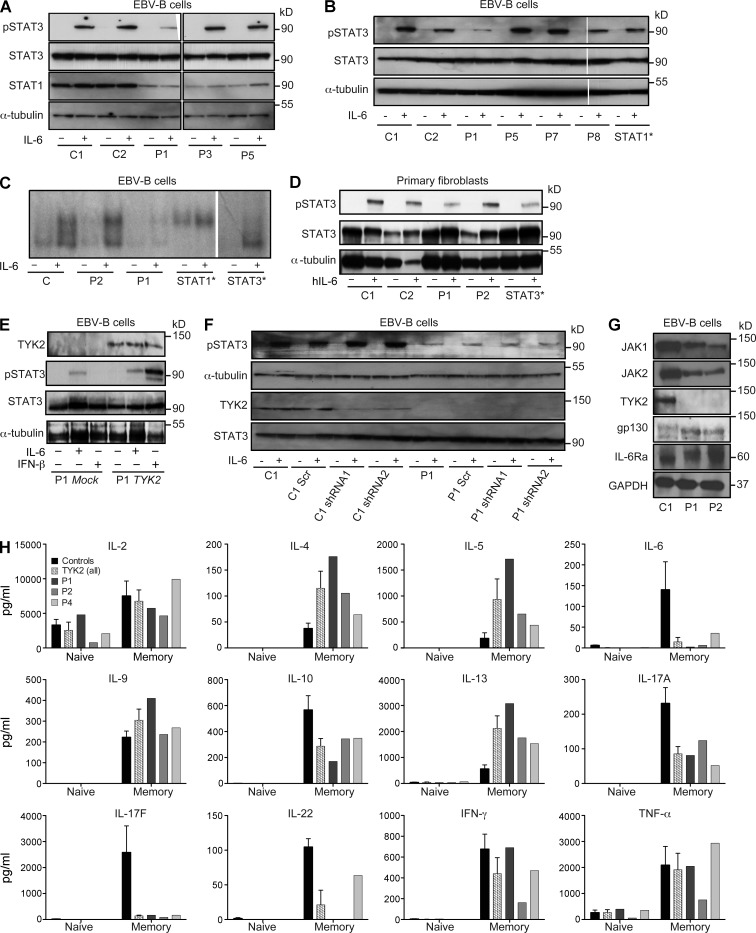
Autosomal recessive, complete TYK2 deficiency was previously described in a patient (P1) with intracellular bacterial and viral infections and features of hyper-IgE syndrome (HIES), including atopic dermatitis, high serum IgE levels, and staphylococcal abscesses. We identified seven other TYK2-deficient patients from five families and four different ethnic groups. These patients were homozygous for one of five null mutations, different from that seen in P1. They displayed mycobacterial and/or viral infections, but no HIES. All eight TYK2-deficient patients displayed impaired but not abolished cellular responses to (a) IL-12 and IFN-α/β, accounting for mycobacterial and viral infections, respectively; (b) IL-23, with normal proportions of circulating IL-17(+) T cells, accounting for their apparent lack of mucocutaneous candidiasis; and (c) IL-10, with no overt clinical consequences, including a lack of inflammatory bowel disease. Cellular responses to IL-21, IL-27, IFN-γ, IL-28/29 (IFN-λ), and leukemia inhibitory factor (LIF) were normal. The leukocytes and fibroblasts of all seven newly identified TYK2-deficient patients, unlike those of P1, responded normally to IL-6, possibly accounting for the lack of HIES in these patients. The expression of exogenous wild-type TYK2 or the silencing of endogenous TYK2 did not rescue IL-6 hyporesponsiveness, suggesting that this phenotype was not a consequence of the TYK2 genotype. The core clinical phenotype of TYK2 deficiency is mycobacterial and/or viral infections, caused by impaired responses to IL-12 and IFN-α/β. Moreover, impaired IL-6 responses and HIES do not appear to be intrinsic features of TYK2 deficiency in humans.


Figures

Figure 1.
Figure 1.
Familial segregation and expression of TYK2 in patients’ cells. (A) Pedigrees of the TYK2-deficient families. Each generation is designated by a Roman numeral (I–II) and each individual by an Arabic numeral. The double lines connecting the parents indicate consanguinity. The probands (P1, P2, P3, P5, P7, and P8) in the six families are indicated by an arrow. Solid shapes indicate disease status. Individuals whose genetic status could not be determined are indicated by “E?”, and “m” indicates a mutated allele. (B) Schematic representations of the TYK2 gene with its 23 coding exons and of the TYK2 protein with its various domains (FERM, SH2, pseudokinase, and kinase). The exons are numbered with Roman numerals (III–XXV). The positions of the TYK2 mutation previously reported for P1 and of the resulting premature STOP codon are indicated by black arrows. The positions of the mutations for P2–P8 and their premature STOP codons are indicated by red arrows. (C) The predicted proteins for P1, P2, P3, P4, P5, P6, P7, and P8 are represented. (D) Levels of TYK2 in the patients’ EBV–B cells. Western blotting was performed with two Abs recognizing the N-terminal epitopes from TYK2 (N-ter1 and N-ter2) and two Abs recognizing the C-terminal epitopes (C-ter1 and C-ter2). Proteins were extracted from EBV–B cells from two healthy controls (C1 and C2) and from the TYK2-mutated patients (P1, P2, P3, and P5). (E) TYK2 levels in the patients’ HVS–T cells and SV40-fibroblasts from a healthy control and P2. Western blotting was performed with two Abs recognizing two different N-terminal epitopes from TYK2 (N-ter1 and N-ter2) and another Ab recognizing C-terminal epitopes (C-ter1). (F) Western blot showing the detection of phospho-STAT4 (pSTAT4) and STAT4 in HVS–T cells from a healthy control (C), P2, and an IL-12Rβ1–deficient patient (IL-12Rβ1*), not stimulated (−) or stimulated for 30 min with 50 ng/ml IL-12 (+). The results in D–F are representative of at least two independent experiments. (G) Response to BCG alone (MOI = 20) and BCG and IFN-γ (5,000 IU/ml), in terms of IL-12p40 production, as assessed by ELISA on whole blood samples from healthy controls (local controls, LC; travel controls, TC), the TYK2-deficient patients (P2 twice, P3, P4, P5, P6, and P7; TYK2), and IL-12Rβ1–deficient patients (IL-12Rβ1*). Mean values for each set of conditions are indicated by solid lines.
Figure 2.
Figure 2.
The IL-12 signaling pathway is impaired in TYK2-deficient patients. (A) Cell surface expression of IFN-αR1, IL-10R2, and IL-12Rβ1 was assessed in EBV–B cells from healthy controls, TYK2-deficient (P1, P2, P3, P5, P6, and P8) mock-transduced cells, TYK2-deficient (P1, P2, P3, and P5) WT TYK2-transduced cells, an IL-12Rβ1–deficient (IL-12Rβ1*) patient, and an IL-10R2–deficient patient (IL-10R2*) by flow cytometry. The results are expressed as mean fluorescence intensity (MFI). A p-value <0.05, <0.01, or <0.001 in two-tailed Student’s t tests is indicated by *, **, or ***, respectively. ns, not significant. Mean values for each condition are indicated by solid lines. (B) Microarray analysis of HVS–T cell lines from three healthy controls, P2, and an IL-12Rβ1–deficient patient. Cells were stimulated for 12 h with 100 ng/ml IL-12. The difference between nonstimulated and stimulated cells is represented as fold change. (C) After 48 h, IFN-γ production was assessed by ELISA on supernatants from the whole blood of healthy donors (local controls, LC), patients’ healthy relatives (travel controls, TC), TYK2-deficient patients P2 (tested twice), P3, P4, P5, P6, and P7 (TYK2), and IL-12Rβ1–deficient patients (IL-12Rβ1*), with and without stimulation with BCG alone (MOI = 20) or BCG and 20 ng/ml IL-12. As seen in the figure, transportation of the blood affects the response to BCG and BCG + IL-12. As the blood of all patients was transported before testing, the results are compared with those for travel controls. A p-value <0.01 for the two-tailed Student’s t test for the comparison of travel controls and TYK2-deficient patients is indicated by **. Mean values for each set of conditions are indicated by solid lines. (D and E) Flow cytometry analysis showing intracellular IFN-γ production in PBMCs after stimulation in the absence (−) or presence of BCG (MOI = 20) or BCG and 100 ng/ml IL-12 for 48 h. An anti-CD3 Ab was used to identify CD3+ T cells. (D) PBMCs from a healthy control (C), patient P2 (P2), his mother (P2’s mother), and an IL-12Rβ1–deficient patient (IL-12Rβ1*). (E) PBMCs from a healthy control (C), patient P1 (P1), patient P4 (P4), and an IL-12Rβ1–deficient patient (IL-12Rβ1*).
Figure 3.
Figure 3.
TYK2 deficiency impairs the response to IL-23 but not to IL-27 nor IFN-γ. (A) Western blot analysis of STAT1 (pSTAT1, top) and STAT3 (pSTAT3, bottom) phosphorylation in EBV–B cells from healthy controls (C1 and C2), TYK2-deficient patients (P1 and P2), a patient with complete STAT1 deficiency (STAT1*), and an AD-HIES patient with a heterozygous STAT3 mutation (WT/T708N; STAT3*), after stimulation with 100 ng/ml IL-27 for 20 min. STAT1, STAT3, and α-tubulin levels were also assessed. The results shown are representative of at least two independent experiments. (B) Microarray analysis of HVS–T cell lines from three healthy controls, P2, and an IL-12Rβ1–deficient patient. Cells were stimulated for 12 h with 100 ng/ml IL-23. The difference between nonstimulated and stimulated cultures is shown as a fold change. (C) Western blot depicting phospho-STAT3 (pSTAT3) in EBV–B cells from a healthy control (C, C1, and C2), TYK2-deficient patients (P1, P2, P3, P5, P7, and P8), an AD-HIES patient carrying a heterozygous STAT3 mutation (WT/T708N; STAT3*), an IL-12Rβ1–deficient patient (IL-12Rβ1*), and a STAT1-deficient patient (STAT1*), without (−) and with (+) stimulation for 30 min with 100 ng/ml IL-23. α-Tubulin was used as a protein loading control. The results shown are representative of at least three independent experiments. After analysis by densitometry, a p-value <0.05 (0.0295) for the two-tailed Student’s t test for the comparison of IL-23–stimulated controls and TYK2-deficient patients (TYK2) was found. White lines indicate that intervening lanes have been spliced out. (D) Western blot depicting phospho-STAT3 (pSTAT3) in mock-transduced (left) and TYK2-transduced (right) EBV–B cells from a healthy control and P1, P2, P3, and P5, without (−) and with (+) stimulation for 30 min with 100 ng/ml IL-23. (E) Flow cytometry analysis of blood from TYK2-deficient patients P2 and P4, healthy controls (local controls, LC; and travel controls, TC), STAT3-deficient patients (STAT3*), and IL-12p40– and IL-12Rβ1–deficient patients (IL-12p40* and IL-12Rβ1*), showing the percentage of CD3+ T cells producing IL-17 ex vivo. A p-value <0.05 or <0.001 in two-tailed Student’s t tests is indicated by * or ***, respectively. Mean values for each set of conditions are indicated by solid lines. (F) Responses to IFN-γ (105 IU/ml for 20 min) and IL-27 (100 ng/ml for 20 min) were evaluated by EMSA in EBV–B cells from the TYK2-deficient patients (P1, P2, and P3), two healthy controls (C1 and C2), and a STAT1-deficient patient (STAT1*), with a GAS probe. (G) Flow cytometry analysis to assess the phosphorylation of STAT3 (pSTAT3) in EBV–B cells from two healthy controls (C1 and C2), three TYK2-deficient patients (P1, P2, and P3), and an AD-HIES patient (STAT3*), left untreated (−) or treated with 100 ng/ml IL-21 for 15 min. Intracellular staining was performed with APC-conjugated anti–human pSTAT3 Ab. (H and I) Cytokine production by in vitro–differentiated naive CD4+ T cells from control donors and TYK2-deficient patients (P1, P2, and P4). Naive (CD45RA+CCR7+) CD4+ T cells were purified from the PBMCs of WT controls (n = 6) or TYK2-deficient patients P1, P2, and P4 and cultured for 5 d. Cells were cultured with TAE beads (anti-CD2/CD3/CD28) alone (Th0) or together with polarizing stimuli (TGFβ, IL-1β, IL-6, IL-21, IL-23, anti–IL-4, and anti–IFN-γ) to generate Th17 type cells. After 5 d, culture supernatants were assessed for the secretion of IL-17A or IL-17F with cytometric bead assays. (J) Naive and memory (defined as CD45RA) CD4+ T cells from WT controls (n = 5) and TYK2-deficient patients (n = 3; P1, P2, and P4) were purified (>98% purity) by FACS and cultured with TAE beads (anti-CD2/CD3/CD28) for 5 d, and the IL-17A+ cells were then assessed by flow cytometry. All error bars indicate SEM.
Figure 4.
Figure 4.
The response to type I IFNs in TYK2-deficient cells is impaired but not abolished. (A–D) Western blot of proteins extracted from EBV–B cells from a healthy control (C), TYK2-deficient patients (P1, P2, P5, P7, and P8), and a STAT1-deficient patient (STAT1*), with and without IFN-α (105 IU/ml) or IFN-β (3.2 × 10⁴ IU/ml) stimulation for 30 min. (A and B) Abs against phosphorylated STAT1 (pSTAT1), STAT1, and tubulin were used. After analysis by densitometry, a p-value <0.01 (0.0018) for the two-tailed Student’s t test for the comparison of IFN-α–pSTAT1 controls and TYK2-deficient patients (TYK2) was found. (C and D) Abs against phosphorylated STAT3 (pSTAT3), STAT3, and tubulin were used. After analysis by densitometry, a p-value <0.01 (0.0008) for the two-tailed Student’s t test for the comparison of IFN-α–pSTAT3 controls and TYK2-deficient patients (TYK2) was found. (E) Western blot detecting pSTAT1 and pSTAT3 in mock-transduced (left) or TYK2-transduced (right) EBV–B cells from a healthy control and P1, P2, P3, and P5, without (−) and with (+) stimulation for 30 min with 105 IU/ml IFN-α. (F and G) EMSA performed on EBV–B cells from a healthy control (C1), three TYK2-deficient patients (P1, P2, and P3), a patient with complete STAT1 deficiency (STAT1*), with (+) and without (−) stimulation with IFN-α (105 IU/ml) or IFN-β (3.2 × 10⁴ IU/ml) for 30 min, with a GAS probe (F) or an ISRE probe (G). (H) EMSA performed on SV40-fibroblasts from healthy controls (C1 and C2), the TYK2-deficient patient P2 (P2), and a patient with complete STAT1 deficiency (STAT1*), with (+) and without (−) stimulation with 105 IU/ml IFN-α or 3.2 × 10⁴ IU/ml IFN-β for 30 min, probed for GAS (top) and ISRE (bottom). (I) Induction of ISG15 (left) and MX1 (right) relative to GUS, as assessed by RT-qPCR on mRNA extracted from EBV–B cells from three healthy controls (mean C), TYK2-deficient patients (P1 and P2), and a patient with complete STAT1 deficiency (STAT1*), without (−) or with stimulation for 6 h with 3.2 × 10⁴ IU/ml IFN-β. (J) EBV–B cells from two healthy controls (C1 and C2), two TYK2-deficient patients (P1 and P2), and a patient with complete STAT1 deficiency (STAT1*) were left untreated (−) or were treated with 105 IU/ml IFN-α 18 h before infection with VSV (MOI = 1). Viral load was determined at 48 h and is represented as log10TCID50/ml. (K) SV40-fibroblasts from two healthy controls (C1 and C2), TYK2-deficient patient P2 (P2), and a STAT1-deficient (STAT1*) patient were or were not (−) treated with 105 IU/ml IFN-α 18 h before infection with VSV (MOI = 10) for 6, 8, or 24 h. Viral load was determined at these three time points. (L) HVS–T cells from two healthy controls (C1 and C2), the TYK2-deficient patient P2 (P2), and a STAT1-deficient (STAT1*) patient were or were not (−) treated with 105 IU/ml IFN-α for 18 h before infection with VSV (MOI = 0.01). Viral load was determined at 48 h. All the results shown are representative of at least three independent experiments. All error bars indicate SEM.
Figure 5.
Figure 5.
TYK2-deficient cells display an impaired response to IL-10 family cytokines. (A) The induction of IFIT1 transcription was analyzed by RT-qPCR after the treatment for 2 h with 20 ng/ml IL-29 or IL-28B of EBV–B cells from two healthy controls (C1 and C2), two TYK2-deficient patients (P1 and P2), a patient with complete STAT1 deficiency (STAT1*), and an IL-10R2–deficient patient (IL-10R2*). Results are normalized with respect to GUS levels. Error bars indicate SEM. (B) EMSA was performed with a GAS probe and EBV–B cells from a healthy control (C), TYK2-deficient patients (P1 and P2), and an IL-10R2–deficient patient (IL-10R2*), with (+) and without (−) stimulation with 50 ng/ml IL-10 for 20 min. (C) Western blot of EBV–B cells from a healthy control (C), TYK2-deficient patients (P1, P2, P3, P5, P7, and P8), and an IL-10R2–deficient patient (IL-10R2*) after treatment with 50 ng/ml IL-10 for 15 min, probed with an Ab specific for phosphorylated STAT3 (pSTAT3). An Ab against tubulin was used as a loading control. After analysis by densitometry, a nonsignificant p-value for the two-tailed Student’s t test for the comparison of IL-10–pSTAT3 controls and TYK2-deficient patients (TYK2) was found. (B and C) White lines indicate that intervening lanes were spliced out. (D) Western blot showing the detection of phospho-STAT3 (pSTAT3) in mock-transduced (left) or TYK2-transduced (right) EBV–B cells from a healthy control and P1, P2, P3, and P5, without (−) and with (+) stimulation for 30 min with 50 ng/ml IL-10. (E) SOCS3 induction was analyzed by RT-qPCR after 6 h of treatment with 50 ng/ml IL-10, in EBV–B cells from two healthy controls (C1 and C2), TYK2-deficient patients (P1 and P2), and an IL-10R2–deficient (IL-10R2*) patient. Results are normalized with respect to GUS. The results shown in A–E are representative of at least two independent experiments. (F) Impaired response to IL-10 in the macrophages of P2. The inhibition of TNF production in response to LPS and IL-10 was assessed by ELISA in macrophages from a travel control (C), P2’s relatives (mother, father, and sister), P2, and a patient with AD-HIES (STAT3*). (G and H) Western blots assessing the phosphorylation of STAT3 (pSTAT3) in healthy controls (C1 and C2), a TYK2-deficient patient (P2), an AD-HIES patient (STAT3*), and a patient with complete STAT1 deficiency (STAT1*), with (+) or without (−) LIF (100 ng/ml for 15 min). (G) In SV40-fibroblasts. (H) In primary fibroblasts. (I and J) Total CD4 and CD8 T cells (I) and naive (CCR7+CD45RA+), central memory (CCR7+ CD45RA; cmem), effector memory (CCR7CD45RA; emem), and revertant effector memory (CCR7CD45RA+) T cells in CD4+ (J, left) and CD8+ T cells (J, right) from healthy controls (C) and the TYK2-deficient patients P1, P2 (tested three times), P4 (tested twice), and P5 (TYK2). Mean values for each set of conditions are indicated by solid lines.
Figure 6.
Figure 6.
Divergent responses to IL-6 in the TYK2-deficient patients. (A and B) Western blot of EBV–B cells from a healthy control (C1 and C2), TYK2-deficient patients (P1, P3, P5, P7, and P8), and an AD-HIES patient heterozygous for a STAT3 mutation (WT/S614G; STAT3*) after treatment with 50 ng/ml IL-6 for 20 min, probed with an Ab specific for phosphorylated STAT3 (pSTAT3). After analysis by densitometry, a p-value <0.05 (0.0332) for the two-tailed Student’s t test for the comparison of IL-6–pSTAT3 controls and P1 was found. However, a nonsignificant result was obtained for the comparison of IL-6–pSTAT3 controls and other than P1 TYK2-deficient patients. (C) EMSA with a GAS probe on EBV–B cells from a healthy control (C), TYK2-deficient patients (P1 and P2), a STAT1-deficient patient (STAT1*), and a heterozygous AD-HIES patient (WT/S614G for STAT3; STAT3*), without (−) and with (+) stimulation with 50 ng/ml IL-6 for 20 min. (B and C) White lines indicate intervening lanes were spliced out. (D) Western blot of primary fibroblasts from two healthy controls (C1 and C2), two TYK2-deficient patients (P1 and P2), and a patient with AD-HIES (STAT3*), with (+) or without (−) hIL-6 (30 ng/ml for 30 min) stimulation, probed with an Ab specific for phosphorylated STAT3 (pSTAT3). (A, B, and D) An anti-tubulin Ab was used as a loading control. (E) Western blot of proteins extracted from EBV–B cells from the TYK2-deficient patient P1 stably transduced with mock (P1 Mock) or WT TYK2 (P1 TYK2) retroviral particles. Cells were (+) or were not (−) stimulated with 50 ng/ml IL-6 and/or 3.2 × 10⁴ IU/ml IFN-β for 15 min, as indicated. Abs against TYK2, phosphorylated STAT3 (pSTAT3), STAT3, and tubulin were used. (F) Western blot of proteins extracted from EBV–B cells from the TYK2-deficient patient P1 stably transduced with retroviral particles encoding the scramble shRNA (Scr) or shRNA specifically targeting TYK2 (shRNA1 or 2). Cells were (+) or were not (−) stimulated with 50 ng/ml IL-6 for 20 min. Abs against TYK2, phosphorylated STAT3 (pSTAT3), STAT3, and tubulin were used. All the results shown represent at least two independent experiments. (G) Western blot of EBV–B cells from a control (C) and from P1 and P2, assessing the expression of components of the IL-6 pathway: JAK1, JAK2, gp130, IL-6Ra, and TYK2. (H) Naive and memory (defined as CD45RA) CD4+ T cells from WT controls (n = 5) and TYK2-deficient patients (n = 3; P1, P2, and P4) were purified (>98% purity) by FACS and cultured with TAE beads (anti-CD2/CD3/CD28) for 5 d, and the culture supernatants were then assessed for secretion of the cytokine indicated by cytometric bead assays or ELISA. Error bars indicate SEM.

Similar articles

  • Tyrosine kinase 2 is not limiting human antiviral type III interferon responses.
    Fuchs S, Kaiser-Labusch P, Bank J, Ammann S, Kolb-Kokocinski A, Edelbusch C, Omran H, Ehl S. Fuchs S, et al. Eur J Immunol. 2016 Nov;46(11):2639-2649. doi: 10.1002/eji.201646519. Epub 2016 Oct 5. Eur J Immunol. 2016. PMID: 27615517
  • Compound heterozygous TYK2 mutations underlie primary immunodeficiency with T-cell lymphopenia.
    Nemoto M, Hattori H, Maeda N, Akita N, Muramatsu H, Moritani S, Kawasaki T, Maejima M, Ode H, Hachiya A, Sugiura W, Yokomaku Y, Horibe K, Iwatani Y. Nemoto M, et al. Sci Rep. 2018 May 3;8(1):6956. doi: 10.1038/s41598-018-25260-8. Sci Rep. 2018. PMID: 29725107 Free PMC article.
  • Impaired IL-23-dependent induction of IFN-γ underlies mycobacterial disease in patients with inherited TYK2 deficiency.
    Ogishi M, Arias AA, Yang R, Han JE, Zhang P, Rinchai D, Halpern J, Mulwa J, Keating N, Chrabieh M, Lainé C, Seeleuthner Y, Ramírez-Alejo N, Nekooie-Marnany N, Guennoun A, Muller-Fleckenstein I, Fleckenstein B, Kilic SS, Minegishi Y, Ehl S, Kaiser-Labusch P, Kendir-Demirkol Y, Rozenberg F, Errami A, Zhang SY, Zhang Q, Bohlen J, Philippot Q, Puel A, Jouanguy E, Pourmoghaddas Z, Bakhtiar S, Willasch AM, Horneff G, Llanora G, Shek LP, Chai LYA, Tay SH, Rahimi HH, Mahdaviani SA, Nepesov S, Bousfiha AA, Erdeniz EH, Karbuz A, Marr N, Navarrete C, Adeli M, Hammarstrom L, Abolhassani H, Parvaneh N, Al Muhsen S, Alosaimi MF, Alsohime F, Nourizadeh M, Moin M, Arnaout R, Alshareef S, El-Baghdadi J, Genel F, Sherkat R, Kiykim A, Yücel E, Keles S, Bustamante J, Abel L, Casanova JL, Boisson-Dupuis S. Ogishi M, et al. J Exp Med. 2022 Oct 3;219(10):e20220094. doi: 10.1084/jem.20220094. Epub 2022 Sep 12. J Exp Med. 2022. PMID: 36094518 Free PMC article.
  • Clinical manifestations of hyper IgE syndromes.
    Freeman AF, Holland SM. Freeman AF, et al. Dis Markers. 2010;29(3-4):123-30. doi: 10.3233/DMA-2010-0734. Dis Markers. 2010. PMID: 21178271 Free PMC article. Review.
  • [Hyper-IgE syndromes].
    He YY, Liu B, Xiao XP. He YY, et al. Lin Chuang Er Bi Yan Hou Tou Jing Wai Ke Za Zhi. 2017 Jun 5;31(11):892-896. doi: 10.13201/j.issn.1001-1781.2017.11.019. Lin Chuang Er Bi Yan Hou Tou Jing Wai Ke Za Zhi. 2017. PMID: 29775011 Review. Chinese.

Cited by

References

    1. Altare F., Durandy A., Lammas D., Emile J.F., Lamhamedi S., Le Deist F., Drysdale P., Jouanguy E., Döffinger R., Bernaudin F., et al. . 1998. Impairment of mycobacterial immunity in human interleukin-12 receptor deficiency. Science. 280:1432–1435. 10.1126/science.280.5368.1432 - DOI - PubMed
    1. Altare F., Ensser A., Breiman A., Reichenbach J., Baghdadi J.E., Fischer A., Emile J.F., Gaillard J.L., Meinl E., and Casanova J.L.. 2001. Interleukin-12 receptor β1 deficiency in a patient with abdominal tuberculosis. J. Infect. Dis. 184:231–236. 10.1086/321999 - DOI - PubMed
    1. Beşer O.F., Conde C.D., Kutlu T., Cokuğraş F.C., Boztuğ K., and Erkan T.. 2014. Inflammatory bowel disease with lethal disease course caused by a nonsense mutation in BIRC4 encoding X-linked inhibitor of apoptosis protein (XIAP). J. Pediatr. Gastroenterol. Nutr. In press. - PubMed
    1. Boisson B., Wang C., Pedergnana V., Wu L., Cypowyj S., Rybojad M., Belkadi A., Picard C., Abel L., Fieschi C., et al. . 2013. An ACT1 mutation selectively abolishes interleukin-17 responses in humans with chronic mucocutaneous candidiasis. Immunity. 39:676–686. 10.1016/j.immuni.2013.09.002 - DOI - PMC - PubMed
    1. Boisson-Dupuis S., El Baghdadi J., Parvaneh N., Bousfiha A., Bustamante J., Feinberg J., Samarina A., Grant A.V., Janniere L., El Hafidi N., et al. . 2011. IL-12Rβ1 deficiency in two of fifty children with severe tuberculosis from Iran, Morocco, and Turkey. PLoS ONE. 6:e18524 10.1371/journal.pone.0018524 - DOI - PMC - PubMed

Publication types

MeSH terms

Supplementary concepts