

Peer Coaches to Improve Diabetes Outcomes in Rural Alabama: A Cluster Randomized Trial
- PMID: 26304967
- PMCID: PMC4648138
- DOI: 10.1370/afm.1798
Peer Coaches to Improve Diabetes Outcomes in Rural Alabama: A Cluster Randomized Trial
Abstract
Purpose: It is unclear whether peer coaching is effective in minority populations living with diabetes in hard-to-reach, under-resourced areas such as the rural South. We examined the effect of an innovative peer-coaching intervention plus brief education vs brief education alone on diabetes outcomes.
Methods: This was a community-engaged, cluster-randomized, controlled trial with primary care practices and their surrounding communities serving as clusters. The trial enrolled 424 participants, with 360 completing baseline and follow-up data collection (84.9% retention). The primary outcomes were change in glycated hemoglobin (HbA1c), systolic blood pressure (BP), low density lipoprotein cholesterol (LDL-C), body mass index (BMI), and quality of life, with diabetes distress and patient activation as secondary outcomes. Peer coaches were trained for 2 days in community settings; the training emphasized motivational interviewing skills, diabetes basics, and goal setting. All participants received a 1-hour diabetes education class and a personalized diabetes report card at baseline. Intervention arm participants were also paired with peer coaches; the protocol called for telephone interactions weekly for the first 8 weeks, then monthly for a total of 10 months.
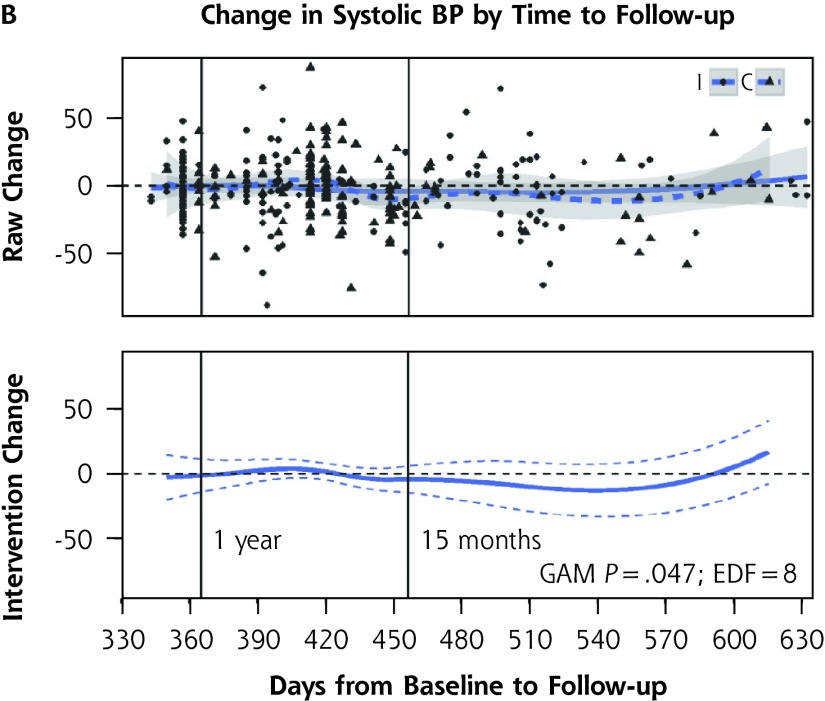
Results: Due to real-world constraints, follow-up was protracted, and intervention effects varied over time. The analysis that included the 68% of participants followed up by 15 months showed only a significant increase in patient activation in the intervention group. The analysis that included all participants who eventually completed follow-up revealed that intervention arm participants had significant differences in changes in systolic BP (P = .047), BMI (P = .02), quality of life (P = .003), diabetes distress (P = .004), and patient activation (P = .03), but not in HbA1c (P = .14) or LDL-C (P = .97).
Conclusion: Telephone-delivered peer coaching holds promise to improve health for individuals with diabetes living in under-resourced areas.
Keywords: Peer health coaching; diabetes; primary care; self-management support.
© 2015 Annals of Family Medicine, Inc.
Figures


Similar articles
-
The effectiveness of peer health coaching in improving glycemic control among low-income patients with diabetes: protocol for a randomized controlled trial.BMC Public Health. 2011 Apr 1;11:208. doi: 10.1186/1471-2458-11-208. BMC Public Health. 2011. PMID: 21457567 Free PMC article. Clinical Trial.
-
Peer-Led, Empowerment-Based Approach to Self-Management Efforts in Diabetes (PLEASED): A Randomized Controlled Trial in an African American Community.Ann Fam Med. 2015 Aug;13 Suppl 1(Suppl 1):S27-35. doi: 10.1370/afm.1819. Ann Fam Med. 2015. PMID: 26304969 Free PMC article. Clinical Trial.
-
Management of type 2 diabetes in China: the Happy Life Club, a pragmatic cluster randomised controlled trial using health coaches.BMJ Open. 2016 Mar 4;6(3):e009319. doi: 10.1136/bmjopen-2015-009319. BMJ Open. 2016. PMID: 26944692 Free PMC article. Clinical Trial.
-
Testing a Coaching Program to Help Adults with Diabetes Living in Rural Alabama Take Their Medicine as Directed [Internet].Washington (DC): Patient-Centered Outcomes Research Institute (PCORI); 2020 Nov. Washington (DC): Patient-Centered Outcomes Research Institute (PCORI); 2020 Nov. PMID: 37579036 Free Books & Documents. Review.
-
Peer Support Interventions for Adults With Diabetes: A Meta-Analysis of Hemoglobin A1c Outcomes.Ann Fam Med. 2016 Nov;14(6):540-551. doi: 10.1370/afm.1982. Ann Fam Med. 2016. PMID: 28376441 Free PMC article. Review.
Cited by
-
The design and rationale of a multicenter real-world trial: The Southeastern Collaboration to Improve Blood Pressure Control in the US Black Belt - Addressing the Triple Threat.Contemp Clin Trials. 2023 Jun;129:107183. doi: 10.1016/j.cct.2023.107183. Epub 2023 Apr 13. Contemp Clin Trials. 2023. PMID: 37061162 Free PMC article. Clinical Trial.
-
Impact of a community-based approach to patient engagement in rural, low-income adults with type 2 diabetes.Public Health Nurs. 2020 Mar;37(2):178-187. doi: 10.1111/phn.12693. Epub 2019 Dec 13. Public Health Nurs. 2020. PMID: 31833102 Free PMC article. Clinical Trial.
-
Current evidence for designing self-management support for underserved populations: an integrative review using the example of diabetes.Int J Equity Health. 2023 Sep 11;22(1):188. doi: 10.1186/s12939-023-01976-6. Int J Equity Health. 2023. PMID: 37697302 Free PMC article. Review.
-
Virtual Group Pulmonary Rehabilitation in COPD Facilitated by a Peer Coach.Respir Care. 2023 Oct;68(10):1426-1429. doi: 10.4187/respcare.10517. Epub 2023 Jun 6. Respir Care. 2023. PMID: 37280075 Free PMC article. No abstract available.
-
Peer coach delivered storytelling program for diabetes medication adherence: Intervention development and process outcomes.Contemp Clin Trials Commun. 2020 Sep 18;20:100653. doi: 10.1016/j.conctc.2020.100653. eCollection 2020 Dec. Contemp Clin Trials Commun. 2020. PMID: 33024882 Free PMC article.
References
-
- Tullos A. The Black Belt. Southern Spaces. 2004. http://www.southernspaces.org/2004/black-belt. Published Apr 19, 2004 Accessed Apr 22, 2015.
-
- State & County Quick Facts. 2014. http://quickfacts.census.gov/qfd/states/01000.html Accessed Dec 1, 2014.
-
- Alabama Poverty Rate by County. 2014. http://www.indexmundi.com/facts/united-states/quick-facts/alabama/percen... Accessed Dec 1, 2014.
-
- Primary Care Physicians by Field. State Health Facts. 2014. http://kff.org/other/stateindicator/primary-care-physicians-by-field/ Accessed Dec 1, 2014.
Publication types
MeSH terms
Substances
Grants and funding
LinkOut - more resources
Full Text Sources
Other Literature Sources
Medical