

Systems Genetics Reveals the Functional Context of PCOS Loci and Identifies Genetic and Molecular Mechanisms of Disease Heterogeneity
- PMID: 26305227
- PMCID: PMC4549292
- DOI: 10.1371/journal.pgen.1005455
Systems Genetics Reveals the Functional Context of PCOS Loci and Identifies Genetic and Molecular Mechanisms of Disease Heterogeneity
Abstract
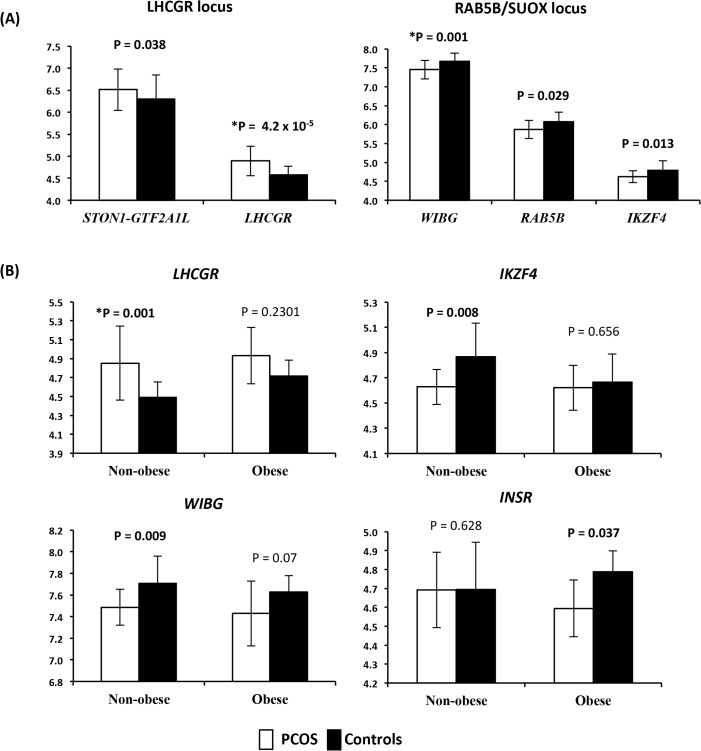
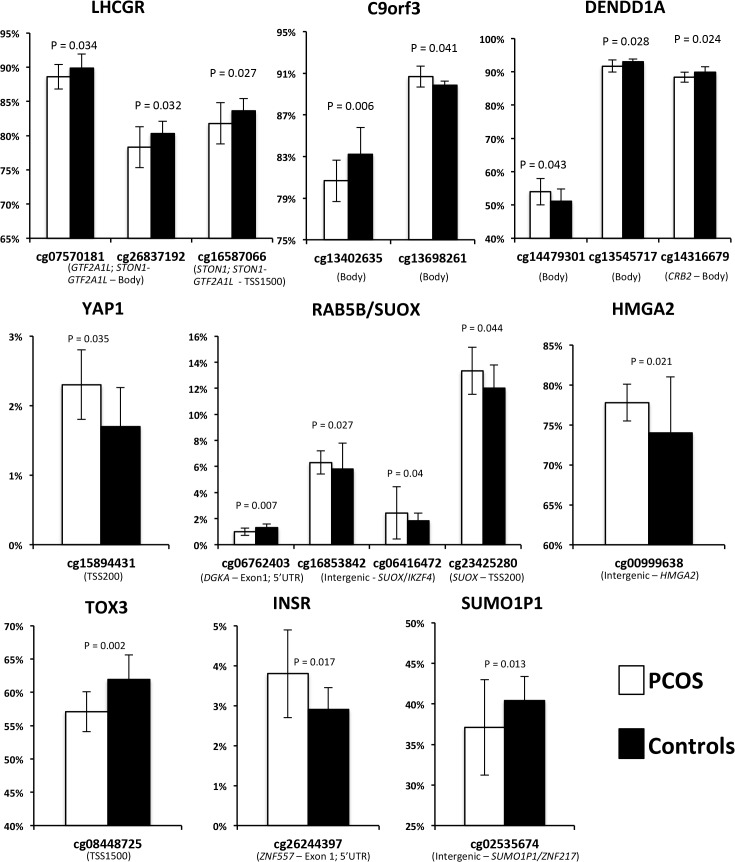
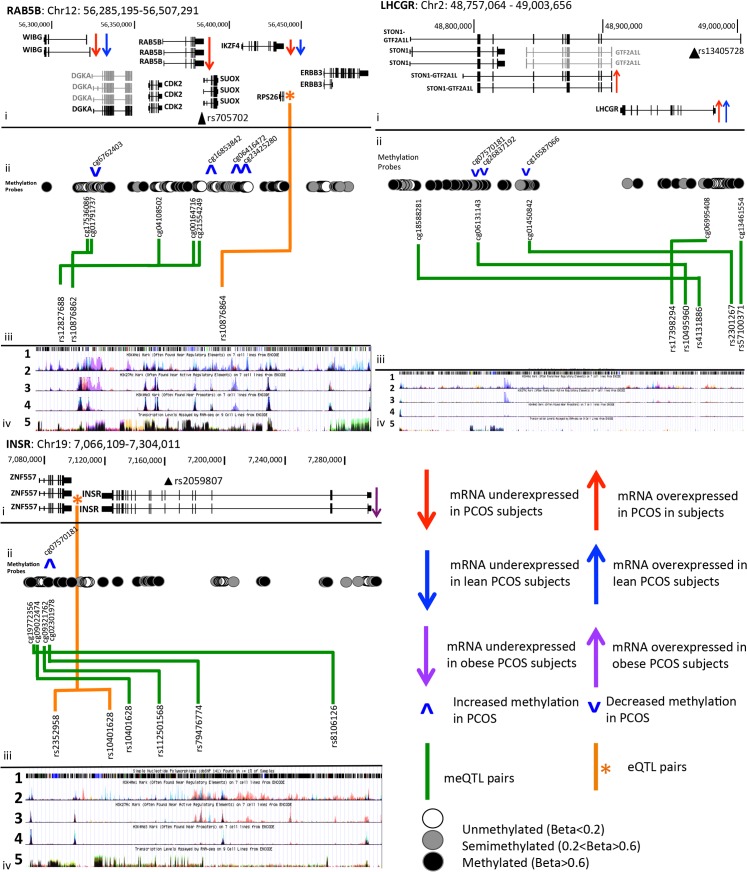
Genome wide association studies (GWAS) have revealed 11 independent risk loci for polycystic ovary syndrome (PCOS), a common disorder in young women characterized by androgen excess and oligomenorrhea. To put these risk loci and the single nucleotide polymorphisms (SNPs) therein into functional context, we measured DNA methylation and gene expression in subcutaneous adipose tissue biopsies to identify PCOS-specific alterations. Two genes from the LHCGR region, STON1-GTF2A1L and LHCGR, were overexpressed in PCOS. In analysis stratified by obesity, LHCGR was overexpressed only in non-obese PCOS women. Although not differentially expressed in the entire PCOS group, INSR was underexpressed in obese PCOS subjects only. Alterations in gene expression in the LHCGR, RAB5B and INSR regions suggest that SNPs in these loci may be functional and could affect gene expression directly or indirectly via epigenetic alterations. We identified reduced methylation in the LHCGR locus and increased methylation in the INSR locus, changes that are concordant with the altered gene expression profiles. Complex patterns of meQTL and eQTL were identified in these loci, suggesting that local genetic variation plays an important role in gene regulation. We propose that non-obese PCOS women possess significant alterations in LH receptor expression, which drives excess androgen secretion from the ovary. Alternatively, obese women with PCOS possess alterations in insulin receptor expression, with underexpression in metabolic tissues and overexpression in the ovary, resulting in peripheral insulin resistance and excess ovarian androgen production. These studies provide a genetic and molecular basis for the reported clinical heterogeneity of PCOS.
Conflict of interest statement
The authors have declared that no competing interests exist.
Figures
References
-
- Salley KE, Wickham EP, Cheang KI, Essah PA, Karjane NW, Nestler JE. Glucose intolerance in polycystic ovary syndrome—a position statement of the Androgen Excess Society. J Clin Endocrinol Metab. 2007;92(12):4546–56. - PubMed
-
- Vink JM, Sadrzadeh S, Lambalk CB, Boomsma DI. Heritability of polycystic ovary syndrome in a Dutch twin-family study. J Clin Endocrinol Metab. 2006;91(6):2100–4. - PubMed
Publication types
MeSH terms
Grants and funding
LinkOut - more resources
Full Text Sources
Other Literature Sources
Medical
Miscellaneous
