. 2015 Sep 9;137(35):11303-11.
doi: 10.1021/jacs.5b04366. Epub 2015 Aug 25.

Fluorescence Turn-On Folding Sensor To Monitor Proteome Stress in Live Cells

Affiliations

Fluorescence Turn-On Folding Sensor To Monitor Proteome Stress in Live Cells

Yu Liu et al. J Am Chem Soc. .

Abstract

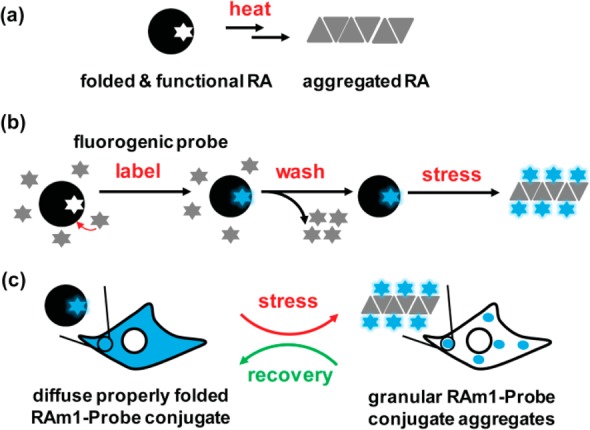
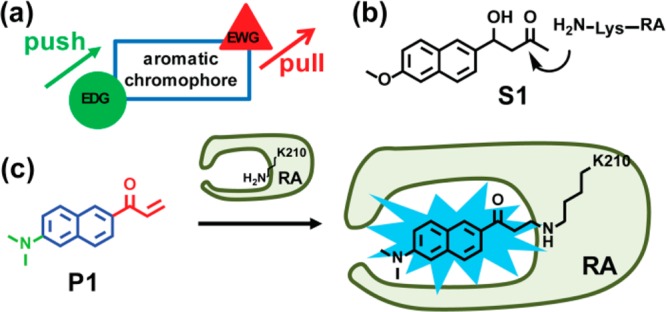
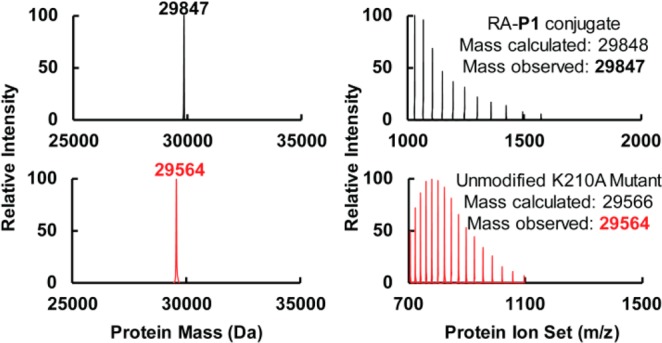
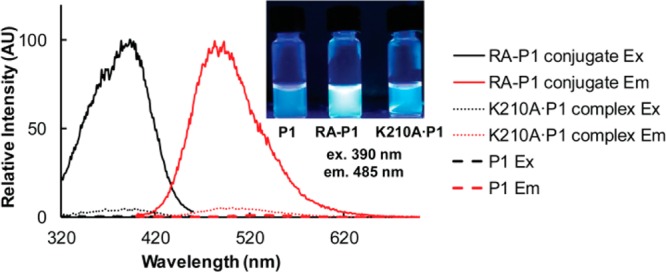
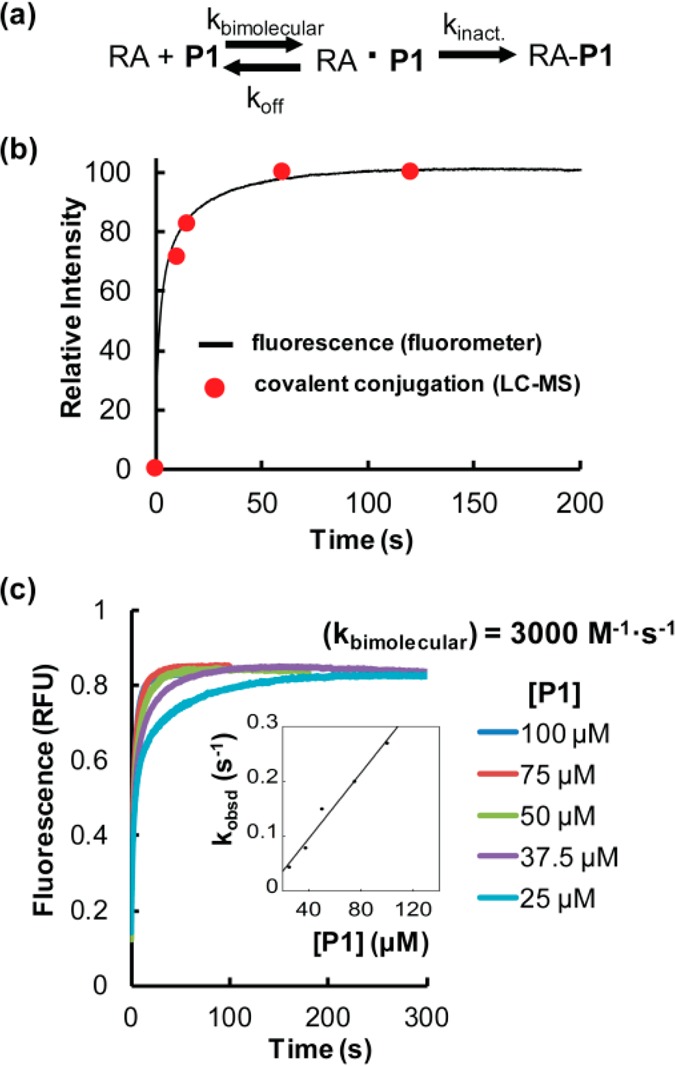
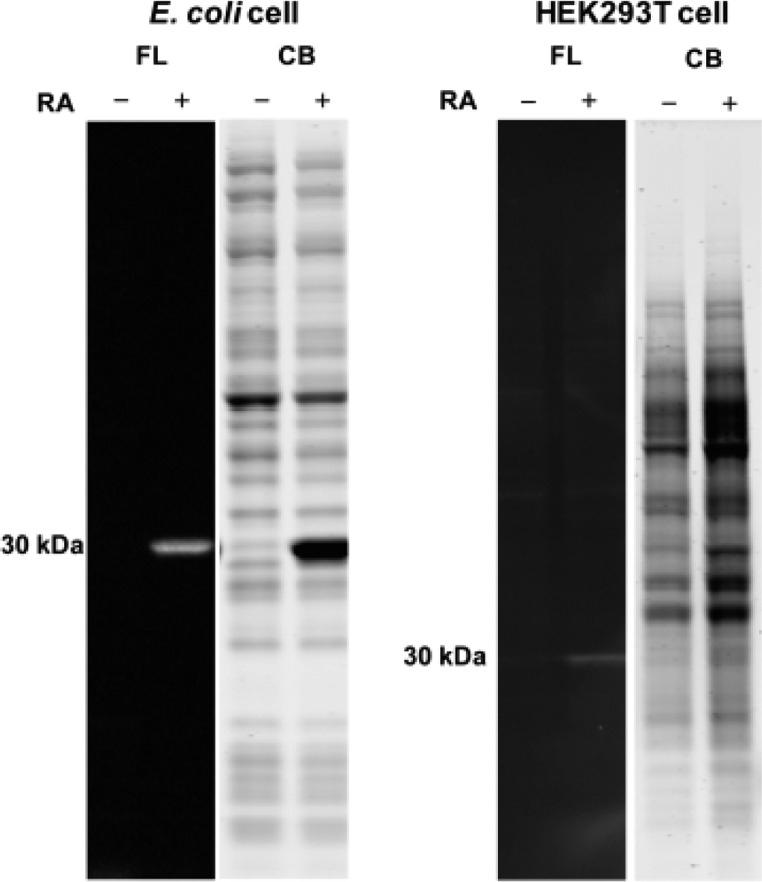
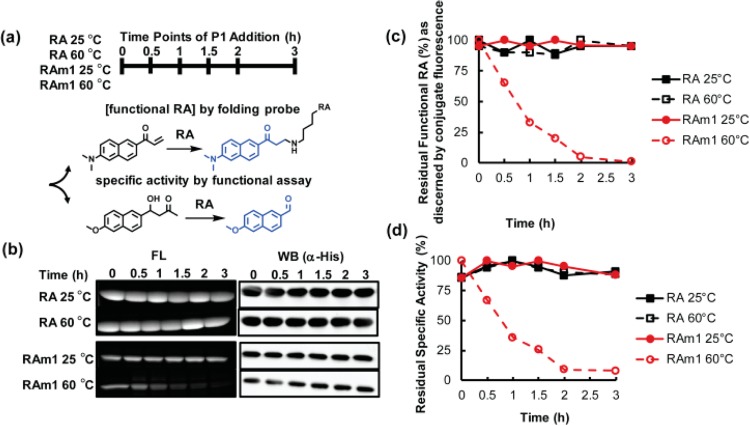
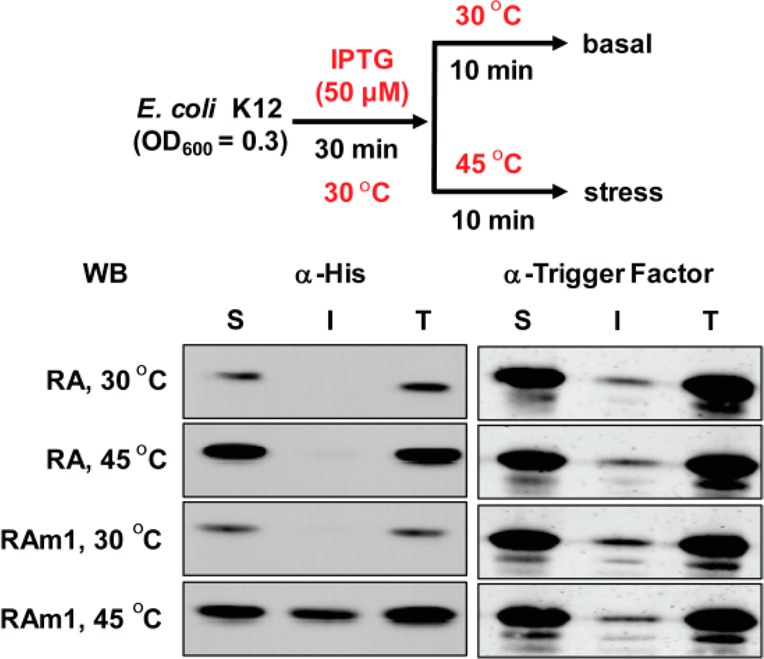
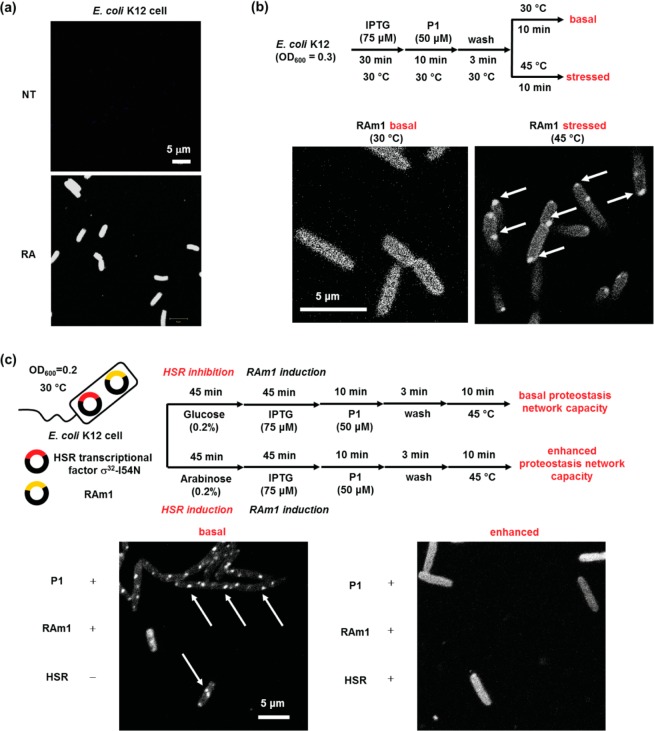
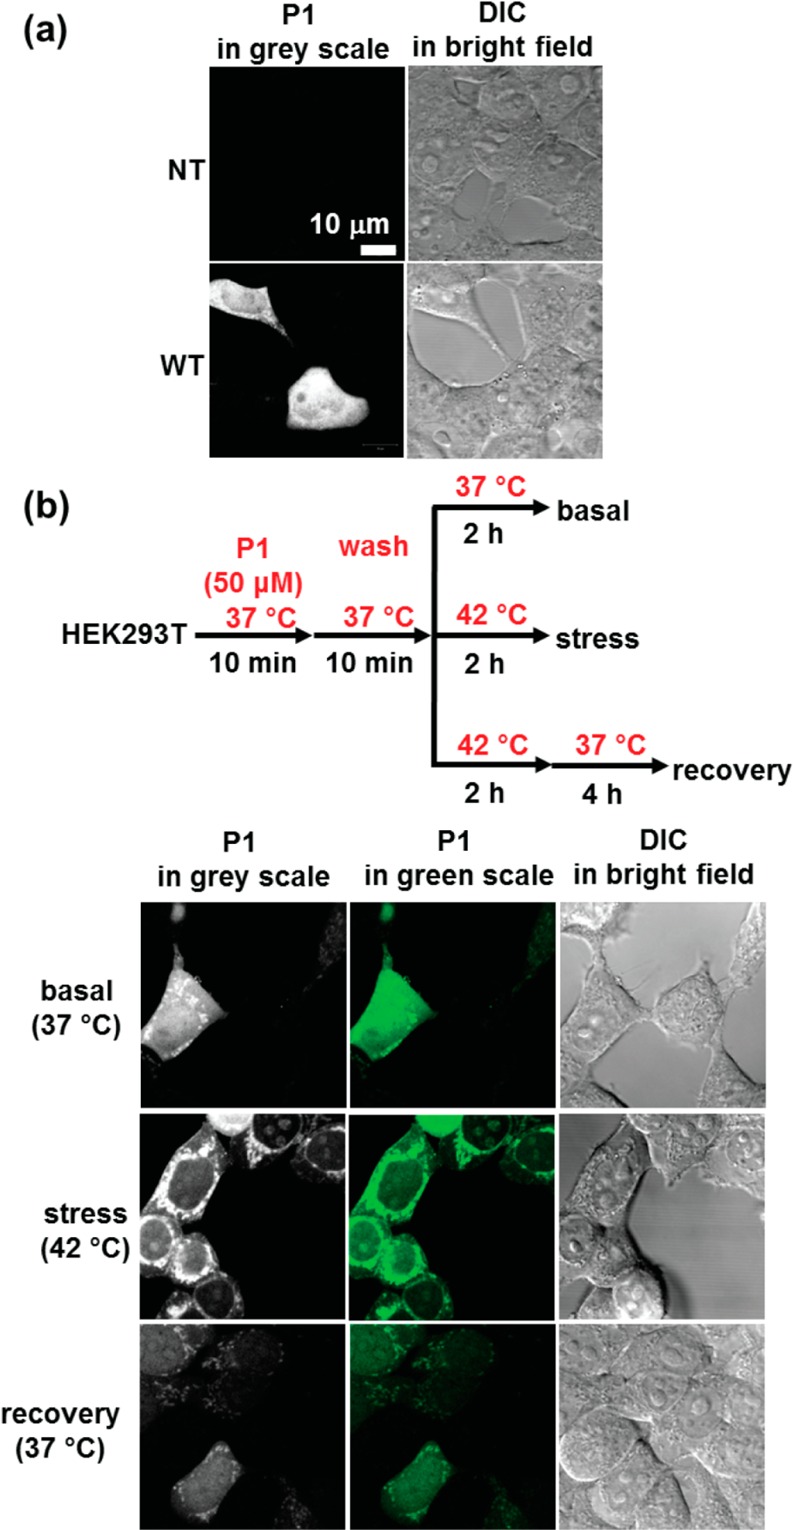
Proteome misfolding and/or aggregation, caused by a thermal perturbation or a related stress, transiently challenges the cellular protein homeostasis (proteostasis) network capacity of cells by consuming chaperone/chaperonin pathway and degradation pathway capacity. Developing protein client-based probes to quantify the cellular proteostasis network capacity in real time is highly desirable. Herein we introduce a small-molecule-regulated fluorescent protein folding sensor based on a thermo-labile mutant of the de novo designed retroaldolase (RA) enzyme. Since RA enzyme activity is not present in any cell, the protein folding sensor is bioorthogonal. The fluorogenic small molecule was designed to become fluorescent when it binds to and covalently reacts with folded and functional RA. Thus, in the first experimental paradigm, cellular proteostasis network capacity and its dynamics are reflected by RA-small molecule conjugate fluorescence, which correlates with the amount of folded and functional RA present, provided that pharmacologic chaperoning is minimized. In the second experimental scenario, the RA-fluorogenic probe conjugate is pre-formed in a cell by simply adding the fluorogenic probe to the cell culture media. Unreacted probe is then washed away before a proteome misfolding stress is applied in a pulse-chase-type experiment. Insufficient proteostasis network capacity is reflected by aggregate formation of the fluorescent RA-fluorogenic probe conjugate. Removal of the stress results in apparent RA-fluorogenic probe conjugate re-folding, mediated in part by the heat-shock response transcriptional program augmenting cytosolic proteostasis network capacity, and in part by time-dependent RA-fluorogenic probe conjugate degradation by cellular proteolysis.


Conflict of interest statement

The authors declare no competing financial interest.

Figures

Figure 1
Figure 1
A cellular metastable client protein acts as a proteostasis network capacity sensor. (a) Under physiological conditions, a thermo-labile de novo designed retroaldolase (RA) will be largely folded and functional in the absence of stress, but upon heating, will form aggregates that consume proteostasis network capacity. (b) Folded and functional RA is labeled by a fluorogenic small-molecule probe, rendering the covalent conjugate fluorescent. Conjugate fluorescence is retained upon aggregation due to the covalent modification and the chromophore utilized. (c) The preformed RAm1-P1 conjugate can undergo misfolding and aggregation into a granular state upon application of a stress, serving as a sensor of cellular proteostasis network capacity.
Figure 2
Figure 2
Structure-based design of a fluorogenic probe for folded and functional RA. (a) Schematic of a push–pull environmentally sensitive fluorophore. EWG = electron-withdrawing group. EDG = electron-donating group. (b) Structure of the retroaldol substrate S1 utilized by the de novo designed RA enzyme. RA catalyzes a retroaldol reaction using the pKa-perturbed lysine-210 ε-amine side chain that forms a Schiff base with S1. (c) P1 is a push–pull environmentally sensitive fluorophore featuring a reactive vinyl ketone (in red) that also serves as an EWG. The dimethyl amino group (in green) serves as an EDG. P1 covalently modifies the pKa-perturbed lysine-210 residue of RA through 1,4-conjugate addition, rendering the RA-P1 covalent conjugate fluorescent.
Figure 3
Figure 3
P1 labels the active site Lys-210 ε-amino group of RA chemoselectively. P1 (50 μM) completely labeled RA (5 μM) within 5 min at 25 °C, as shown by LC-ESI-MS. The conjugate mass was observed at 29 847 Da (apo-RA, 29 623 Da; P1, 225 Da) (top panels). Mutation of the active site Lys-210 residue to alanine eliminated the covalent labeling of RA by P1. The unmodified RA K210A mutant mass was observed at 29 564 Da (bottom panels).
Figure 4
Figure 4
P1 is fluorogenic upon binding and reacting with RA to form a covalent conjugate. P1 (5 μM) was incubated with RA (5 μM) or the K210A RA mutant (5 μM) for 24 h in buffer at 25 °C resulting in complete covalent modification of RA, but not the K210A mutant which forms a non-covalent K210A RA·P1 complex. P1 (5 μM) is dark in buffer and is only very weakly fluorescent when bound to the K210A RA mutant. In contrast, P1 is strongly fluorescent upon forming a covalent conjugate with RA. Excitation and emission spectra were recorded using an Aviv fluorescence spectrometer. Samples in the inset were photographed under illumination with a hand-held UV lamp.
Figure 5
Figure 5
The folded and functional RA-P1 conjugate is fluorescent. (a) RA and P1 conjugation is modeled to proceed by two steps: P1 first binds reversibly to RA. Then the RA1·P1 complex undergoes a reaction to form the fluorescent conjugate. (b) RA (5 μM) was incubated with P1 (50 μM) at 25 °C. The fraction of covalent modification by LC-ESI-MS (red filled circles) correlates with the emergence of fluorescence (black curve) measured by stopped-flow fluorometry using an excitation wavelength of 390 nm and emission wavelength of 485 nm. The extent of covalent modification (second step; red filled circles) was monitored by taking samples from the reaction mixture at the indicated time points, quenching the reaction by acidification with hydrochloric acid, and measuring the relative peak intensity by LC-ESI-MS. (c) Measurement of the bimolecular association rate constant between RA (5 μM) and P1 by stopped-flow fluorometry as a function of the concentration of P1 (indicated).
Figure 6
Figure 6
Selectivity of P1 in E. coli or HEK293T cell lysate lacking or overexpressing RA. Lysates (3 mg/mL) obtained by sonication were incubated with P1 (10 μM) for 10 min at 25 °C. The samples were fractionated on an SDS-PAGE gel and visualized by either a Bio-Rad Gel Doc Imager employing UV illumination to see the conjugate fluorescence signal or bright field light to observe the Coomassie staining. No significant off-target bands were observed in lysates of cells lacking or expressing RA. FL = RA-P1 conjugate-associated fluorescence, CB = Coomassie blue.
Figure 7
Figure 7
Loss of function in an ATP-depleted cell lysate upon increasing the temperature to 60 °C occurs in the case of thermo-labile mutant RAm1, but not for RA. (a) Experimental scheme: E. coli lysates expressing RA or RAm1 and depleted of ATP were incubated at 25 or 60 °C. (b,c) At the indicated time points, the concentration of functional RA was measured in the lysate by adding an excess of folding probe P1 (100 μM, 1 h incubation at 25 °C) and then the samples were subjected to SDS-PAGE (a scenario 1 experiment). Gels were directly visualized using a Bio-Rad Gel Doc Imager employing UV illumination to quantify the fluorescence of the conjugate. (d) Using another aliquot, the specific activity of RA and RAm1 were measured by the functional assay at the time points indicated (described in Supporting Information, Experimental Section, part (3)). Only the concentration of folded and functional RAm1 decreased upon application of a thermal stress, whereas RA was resistant to heat denaturation. FL = RA/RAm1-P1 conjugate fluorescence, WB = Western immunoblot.
Figure 8
Figure 8
RAm1 is a sensor of proteostasis network capacity inside living E. coli cells using solubility as an indicator. After the application of a thermal stress that leads to proteome misfolding and aggregation, RAm1 partitioned into an insoluble state in living E. coli cells after 10 min of a heat stress at 45 °C, as revealed by centrifugation followed by an SDS-PAGE gel visualized by immunoblotting. S = soluble fraction, I = insoluble fraction, T = total protein. Trigger factor was used as a loading control.
Figure 9
Figure 9
The RAm1-P1 fluorescent conjugate is a cellular client-based thermo-labile sensor of proteostasis network capacity in E. coli. (a) P1 selectively binds to and reacts with RA in E. coli affording the RAm1-P1 conjugate. Thus, only cells transformed with RA exhibit conjugate fluorescence in the confocal image. (b) The pre-formed RAm1-P1 conjugate formed granular aggregate structures as observed by confocal fluorescence imaging (white arrows) after heating at 45 °C for 10 min, serving as a sensor of proteostasis network capacity insufficiency. (c) Transcriptional reprogramming of E. coli by over-expressing the σ32-I54N heat shock response transcription factor enhances the proteostasis network capacity of the cytosol, protecting the preformed RAm1-P1 conjugate from aggregating upon application of thermal stress. This is reflected by the lack of granular structures in rightmost confocal image in comparison to the image on the left where aggregation is observed because cytosolic proteostasis network capacity was not preemptively enhanced. Sample preparation and imaging details are described in the Supporting Information, Experimental Section. NT = non-transformed. Images were taken using a Zeiss LSM710 confocal microscope.
Figure 10
Figure 10
The RAm1-P1 fluorescent conjugate is a cellular client-based thermo-labile cellular proteostasis network capacity sensor in HEK293T cells. (a) P1 selectively binds to and reacts with RA and exhibits fluorescence only in HEK293T cells transfected with RA, as discerned from the confocal fluorescence images. (b) The confocal fluorescence images show that the pre-formed RAm1-P1 conjugate retained predominant solubility at 37 °C (first row), however aggregates predominated upon heating at 42 °C for 2 h (second row). Notably, reduction of the temperature from 42 °C to 37 °C for 4 h after thermal stress eliminates the RAm1-P1 granular aggregate structures in the cell (third row), presumably as a consequence of the heat shock response transcriptional program-enabled re-folding of RAm1-P1 and partial degradation of the RAm1-P1 conjugate (see main text). NT = non-transfected; WT = wild-type. Images were taken using a Zeiss LSM710 confocal microscope.

References

    1. Anfinsen C. B. Science 1973, 181, 223.10.1126/science.181.4096.223. - DOI - PubMed
    1. Hartl F. U.; Hayer-Hartl M. Nat. Struct. Mol. Biol. 2009, 16, 574.10.1038/nsmb.1591. - DOI - PubMed
    1. Kim Y. E.; Hipp M. S.; Bracher A.; Hayer-Hartl M.; Hartl F. U. Annu. Rev. Biochem. 2013, 82, 323.10.1146/annurev-biochem-060208-092442. - DOI - PubMed
    1. Balch W. E.; Morimoto R. I.; Dillin A.; Kelly J. W. Science 2008, 319, 916.10.1126/science.1141448. - DOI - PubMed
    1. Gidalevitz T.; Ben-Zvi A.; Ho K. H.; Brignull H. R.; Morimoto R. I. Science 2006, 311, 1471.10.1126/science.1124514. - DOI - PubMed

Publication types

LinkOut - more resources