

A compendium of DIS3 mutations and associated transcriptional signatures in plasma cell dyscrasias
- PMID: 26305418
- PMCID: PMC4694891
- DOI: 10.18632/oncotarget.4674
A compendium of DIS3 mutations and associated transcriptional signatures in plasma cell dyscrasias
Abstract
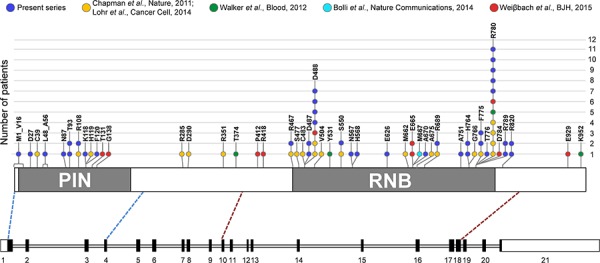
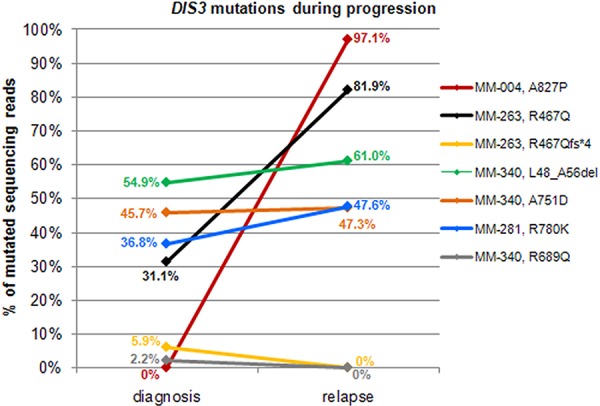
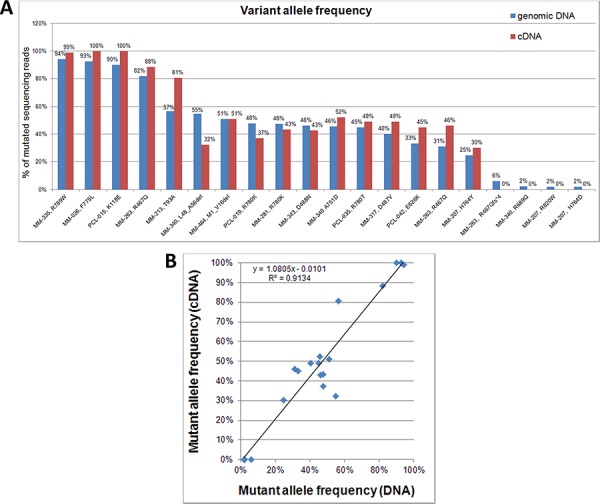
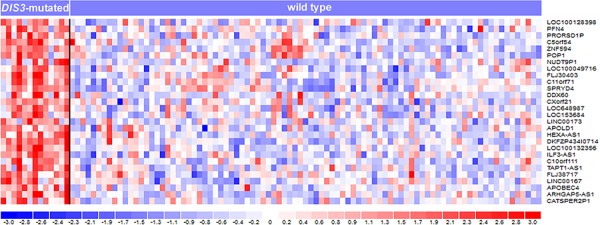
DIS3 is a catalytic subunit of the human exosome complex, containing exonucleolytic (RNB) and endonucleolytic (PIN) domains, recently found mutated in multiple myeloma (MM), a clinically and genetically heterogeneous form of plasma cell (PC) dyscrasia. We analyzed by next-generation sequencing (NGS) the DIS3 PIN and RNB domains in purified bone marrow PCs from 164 representative patients, including 130 cases with MM, 24 with primary PC leukemia and 10 with secondary PC leukemia. DIS3 mutations were found respectively in 18.5%, 25% and 30% of cases. Identified variants were predominantly missense mutations localized in the RNB domain, and were often detected at low allele frequency. DIS3 mutations were preferentially carried by IGH-translocated/nonhyperdiploid patients. Sequential analysis at diagnosis and relapse in a subset of cases highlighted some instances of increasing DIS3 mutation burden during disease progression. NGS also revealed that the majority of DIS3 variants in mutated cases were comparably detectable at transcriptional level. Furthermore, gene expression profiling analysis in DIS3-mutated patients identified a transcriptional signature suggestive for impaired RNA exosome function. In conclusion, these data further support the pathological relevance of DIS3 mutations in plasma cell dyscrasias and suggest that DIS3 may represent a potential tumor suppressor gene in such disorders.
Keywords: DIS3; multiple myeloma; next-generation sequencing; plasma cell leukemia.
Conflict of interest statement
The authors declare that they have no conflict of interest.
Figures
Similar articles
-
DIS3: The Enigmatic Gene in Multiple Myeloma.Int J Mol Sci. 2023 Feb 17;24(4):4079. doi: 10.3390/ijms24044079. Int J Mol Sci. 2023. PMID: 36835493 Free PMC article. Review.
-
The molecular spectrum and clinical impact of DIS3 mutations in multiple myeloma.Br J Haematol. 2015 Apr;169(1):57-70. doi: 10.1111/bjh.13256. Epub 2014 Dec 17. Br J Haematol. 2015. PMID: 25521164 Clinical Trial.
-
Molecular spectrum of TP53 mutations in plasma cell dyscrasias by next generation sequencing: an Italian cohort study and overview of the literature.Oncotarget. 2016 Apr 19;7(16):21353-61. doi: 10.18632/oncotarget.7241. Oncotarget. 2016. PMID: 26870891 Free PMC article.
-
Molecular spectrum of BRAF, NRAS and KRAS gene mutations in plasma cell dyscrasias: implication for MEK-ERK pathway activation.Oncotarget. 2015 Sep 15;6(27):24205-17. doi: 10.18632/oncotarget.4434. Oncotarget. 2015. PMID: 26090869 Free PMC article.
-
The 3' to 5' Exoribonuclease DIS3: From Structure and Mechanisms to Biological Functions and Role in Human Disease.Biomolecules. 2015 Jul 17;5(3):1515-39. doi: 10.3390/biom5031515. Biomolecules. 2015. PMID: 26193331 Free PMC article. Review.
Cited by
-
pyComBat, a Python tool for batch effects correction in high-throughput molecular data using empirical Bayes methods.BMC Bioinformatics. 2023 Dec 7;24(1):459. doi: 10.1186/s12859-023-05578-5. BMC Bioinformatics. 2023. PMID: 38057718 Free PMC article.
-
Distinct and evolutionary conserved structural features of the human nuclear exosome complex.Elife. 2018 Jul 26;7:e38686. doi: 10.7554/eLife.38686. Elife. 2018. PMID: 30047866 Free PMC article.
-
DIS3: The Enigmatic Gene in Multiple Myeloma.Int J Mol Sci. 2023 Feb 17;24(4):4079. doi: 10.3390/ijms24044079. Int J Mol Sci. 2023. PMID: 36835493 Free PMC article. Review.
-
Noncoding RNA processing by DIS3 regulates chromosomal architecture and somatic hypermutation in B cells.Nat Genet. 2021 Feb;53(2):230-242. doi: 10.1038/s41588-020-00772-0. Epub 2021 Feb 1. Nat Genet. 2021. PMID: 33526923 Free PMC article.
-
The RNA Exosome and Human Disease.Methods Mol Biol. 2020;2062:3-33. doi: 10.1007/978-1-4939-9822-7_1. Methods Mol Biol. 2020. PMID: 31768969 Review.
References
-
- Morgan GJ, Walker BA, Davies FE. The genetic architecture of multiple myeloma. Nat Rev Cancer. 2012;12:335–348. - PubMed
Publication types
MeSH terms
Substances
LinkOut - more resources
Full Text Sources
Other Literature Sources
Molecular Biology Databases
