. 2015 Aug 25;10(8):e0136584.
doi: 10.1371/journal.pone.0136584. eCollection 2015.

Inhibition of Calcium-Activated Chloride Channel ANO1/TMEM16A Suppresses Tumor Growth and Invasion in Human Lung Cancer

Affiliations

Inhibition of Calcium-Activated Chloride Channel ANO1/TMEM16A Suppresses Tumor Growth and Invasion in Human Lung Cancer

Linghan Jia et al. PLoS One. .

Abstract

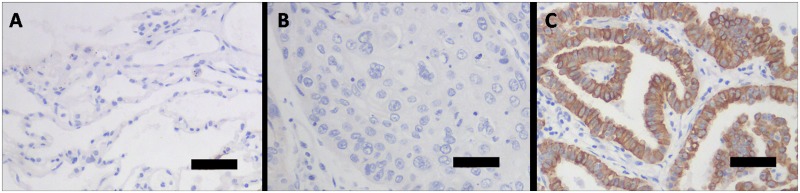
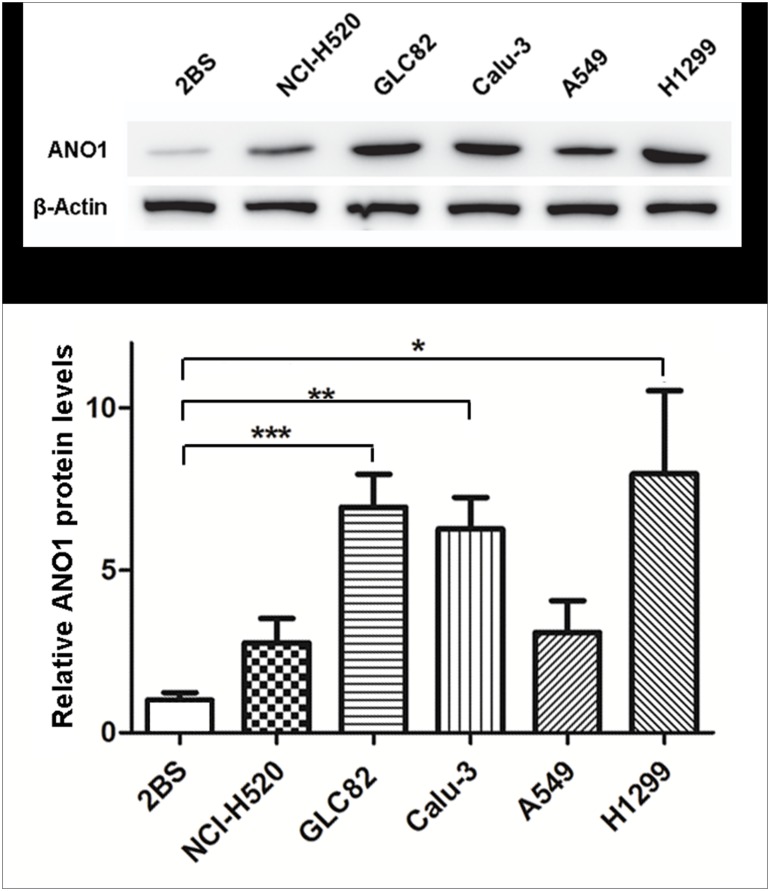
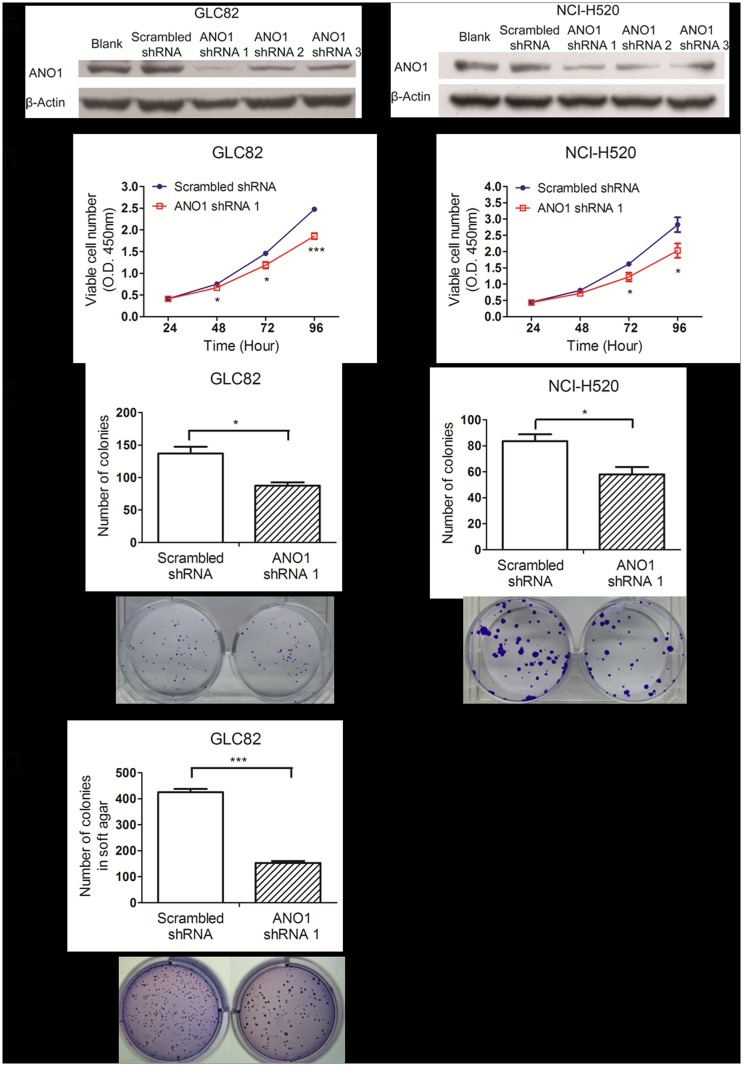
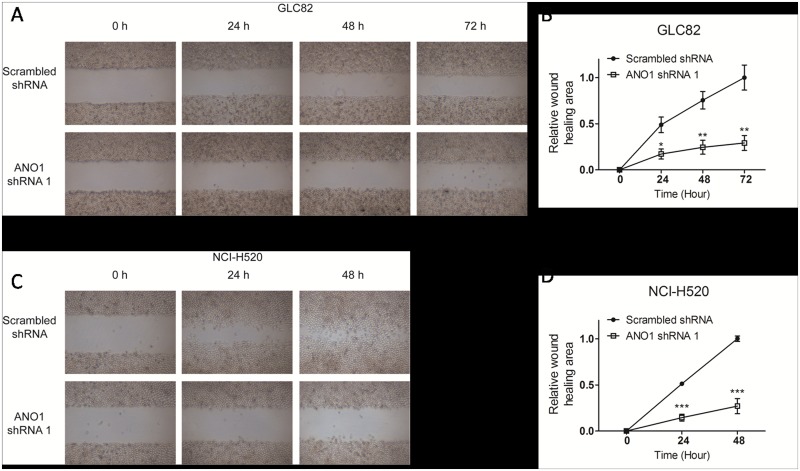
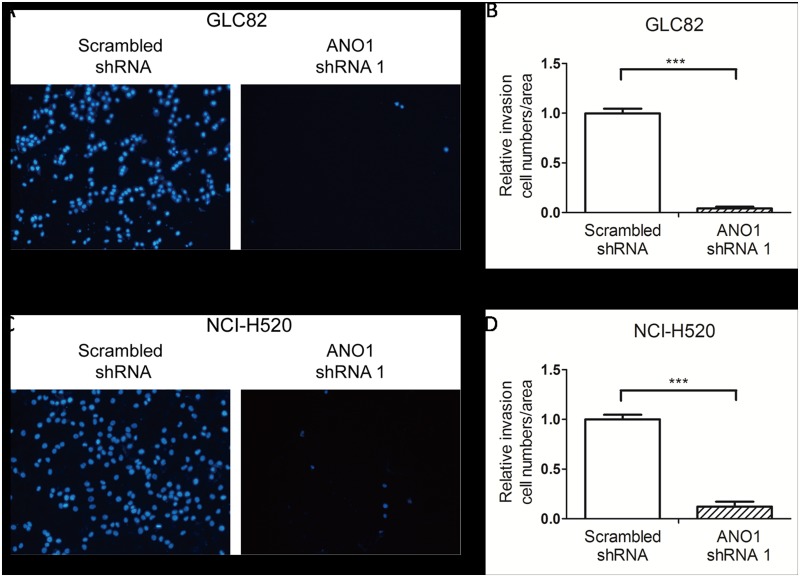
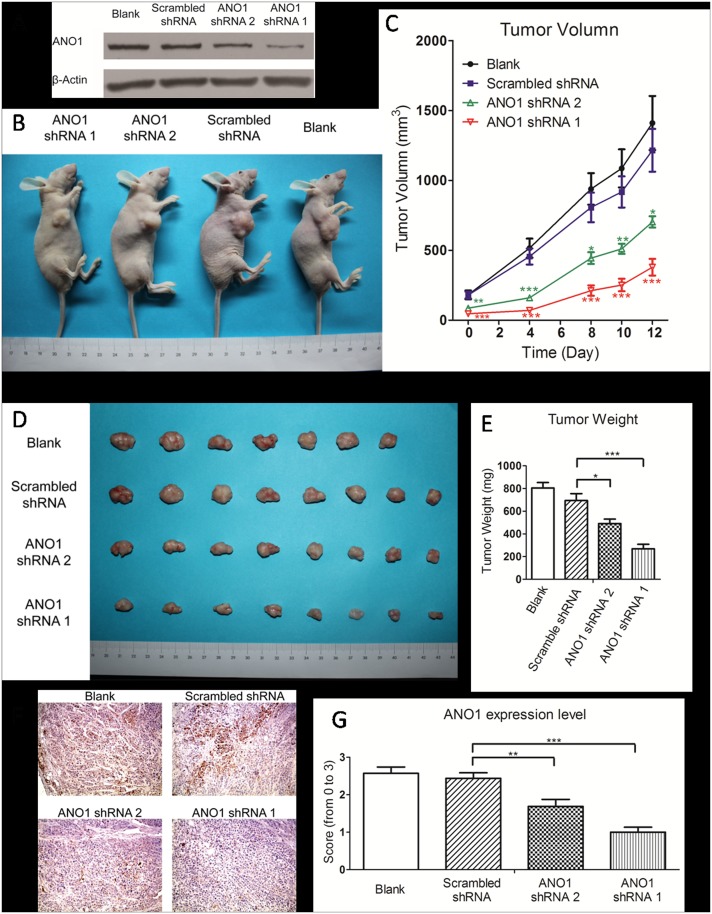
Lung cancer or pulmonary carcinoma is primarily derived from epithelial cells that are thin and line on the alveolar surfaces of the lung for gas exchange. ANO1/TMEM16A, initially identified from airway epithelial cells, is a member of Ca2+-activated Cl- channels (CaCCs) that function to regulate epithelial secretion and cell volume for maintenance of ion and tissue homeostasis. ANO1/TMEM16A has recently been shown to be highly expressed in several epithelium originated carcinomas. However, the role of ANO1 in lung cancer remains unknown. In this study, we show that inhibition of calcium-activated chloride channel ANO1/TMEM16A suppresses tumor growth and invasion in human lung cancer. ANO1 is upregulated in different human lung cancer cell lines. Knocking-down ANO1 by small hairpin RNAs inhibited proliferation, migration and invasion of GLC82 and NCI-H520 cancel cells evaluated by CCK-8, would-healing, transwell and 3D soft agar assays. ANO1 protein is overexpressed in 77.3% cases of human lung adenocarcinoma tissues detected by immunohistochemistry. Furthermore, the tumor growth in nude mice implanted with GLC82 cells was significantly suppressed by ANO1 silencing. Taken together, our findings provide evidence that ANO1 overexpression contributes to tumor growth and invasion of lung cancer; and suppressing ANO1 overexpression may have therapeutic potential in lung cancer therapy.


Conflict of interest statement

Competing Interests: The authors have declared that no competing interests exist.

Figures

Fig 1
Fig 1. Immunohistochemical staining of ANO1 protein expression in human lung tissues of benign alveoli adjacent to carcinoma, squamous cell carcinoma and adenocarcinoma.
(A) Benign alveoli adjacent to carcinoma showing negative ANO1 staining. (B) Squamous cell lung carcinoma showing negative ANO1 staining. (C) Human lung adenocarcinoma cancer tissue showing ANO1 staining (brown color) of neoplastic epithelium. The scale bar indicates 50 μm.
Fig 2
Fig 2. Upregulation of ANO1 expression in human lung cancer cell lines.
Top panel: representative western blot images of ANO1 expression in different lung cell lines. Bottom panel: statistical analysis bar chart (n = 3) of ANO1 relative levels in NCI-H520, GLC82, Calu-3, A549 and H1299 cell lines (compared with normal 2BS cells). The expression of ANO1 was normalized to the expression level of β-Actin. ANO1 is significantly overexpressed in GLC82, Calu-3 and H1299 cell lines. Statistical significance by ANOVA is given as *p< 0.05; **p< 0.01 and ***p< 0.001. All data are shown as mean ± s.e.m.
Fig 3
Fig 3. Inhibition of cell proliferation by ANO1 knockdown.
(A) RNAi knockdown of ANO1 protein expression in ANO1 expressing cells was shown by Western blot images. The membrane proteins extracted from GLC82 and NCI-H520 cells on the 3rd day after transfection of different ANO1 shRNAs (shRNA1, shRNA2 and shRNA3) were immunoblotted with ANO1 antibody. ANO1 shRNA1 showed the most effective inhibition of ANO1 expression, compared with the other two shRNAs and the scrambled shRNA. (B) GLC82 or NCI-H520 cell proliferation was assessed by CCK8 assay based on the extracellular decreasing of WST8 by NADH produced in mitochondria. Using a microplate reader, the number of cells was quantified by the measurement of absorbance at 450 nm. Transfection of ANO1 shRNA1 resulted in significant inhibition of GLC82 and NCI-H529 cell viability in time-dependent manner as compared with cells treated with scrambled shRNA (n = 6). (C) Cell proliferation of carcinoma cells was assessed by the colony formation assay in culture in the presence of ANO1 shRNA1. Quantitative analysis of ANO1 silencing group showed less colony genesis, compared with scrambled shRNA group (n = 3). Representative images are showed below bar charts. (D) RNAi of ANO1 inhibits the clonogenicity of GLC82 cells in soft agar (n = 3). NCI-H520 failed to form colonies in soft agar. Statistical significance by Student’s t-test is indicated as *p< 0.05; **p< 0.01 and ***p< 0.001. Data are expressed as mean ± s.e.m.
Fig 4
Fig 4. Suppression of lung cancer cell migration by ANO1 silencing in wound-healing assay.
Migration of GLC82 and NCI-H520 cells transfected with ANO1 shRNA1 or scrambled shRNA was assessed by wound-healing assay. Two days after transfection, cells were planted in a six-well plate until 90% confluent and then starved for 24 hours. The cell layer was carefully wounded by sterile tips, and incubated with serum free medium. (A) Bright field images of wound at time points 0 h, 24 h, 48 h and 72 h (GLC82) were shown under low magnification. (B) Quantification for the change in wound-healing of GLC82 cells was displayed in line graph and normalized to scrambled shRNA group. (C) Photos of NCI-H520 wound-healing experiment at 0 h, 24 h and 48 h were presented. (D) Line graph of NCI-H520 cells showing cell migration that was inhibited by ANO1 shRNA1 knockdown (n = 3). Statistical significance (Student’s t-test) is indicated as *p< 0.05; **p< 0.01 and ***p< 0.001. All data are shown as mean ± s.e.m.
Fig 5
Fig 5. Inhibition of cell invasion by silencing endogenous ANO1 in transwell assay.
GLC82 and NCI-H520 cells were starved for 24 hours before incubated in the upper chamber with Matrigel transwell filters. After 48 hours (NCI-H520) or 72 hours (GLC82), cells invading into the lower chamber were fixed with methanol and stained with DAPI. (A) Images represent microscopic fields of the invading GLC82 cells. (B) The invasiveness of cells expressing ANO1 shRNA 1 or scrambled shRNA was quantified by stained area of invading GLC82 cells. The invasion area is normalized to scrambled shRNA group. (C) Representative photos of NCI-H520 cells invaded through Matrigel transwell filters. (D) Bar chat of NCI-H520 cells showing the decrease of cell invasion by ANO1 shRNA1 knockdown (n = 3). Statistical significance by Student’s t-test is indicated as *p< 0.05; **p< 0.01 and ***p< 0.001. Data are expressed as mean ± s.e.m.
Fig 6
Fig 6. In vivo suppression of xenograft tumor growth by silencing ANO1.
Normal GLC82 cells or stable GLC82 cells expressing ANO1 shRNA 1, ANO1 shRNA 2 and scrambled shRNA were inoculated hypodermically into the right forelimbs of 5-week-old female nude mice (1X10⁷ cells per mouse). (A) Western analysis of knockdown efficiency for wild type GLC82 cells and GLC82 cells stable expressing scrambled shRNA, ANO1 shRNA 1 and ANO1 shRNA 2. (B) Representative picture of nude mice carrying GLC82 implanted tumors in four groups: blank group (n = 7), scrambled shRNA group (n = 8), ANO1 shRNA1 group (n = 8) and ANO1 shRNA2 group (n = 8). (C) Tumor size was measured every 2–4 days by Vernier caliper during its development since the 7th day after injection. The growth of tumors expressing ANO1 shRNA1 and ANO1 shRNA2 was significantly inhibited in a time dependent manner, compared with the scrambled shRNA group. (D) Representative picture of tumors picked from mice on the 12th day of generation. (E) Tumors were weighed and analyzed after surgical removal. Comparing with scrambled shRNA tumors, ANO1 shRNAs tumors were lighter. Statistical significance (ANOVA) is shown as *p< 0.05; **p< 0.01 and ***p< 0.001. Data are expressed as mean ± s.e.m. (F) Representative images of immunohistochemical staining of ANO1 expression in xenograft tumor tissues. (G) Analysis of ANO1 expression in xenograft tumor tissues was conducted by scoring from 0 to 3 according to the intensity and area of the staining.

References

    1. Detterbeck FC, Boffa DJ, Tanoue LT. The new lung cancer staging system. Chest. 2009;136(1):260–71. Epub 2009/07/09. 10.1378/chest.08-0978 136/1/260 [pii]. - DOI - PubMed
    1. Pedersen SF, Stock C. Ion channels and transporters in cancer: pathophysiology, regulation, and clinical potential. Cancer Res. 2013;73(6):1658–61. Epub 2013/01/11. 10.1158/0008-5472.CAN-12-4188 [pii]. . - DOI - PubMed
    1. Tsavaler L, Shapero MH, Morkowski S, Laus R. Trp-p8, a novel prostate-specific gene, is up-regulated in prostate cancer and other malignancies and shares high homology with transient receptor potential calcium channel proteins. Cancer Res. 2001;61(9):3760–9. Epub 2001/04/28. . - PubMed
    1. Hille B, editor. Ion Channels of Excitable Membranes: Sinauer, 3rd; 2001.
    1. Aryal P, Sansom MS, Tucker SJ. Hydrophobic Gating in Ion Channels. J Mol Biol. 2014. Epub 2014/08/12. S0022-2836(14)00397-0 [pii] 10.1016/j.jmb.2014.07.030 . - DOI - PMC - PubMed

Publication types

MeSH terms