. 2015 Aug 25;10(8):e0136563.
doi: 10.1371/journal.pone.0136563. eCollection 2015.

Evidence Suggesting a Role of Iron in a Mouse Model of Nephrogenic Systemic Fibrosis

Affiliations

Evidence Suggesting a Role of Iron in a Mouse Model of Nephrogenic Systemic Fibrosis

Chhanda Bose et al. PLoS One. .

Abstract

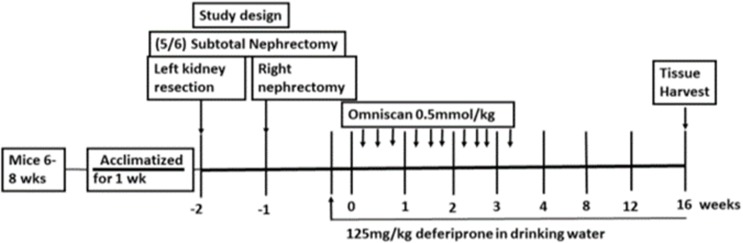
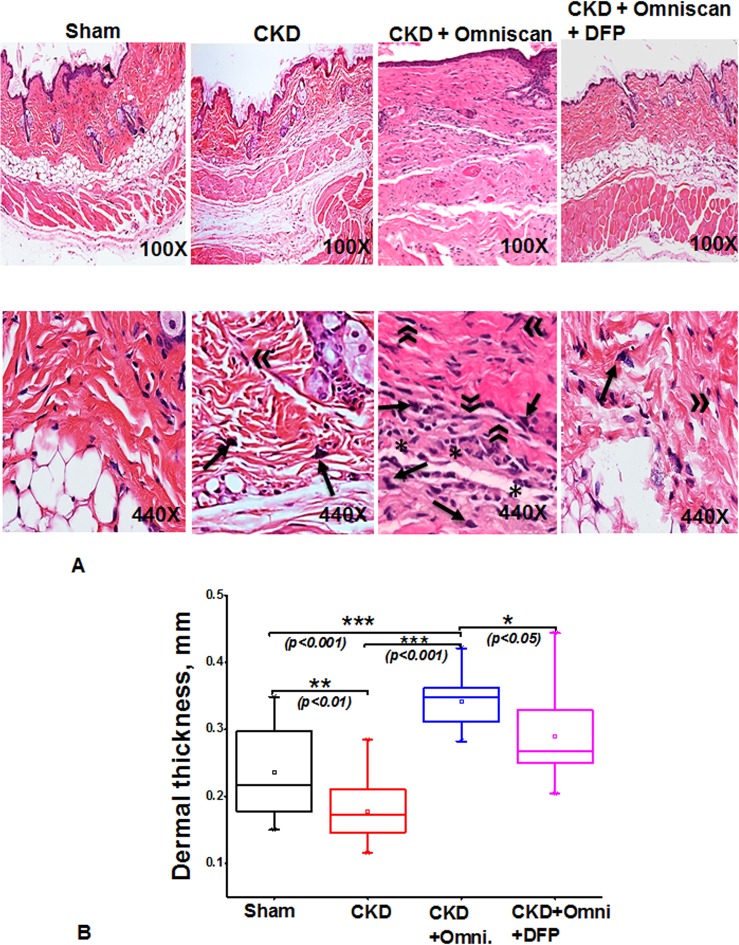
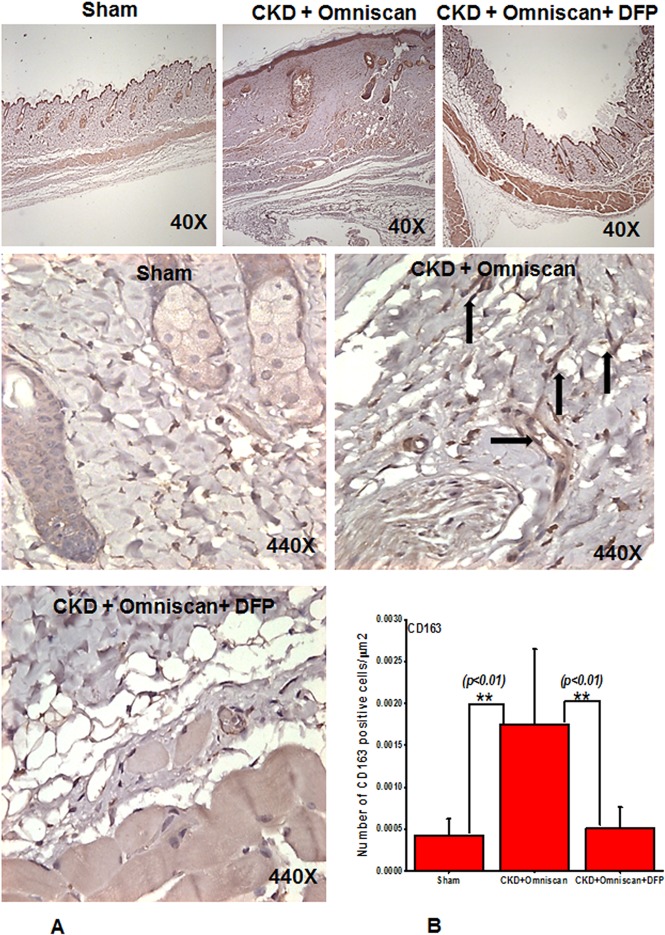
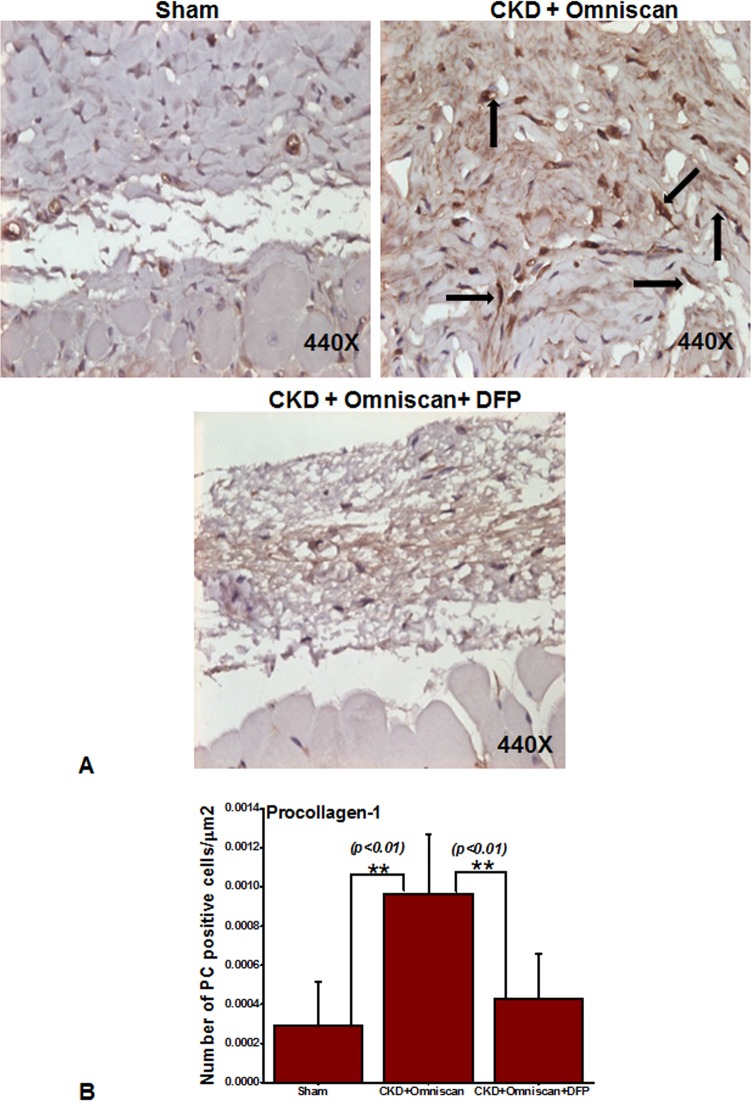
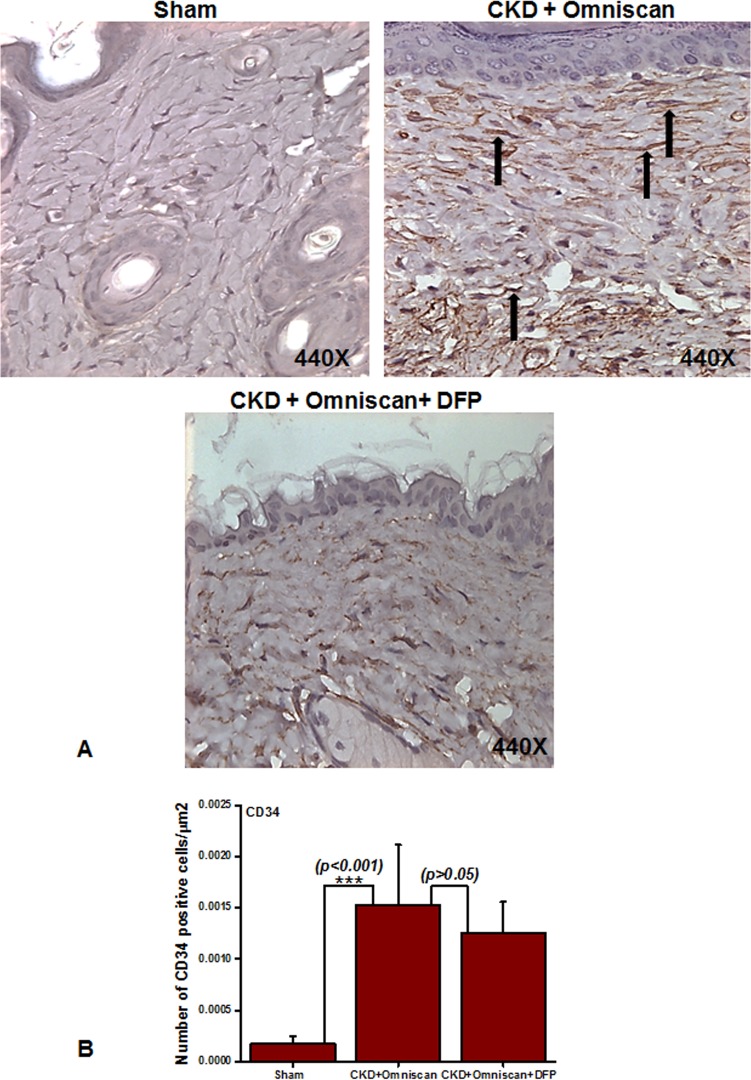
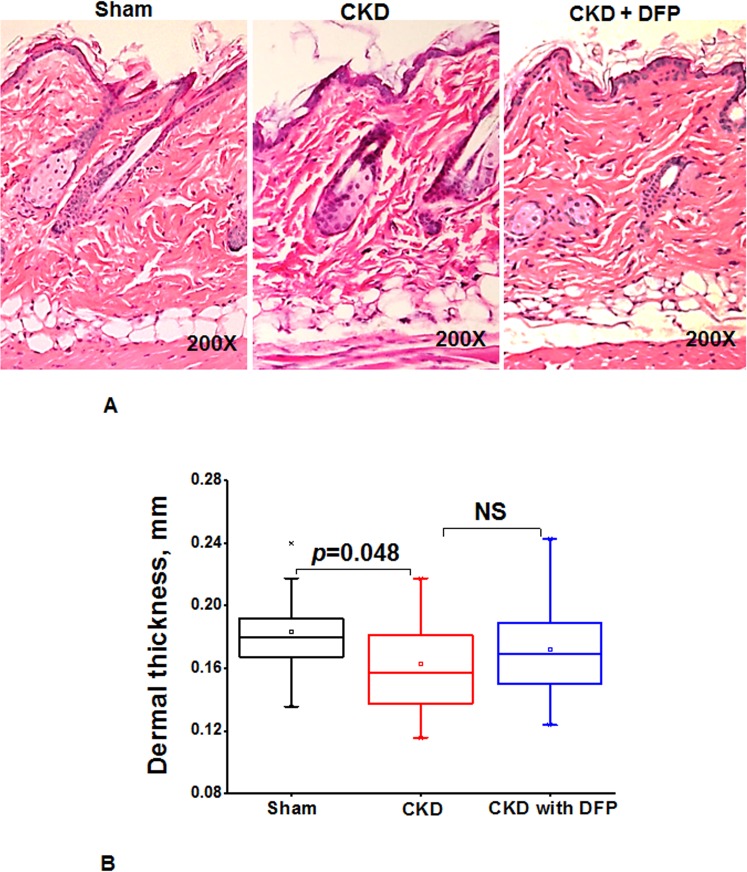
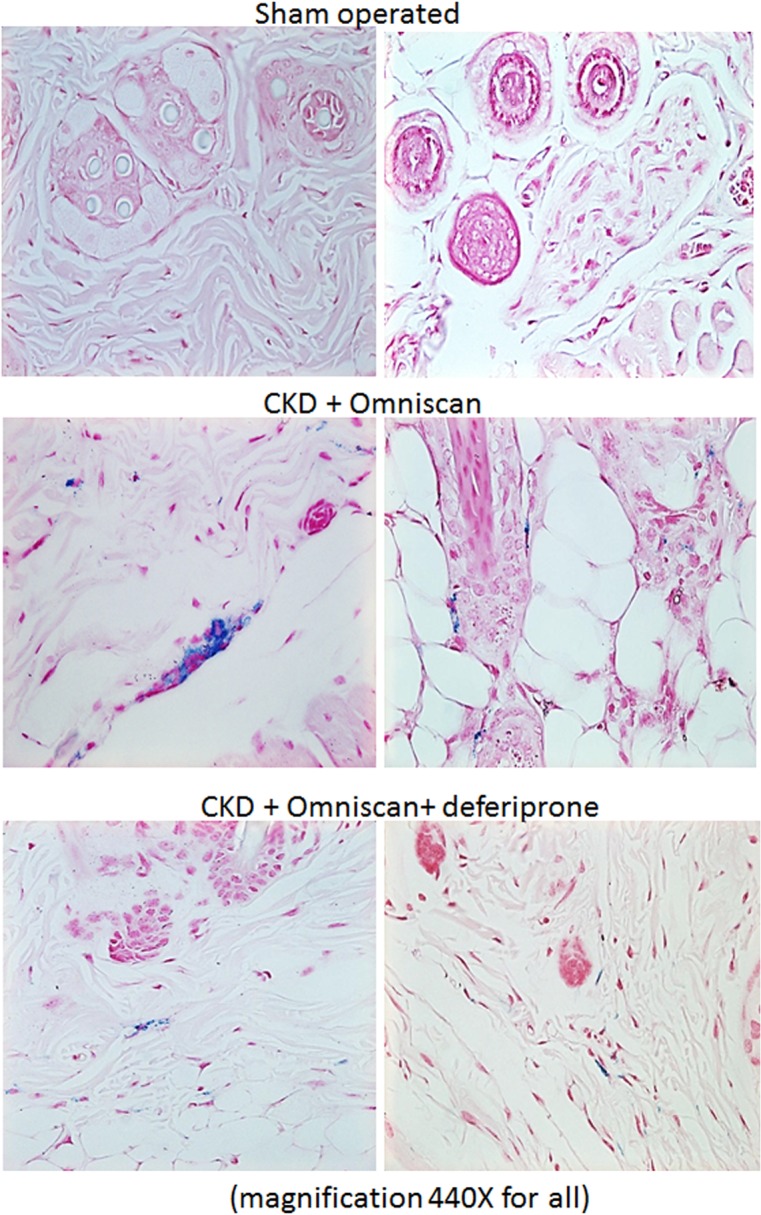
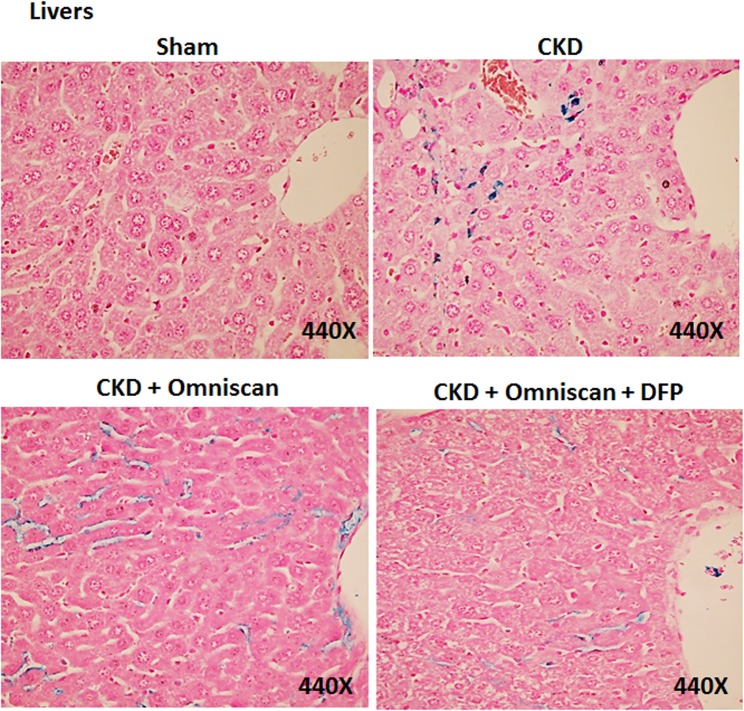
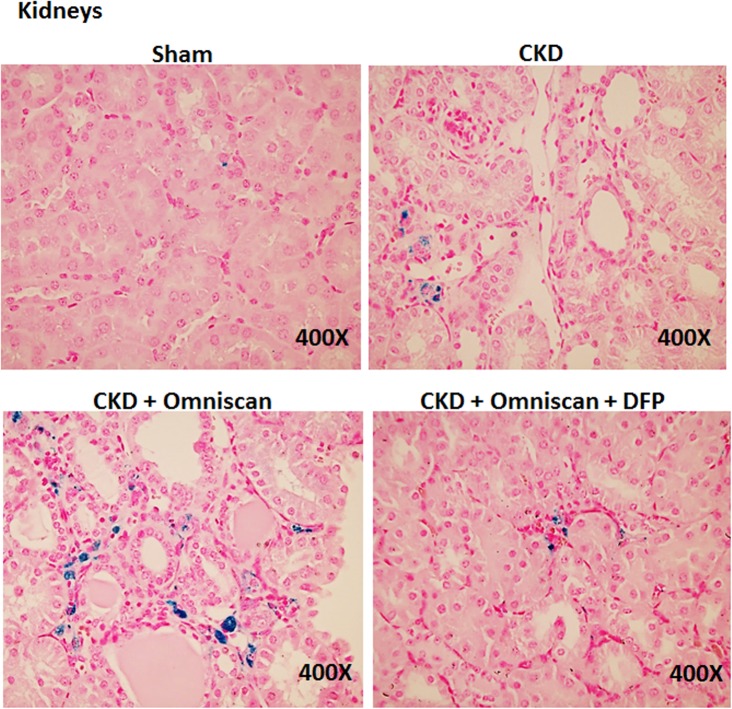
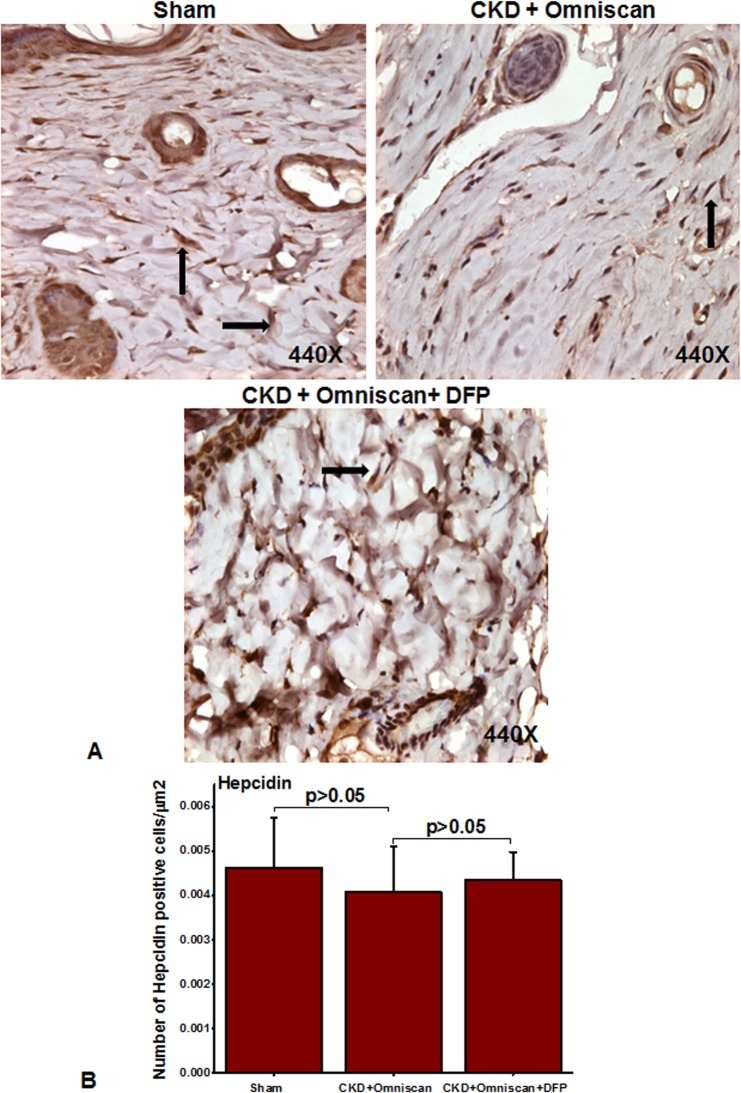
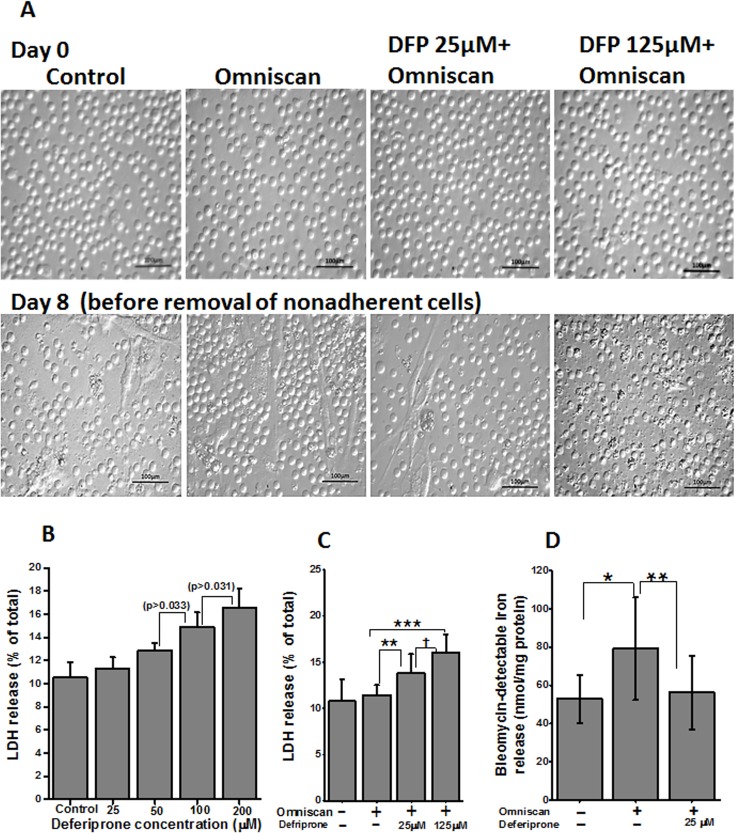
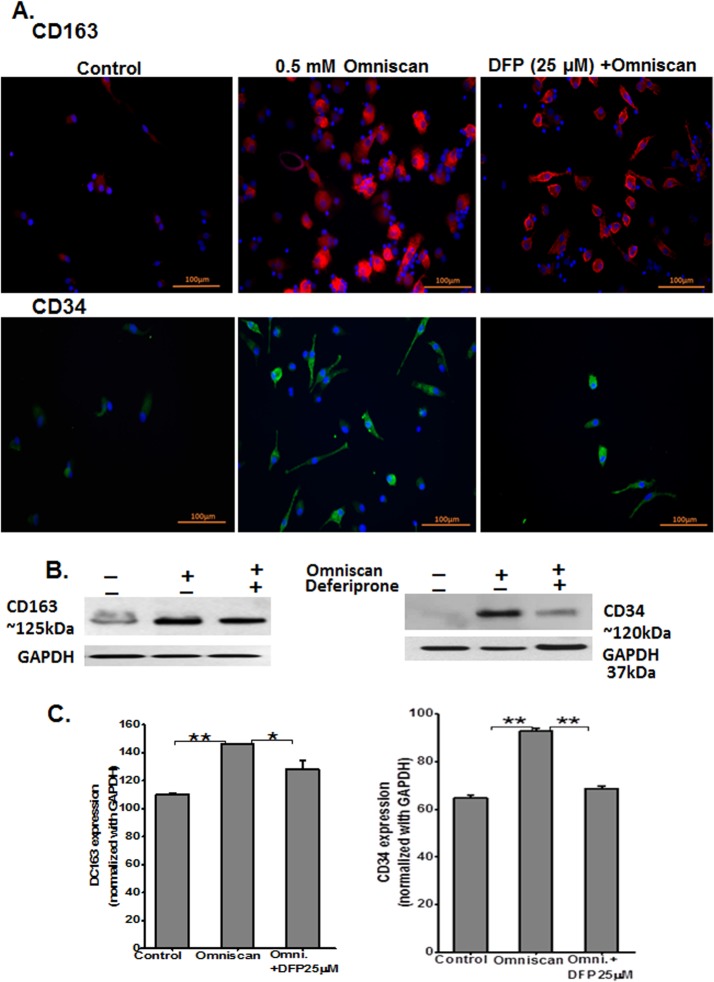
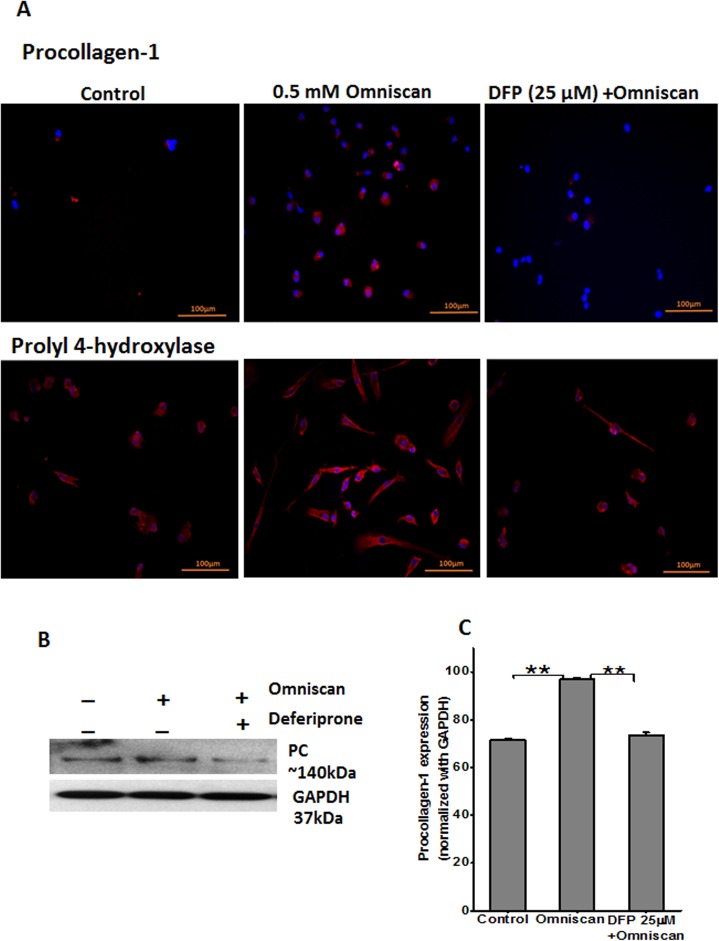
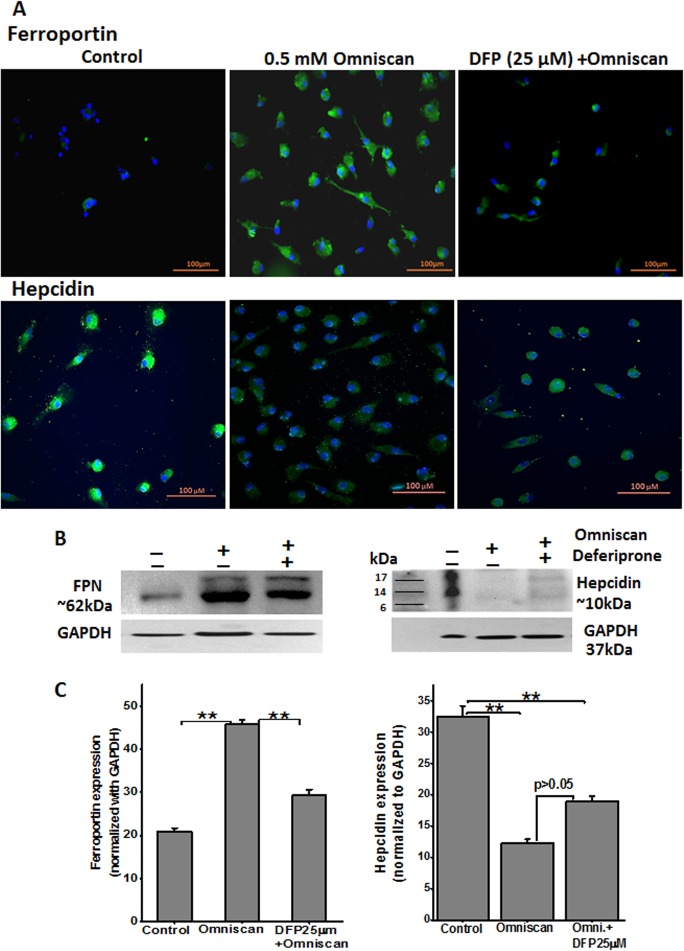
Nephrogenic systemic fibrosis is associated with gadolinium contrast exposure in patients with reduced kidney function and carries high morbidity and mortality. We have previously demonstrated that gadolinium contrast agents induce in vivo systemic iron mobilization and in vitro differentiation of peripheral blood mononuclear cells into ferroportin (iron exporter)-expressing fibrocytic cells. In the present study we examined the role of iron in a mouse model of nephrogenic systemic fibrosis. Chronic kidney disease was induced in 8-week-old male Balb/C mice with a two-step 5/6 nephrectomy surgery. Five groups of mice were studied: control (n = 5), sham surgery control (n = 5), chronic kidney disease control (n = 4), chronic kidney disease injected with 0.5 mmol/kg body weight of Omniscan 3 days per week, for a total of 10 injections (n = 8), and chronic kidney disease with Omniscan plus deferiprone, 125 mg/kg, in drinking water (n = 9). Deferiprone was continued for 16 weeks until the end of the experiment. Mice with chronic kidney disease injected with Omniscan developed skin changes characteristic of nephrogenic systemic fibrosis including hair loss, reddening, ulceration, and skin tightening by 10 to 16 weeks. Histopathological sections demonstrated dermal fibrosis with increased skin thickness (0.25±0.06 mm, sham; 0.34±+0.3 mm, Omniscan-injected). Additionally, we observed an increase in tissue infiltration of ferroportin-expressing, fibrocyte-like cells accompanied by tissue iron accumulation in the skin of the Omniscan-treated mice. The deferiprone-treated group had significantly decreased skin thickness (p<0.05) and significantly decreased dermal fibrosis compared to the Omniscan-only group. In addition, iron chelation prevented tissue infiltration of ferroportin-expressing, fibrocyte-like cells. Our in vitro experiments demonstrated that exposure to Omniscan resulted in the release of catalytic iron and this was prevented by the iron chelator deferiprone. Deferiprone inhibited the differentiation of human peripheral blood mononuclear cells into ferroportin-expressing cells by immunohistochemical staining and western blot analysis. Our studies support an important role of iron in the pathophysiology of gadolinium chelate toxicity and nephrogenic systemic fibrosis.


Conflict of interest statement

Competing Interests: The authors have declared that no competing interests exist.

Figures

Fig 1
Fig 1. Study design and treatment schedule for Omniscan injections and deferiprone treatment.
As mentioned in Materials and Methods, after one week of establishment of CKD, one group of mice was administered deferiprone in drinking water (125mg/kg) two days before starting Omniscan injections. Three injections of Omniscan (0.5 mmol/kg, tail IV, 100 μl volume) per week on alternate days were given to two groups of mice (one received deferiprone and the other received Omniscan only) excluding weekends. A total of 10 injections were given. Control mice (one group of CKD and other was sham) animals received 10 injections of an equivalent volume (100 μl) of saline. After 16 weeks at the endpoint, animals were sacrificed and blood and tissues were collected.
Fig 2
Fig 2. Omniscan-induced NSF in a Balb/C mouse model.
(A) Histopathological findings in the skin of mice with CKD treated with either Omniscan only or Omniscan with deferiprone. Representative images are of dorsal skin biopsies of each group at lower (100X) and higher (440X) magnification H&E stained sections show Omniscan induces dermal thickness, lipoatrophy, inflammatory cells, dermal fibrosis, and a marked increase in cell number and density of collagen bundles (signs of NSF), and deferiprone visibly prevents NSF in mice skin. For fibrocyte-like cells, an arrow represents dendritic cells and an asterisk shows inflammatory cells. (B) A box-whisker chart shows data of the dermal thickness for the sham, CKD, CKD with Omniscan, and CKD with Omniscan and deferiprone (n = 4 for each group). *p<0.05, **p<0.01, ***p<0.001, as compared to indicated group. Box: 2–75 percentile; whiskers: 5–95 percentile; horizontal line: median, square: mean. The significance of differences among groups was evaluated using a one-way analysis of variance (ANOVA) with a posthoc Tukey-Kramer test.
Fig 3
Fig 3. Deferiprone down-regulates Omniscan-induced CD163+ cells in NSF skin as shown by immunohistochemistry (Panel A).
Immunohistochemistry staining shows deferiprone treatment decreases Omniscan-induced CD163+. The top panels (40X) show the comparative skin thickness from each group. Panel B demonstrates the quantitative analysis of the number of positively stained cells in μm2. (**p<0.01 Omniscan alone compared with control or Omniscan treated compared with deferiprone and Omniscan).
Fig 4
Fig 4. Deferiprone down-regulates Omniscan-induced procollagen-1+ cells in NSF skin as shown by immunohistochemistry.
As indicated by arrows, Omniscan induced procollagen-1+ cells and accumulation of collagen bundles in the skin of CKD mice. Quantitative analysis of the number of positively stained cells is in μm2. (**p<0.01 Omniscan alone compared with control or Omniscan-treated compared with deferiprone and Omniscan).
Fig 5
Fig 5. Expression of CD34+ cells in NSF skin as shown by immunohistochemistry.
Panel A shows (as indicated by arrows) more CD34+ cells in CKD skin of Omniscan-injected mice. This was significant statistically (***p<0.001, Panel B). Quantitative analysis shows that CD34 was not reduced significantly with deferiprone treatment (Panel B).
Fig 6
Fig 6. Deferiprone inhibits histopathological signs in skin of CKDmice.
(A) Histopathological findings in the skin of mice with CKD and CKD mice treated with 125 mg/kg deferiprone for 16 weeks. Representative images are of dorsal skin biopsies of each group at 200X magnification H&E stained sections. (B) A box-whisker chart shows the data of the dermal thickness for the sham, CKD, CKD mice with deferiprone (n = 4 for sham, n = 10 for CKD, n = 12 for CKD mice treated with deferiprone). Data shows there was no significant difference between CKD and mice treated with deferiprone, NS = not significant. Box: 25–75 percentile; whiskers: 5–95 percentile; horizontal line: median, square: mean. The significance of differences among groups was evaluated by a one-way analysis of variance (ANOVA) and with a posthoc Tukey-Kramer test.
Fig 7
Fig 7. Presence of iron in NSF skin.
A bright-field image shows Prussian Blue positive staining for presence of iron in mouse skin injected with 0.5 mM Omniscan and treated with 125 mg/kg deferiprone. Sections were counterstained with Nuclear Fast Red (magnification, 440X for all).
Fig 8
Fig 8. Iron deposition in liver.
As shown, Omniscan-injected mice have more iron staining in liver sinusoidal Kupffer cells. Deferiprone treatment reduced the iron-positive cells markedly.
Fig 9
Fig 9. Iron deposition in kidneys.
Omniscan-injected mice have more iron staining in the interstitial cells of kidneys, followed by the CKD-only group. Deferiprone treatment reduced the iron staining markedly in the kidneys of Omniscan-induced CKD mice.
Fig 10
Fig 10. Ferroportin in Omniscan-injected mice.
Omniscan significantly induces the iron transport protein “ferroportin” in mouse skin. Deferiprone treatment markedly decreases Omniscan-induced ferroportin expression in the mouse skin biopsies. Panel B demonstrates the quantitative measurements of positive cells in μm2. Significance of the data was determined by ANOVA, followed by paired-group comparisons. (***p <0.001 Omniscan-treated compared with deferiprone and Omniscan, or compared with Omniscan alone and control).
Fig 11
Fig 11. Expression of hepcidin in Omniscan-injected CKD mice.
Hepcidin was slightly down-regulated after Omniscan treatment. Pretreatment with deferiprone partially increased hepcidin expression.
Fig 12
Fig 12. Effect of deferiprone on cell cytotoxicity.
(A) Light microscopic images on day 0 shows an equal number of PBMCs for each group. (B) LDH release by PBMC after treatment with deferiprone for 8 days. Adherent cells were lysed and supernatant media were collected from these cultures and analyzed for LDH release. The data presented shows no significant cytotoxicity on lower concentrations of deferiprone from control. LDH release was slightly increased on 100 and 200 μM concentrations of deferiprone, p > 0.033 and p > 0.031, respectively. Data points represent means ± SD of 3 separate studies. (C) LDH release by PBMC treated with 0.5 mmol of Omniscan and deferiprone together. PBMC were treated with Omniscan and deferiprone for 8 days. LDH release was measured as above. As shown in the histogram, both doses of deferiprone used (25μM and 125μM) showed significant LDH release (**p<0.01, ***p<0.001, respectively) when compared to untreated cells, but, as seen in the lower panels of light microscopic images of the treated cells, 25 μM deferiprone with Omniscan was not toxic to the cells. Images were taken before removing nonadherent and dead cells. A higher dose showed toxicity (†p<0.01) and it was confirmed with a Trypan blue exclusion test. Data presented here are from 3 separate studies. (D) Effect of deferiprone on Omniscan-induced catalytic iron release by PBMC. Deferiprone treatment decreases the release of catalytic iron of Omniscan-treated human PBMC, as shown by use of a bleomycin-detectable iron assay. At the end of the experiments, the cell culture supernatant was collected for the measurement of bleomycin-detectable iron. Values are means ±SD, n = 3, *p <0.05 compared with control, **p <0.01, deferiprone and Omniscan treated compared with Omniscan alone.
Fig 13
Fig 13. Expression of Omniscan-induced macrophage (CD163) and fibrotic markers (CD34) are iron-regulated, as shown by PBMC in vitro.
Expression of CD163 and fibrotic markers are iron-regulated, as shown by immunofluorescence staining of human PBMC treated with 0.5 mM Omniscan plus deferiprone for 8 days. (A) Representative images show CD163 and CD34 expression by Omniscan, and 25 μM of deferiprone effectively inhibited differentiation of the cells and expression of these markers. (Scale bars 100 μm for all). Western blot and quantitative analysis for western blots are shown in Figs (B) and (C). GAPDH was used as loading control. Values are means ±SD, obtained from 3 separate experiments. Significance of the data was determined by ANOVA, followed by paired-group comparisons. (*p <0.05, for CD163, **p <0.01 for CD34 for Omniscan-treated compared with Omniscan plus deferiprone, **p <0.01, compared with Omniscan alone and control).
Fig 14
Fig 14. Expression of fibrotic markers procollagen-1 and prolylyl-4-hydroxylase as shown by immunofluorescence staining PBMC treated with Omniscan.
(A) Representative images show procollagen-1 and prolylyl-4-hydroxylase expression by Omniscan and 25 μM of deferiprone effectively inhibited the expression and differentiation of the cells of these markers (scale bars 100 μm for all). Western blot and quantitative analysis for western blots are shown in Figs (B) and (C). Values are means ±SD, obtained from 3 separate experiments, Significance of the data was determined by ANOVA, followed by paired-group comparisons. (**p <0.01).
Fig 15
Fig 15. Omniscan-induced cells express iron metabolism proteins.
(A) Expression of ferroportin and other iron regulatory protein hepcidin by human PBMC treated with 0.5 mM Omniscan and deferiprone for 8 days, as shown by immunocytochemistry staining. Representative images are shown. Deferiprone treatment significantly decreased Omniscan-induced ferroportin expression as shown by western blot analysis (B) left panel. After Omniscan treatment, hepcidin expression was decreased in comparison to untreated cells (A) lower panels, (B) right panels, western blot. Omniscan treatment with deferiprone increased the expression slightly. Representative blots from 3 separate experiments are shown. Values are means ±SD, obtained from 3 separate experiments, Significance of the data was determined by ANOVA, followed by paired-group comparisons. **p <0.01, compared with control, *p <0.05 (for hepcidin), **p <0.01 (for ferroportin) deferiprone- and Omniscan-treated compared with Omniscan alone. (Scale bars 100 μm for all).

Similar articles

Cited by

References

    1. Cowper SE (2008) Nephrogenic systemic fibrosis: an overview. J Amer Coll Radiol 5: 23–28. - PubMed
    1. Cowper SE, Su LD, Bhawan J, Robin HS, LeBoit PE (2001) Nephrogenic fibrosing dermopathy. Am J Dermatopathol 23: 383–393. - PubMed
    1. Swaminathan S, High WA, Ranville J, Horn TD, Hiatt K, Thomas M, et al. (2008) Cardiac and vascular metal deposition with high mortality in nephrogenic systemic fibrosis. [see comment]. Kidney Int 73: 1413–1418. 10.1038/ki.2008.76 - DOI - PubMed
    1. Todd DJ, Kagan A, Chibnik LB, Kay J (2007) Cutaneous changes of nephrogenic systemic fibrosis: Predictor of early mortality and association with gadolinium exposure. Arthritis Rheum 56: 3433–3441. - PubMed
    1. Swaminathan S, Horn TD, Pellowski D, Abul-Ezz S, Bornhorst JA, Hiatt K, et al. (2007) Nephrogenic systemic fibrosis, gadolinium, and iron mobilization. New Engl J Med 357: 720–722. - PubMed

Publication types

MeSH terms